
Examining key levels for each financial instrument and likely scenarios of developments.
Key Topics
- Euro (EURUSD)
- British Pound (GBPUSD)
- Japanese Yen (USDJPY)
- Canadian Dollar (USDCAD)
- Australian Dollar (AUDUSD)
- Bitcoin (BTC)
- Ether (ETH)
- Apple Inc (AAPL)
- NVIDIA Corp (NVDA)
- Tesla Inc (TSLA)
- Summary
Euro (EURUSD)
The trend changed to bearish 4 candlesticks ago, when the support level (1.1703 — 1.1710) was broken. An impulse wave is developing. Entry points for selling on rebound may appear after the formation of a correction.
The intermediate target for the downward movement is the support level with boundaries 1.1615 — 1.1628. In case of successful trend development, a further target will be at the support level with boundaries 1.1491 — 1.1513.
If the next correction ends near the resistance level (1.1795 — 1.1808), the potential profit/risk ratio may be approximately 3:1. When using a further target — more than 5:1. If the next correction ends near the last broken level (1.1703 — 1.1710), the potential profit/risk ratio may be small (approximately 0.5:1). When selecting a further target — approximately 1.3:1.
Short positions will remain relevant, as long as the market remains below the nearest resistance level with boundaries 1.1795 — 1.1808. If the market successfully settles above this nearest resistance, the trend will change to the opposite (bullish).
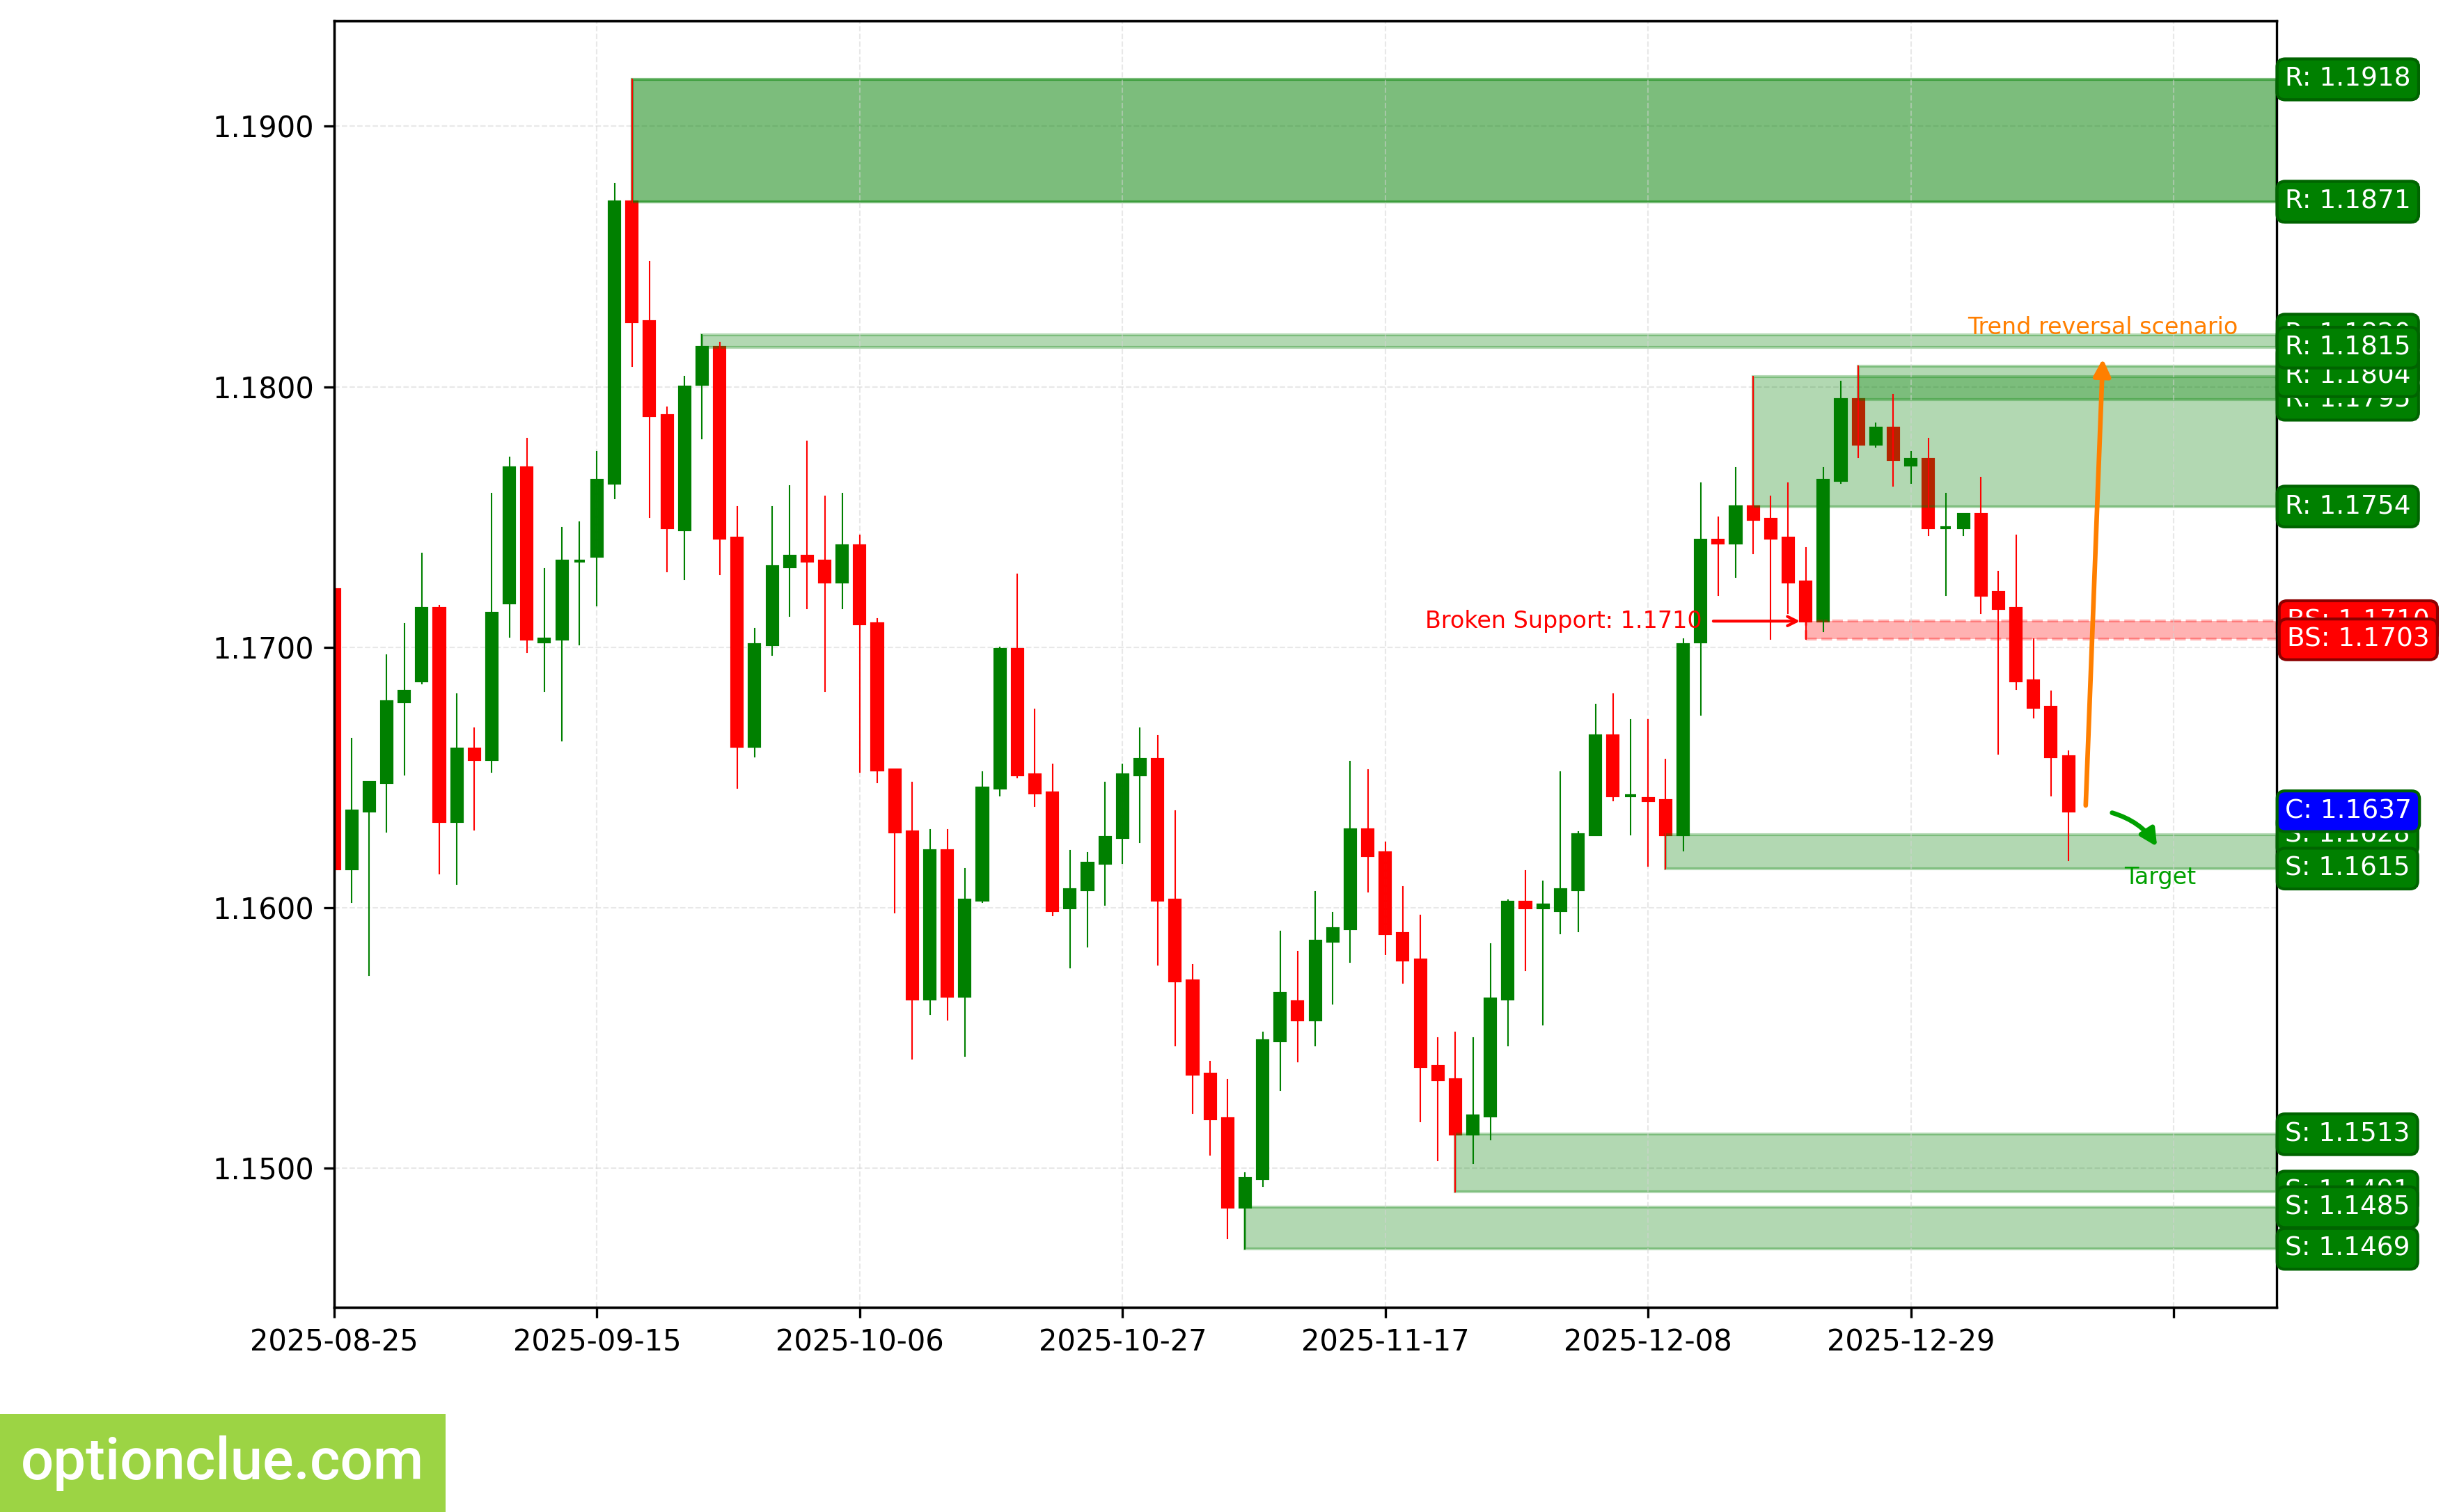
EURUSD. Technical Analysis. D1.
British Pound (GBPUSD)
The trend changed to bullish, when the resistance level (1.3476 — 1.3502) was broken. The breakout occurred 5 candlesticks ago. A corrective wave is developing. An entry point for buying on rebound may form after the completion of the current correction.
The intermediate target for the upward movement is the resistance level with boundaries 1.3533 — 1.3568. In case of successful trend development, a further target will be at the resistance level with boundaries 1.3653 — 1.3726.
The potential profit/risk ratio from current prices when setting targets and fixing risks based on daily timeframe levels may be small (approximately 0.7:1). When using a further target — approximately 1.4:1. If the correction ends near the support level (1.3312 — 1.3374), the potential profit/risk ratio may be around 1.8:1. When selecting a further target — approximately 2.9:1.
Long positions will remain relevant, as long as the market is above the nearest support level with boundaries 1.3312 — 1.3374. If the market successfully settles below this support, the trend will change to the opposite (bearish).
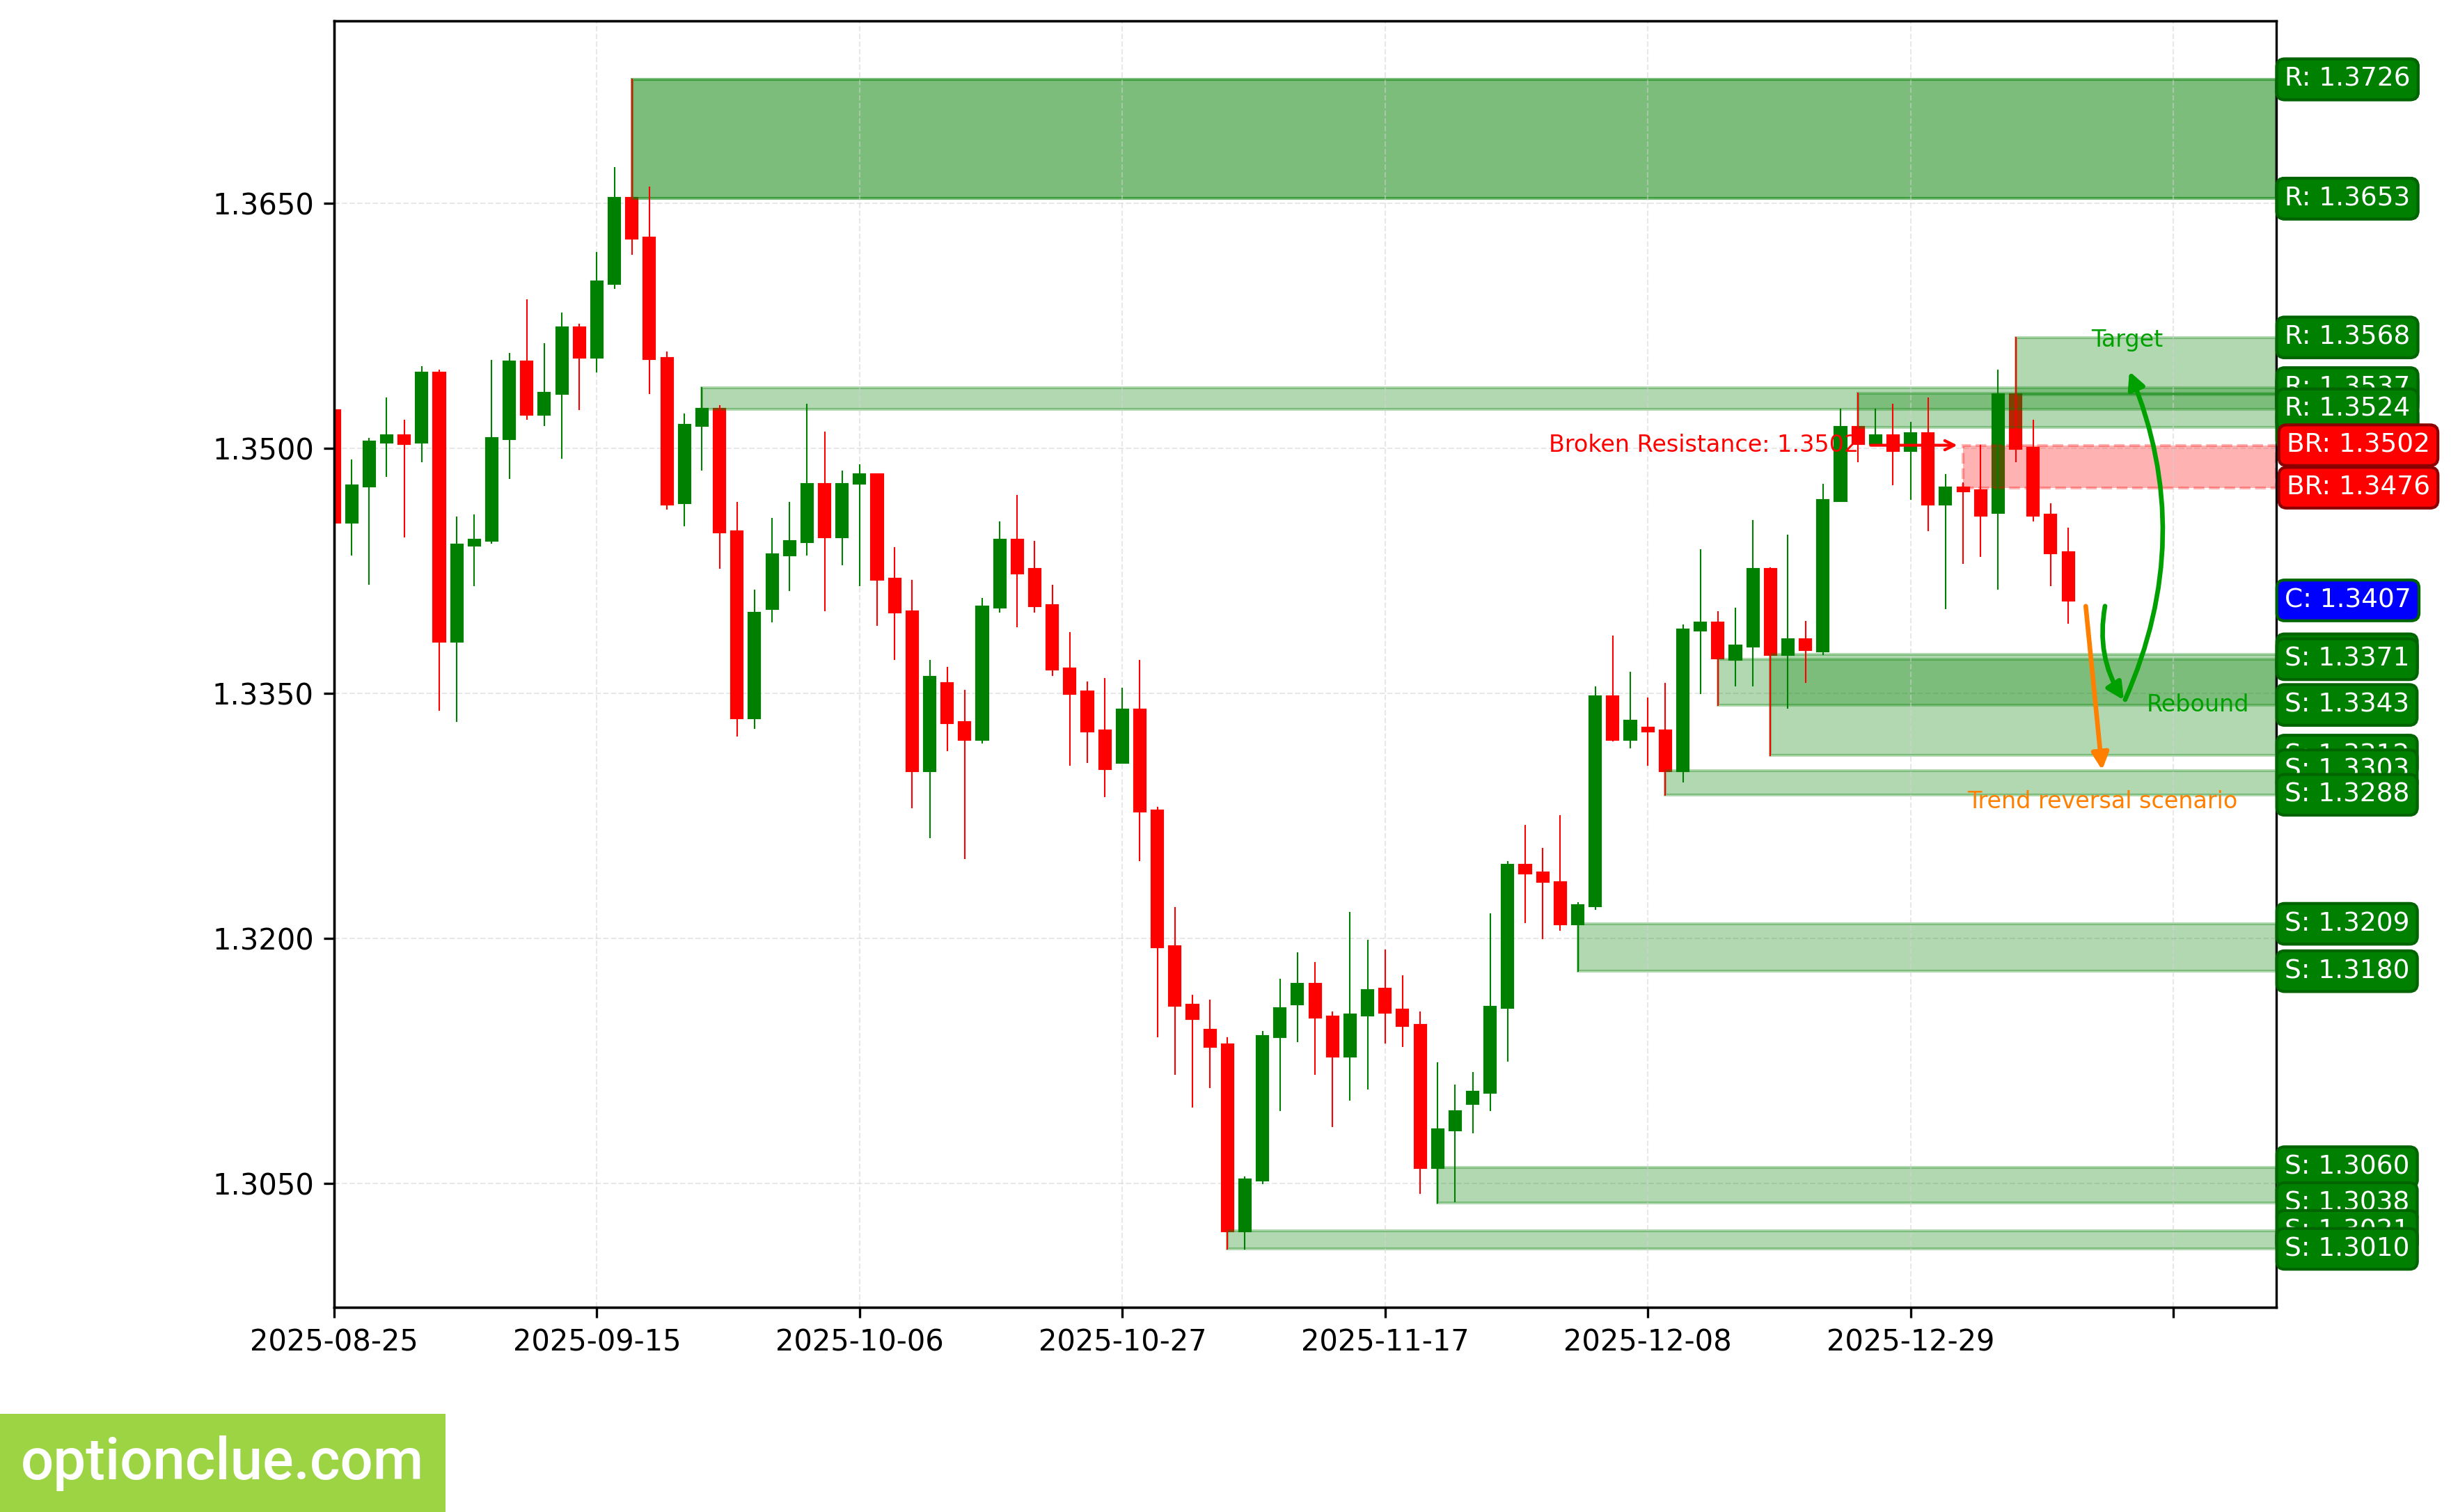
GBPUSD. Technical Analysis. D1.
Japanese Yen (USDJPY)
The bullish trend continues, impulse is developing. The last broken level is resistance (157.73 — 157.78). The breakout occurred on the last closed candlestick.
The intermediate target for the upward movement is the resistance level with boundaries 158.23 — 158.55. In case of successful trend development, a further target will be at the resistance level with boundaries 161.69 — 161.85.
If the correction ends near the support level (156.12 — 156.62), the potential profit/risk ratio may be approximately 1.6:1. When using a further target — more than 4:1. If the correction ends near the last broken level (157.73 — 157.78), the potential profit/risk ratio may be small (around 0.2:1). When selecting a further target — around 1.5:1.
Long positions will remain relevant, as long as the market is above the nearest support level with boundaries 156.12 — 156.62. If the market successfully settles below this support, the trend will change to the opposite (bearish).
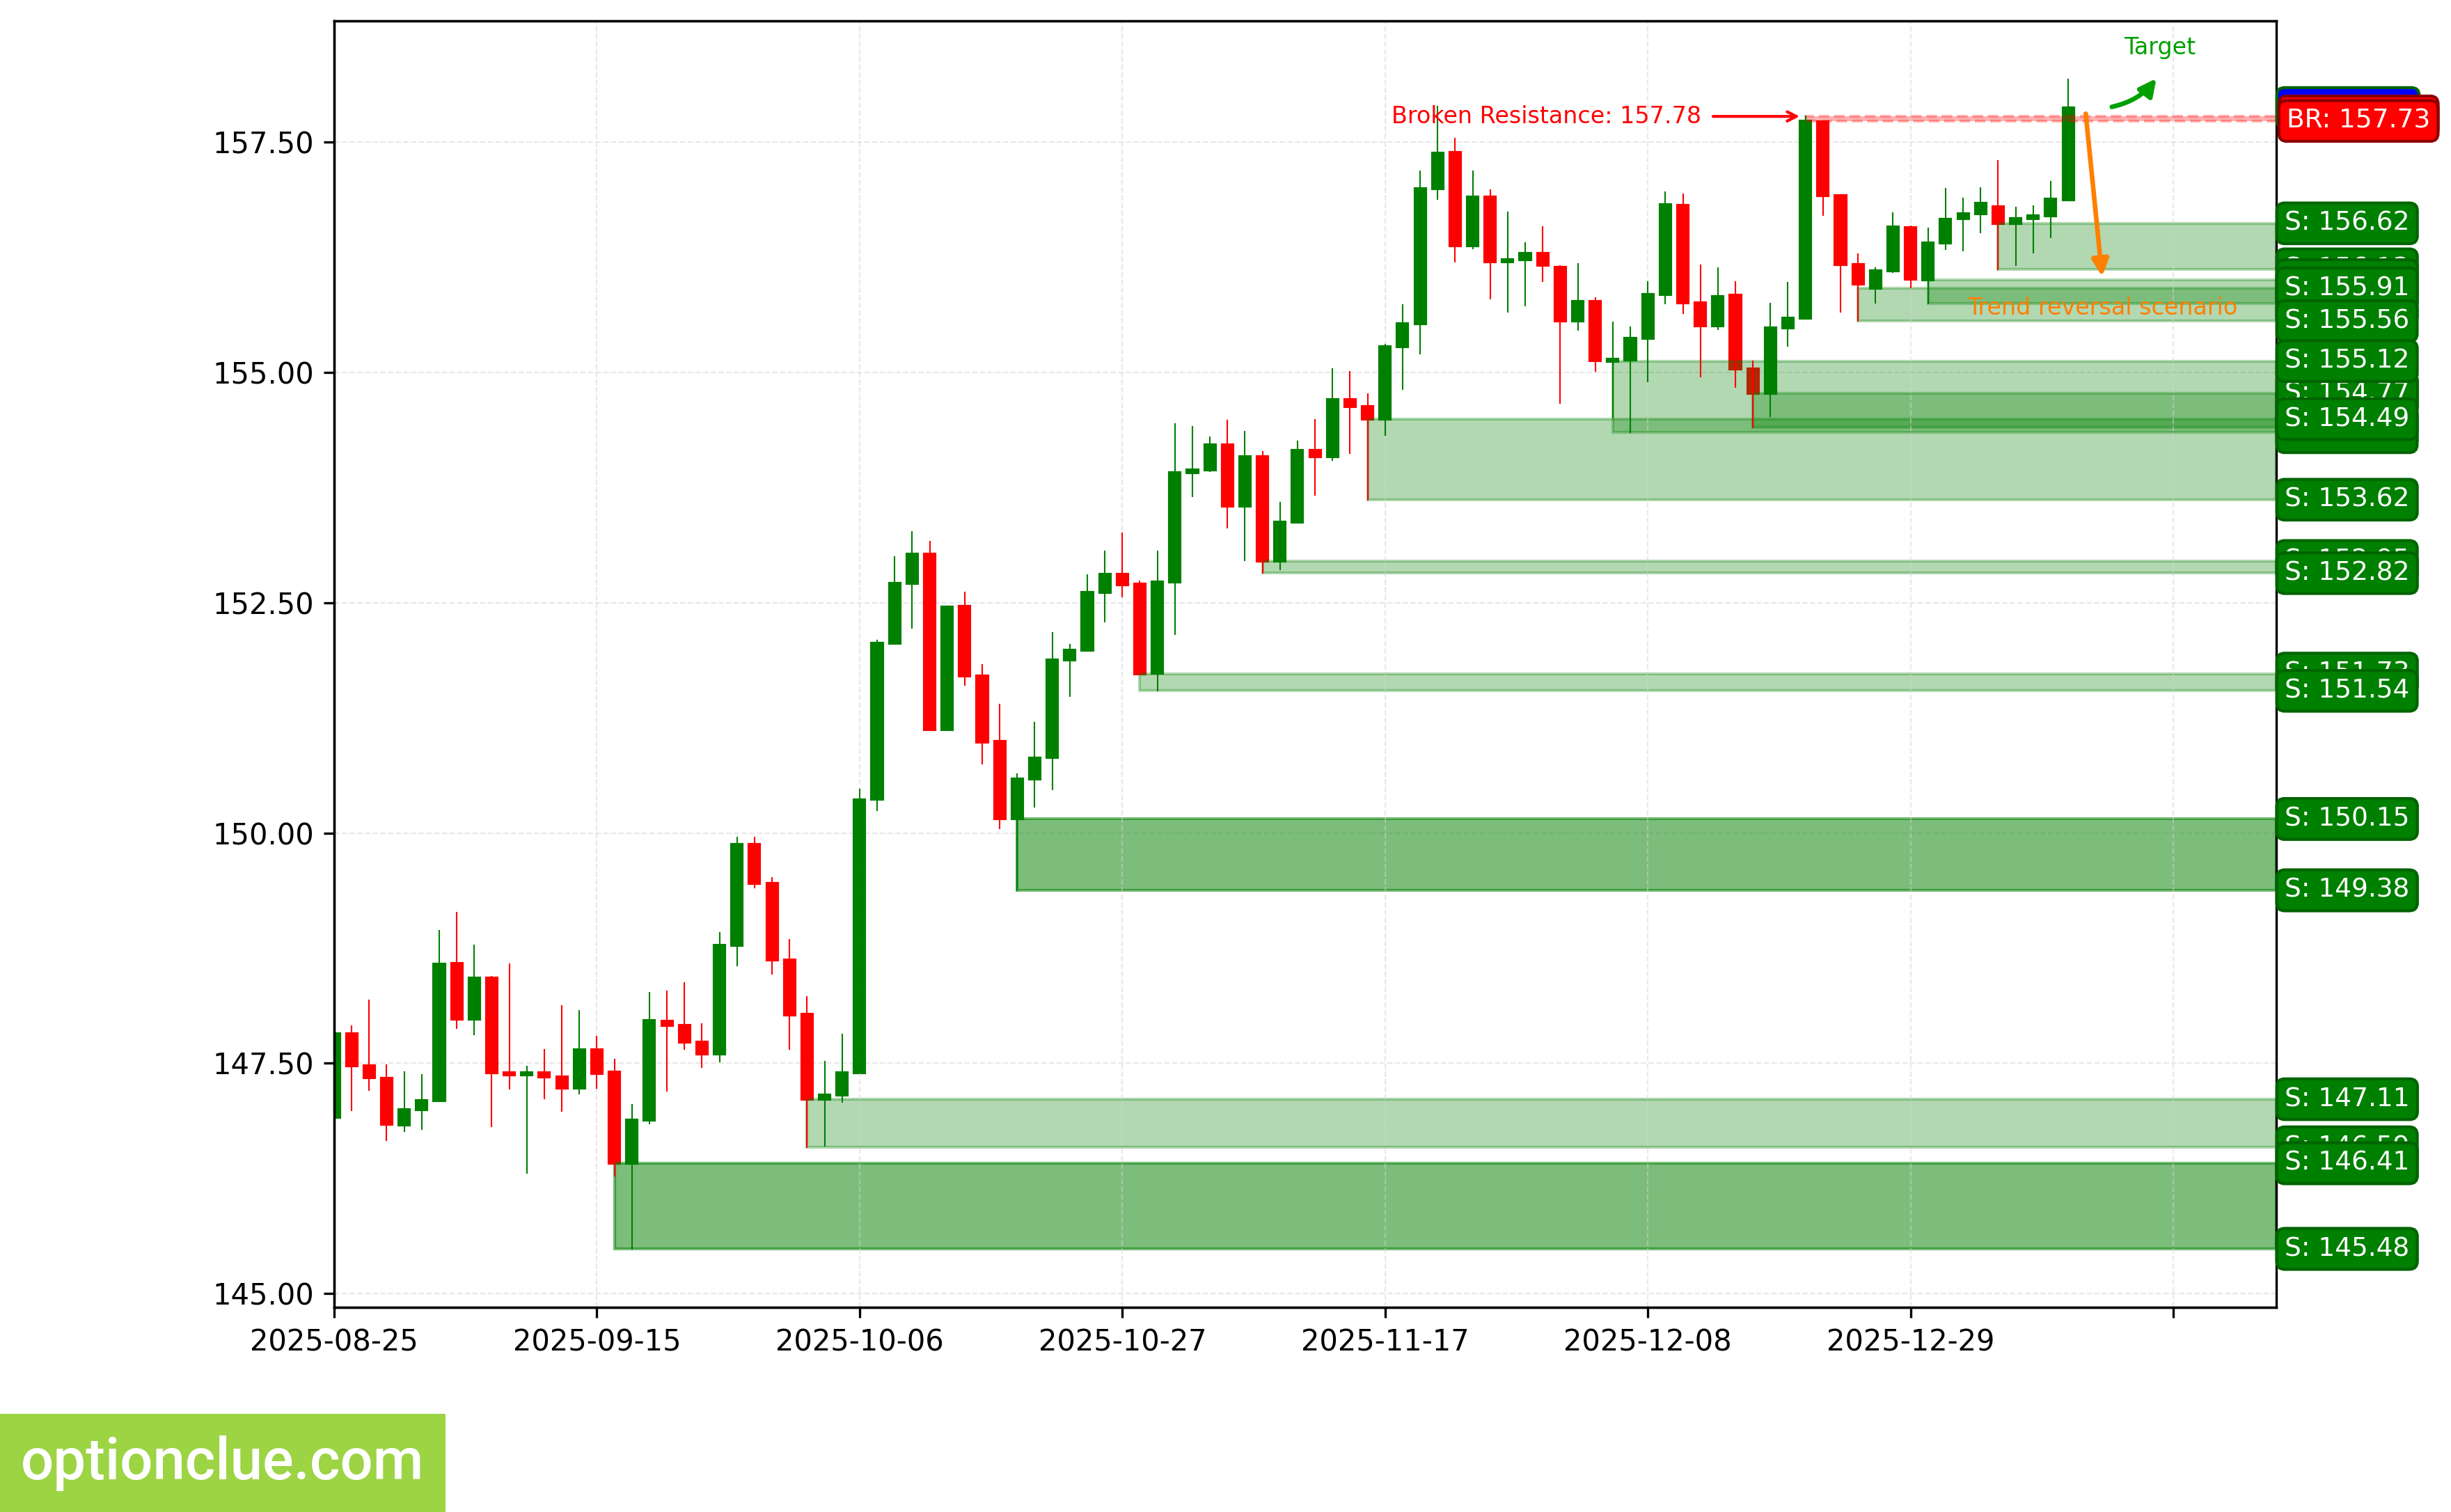
USDJPY. Technical Analysis. D1.
Canadian Dollar (USDCAD)
The trend changed to bullish, when the resistance level (1.3802 — 1.3805) was broken. The breakout occurred 4 candlesticks ago. An impulse wave is developing.
The intermediate target for the upward movement is the resistance level with boundaries 1.3956 — 1.3960. In case of successful trend development, a further target will be at the resistance level with boundaries 1.4108 — 1.4124.
The potential profit/risk ratio from current prices when setting targets and fixing risks based on daily timeframe levels may be small (approximately 0.1:1). When using a further target — also small (around 0.6:1). If the next correction ends near the support level (1.3640 — 1.3670), the potential profit/risk ratio may be around 3.9:1. When using a further target — around 5.9:1. If the next correction ends near the last broken level (1.3802 — 1.3805), the potential profit/risk ratio may be small (around 0.7:1). When selecting a further target — approximately 1.3:1.
Long positions will remain relevant, as long as the market is above the nearest support level with boundaries 1.3640 — 1.3670. If the market successfully settles below this support, the trend will change to the opposite (bearish).
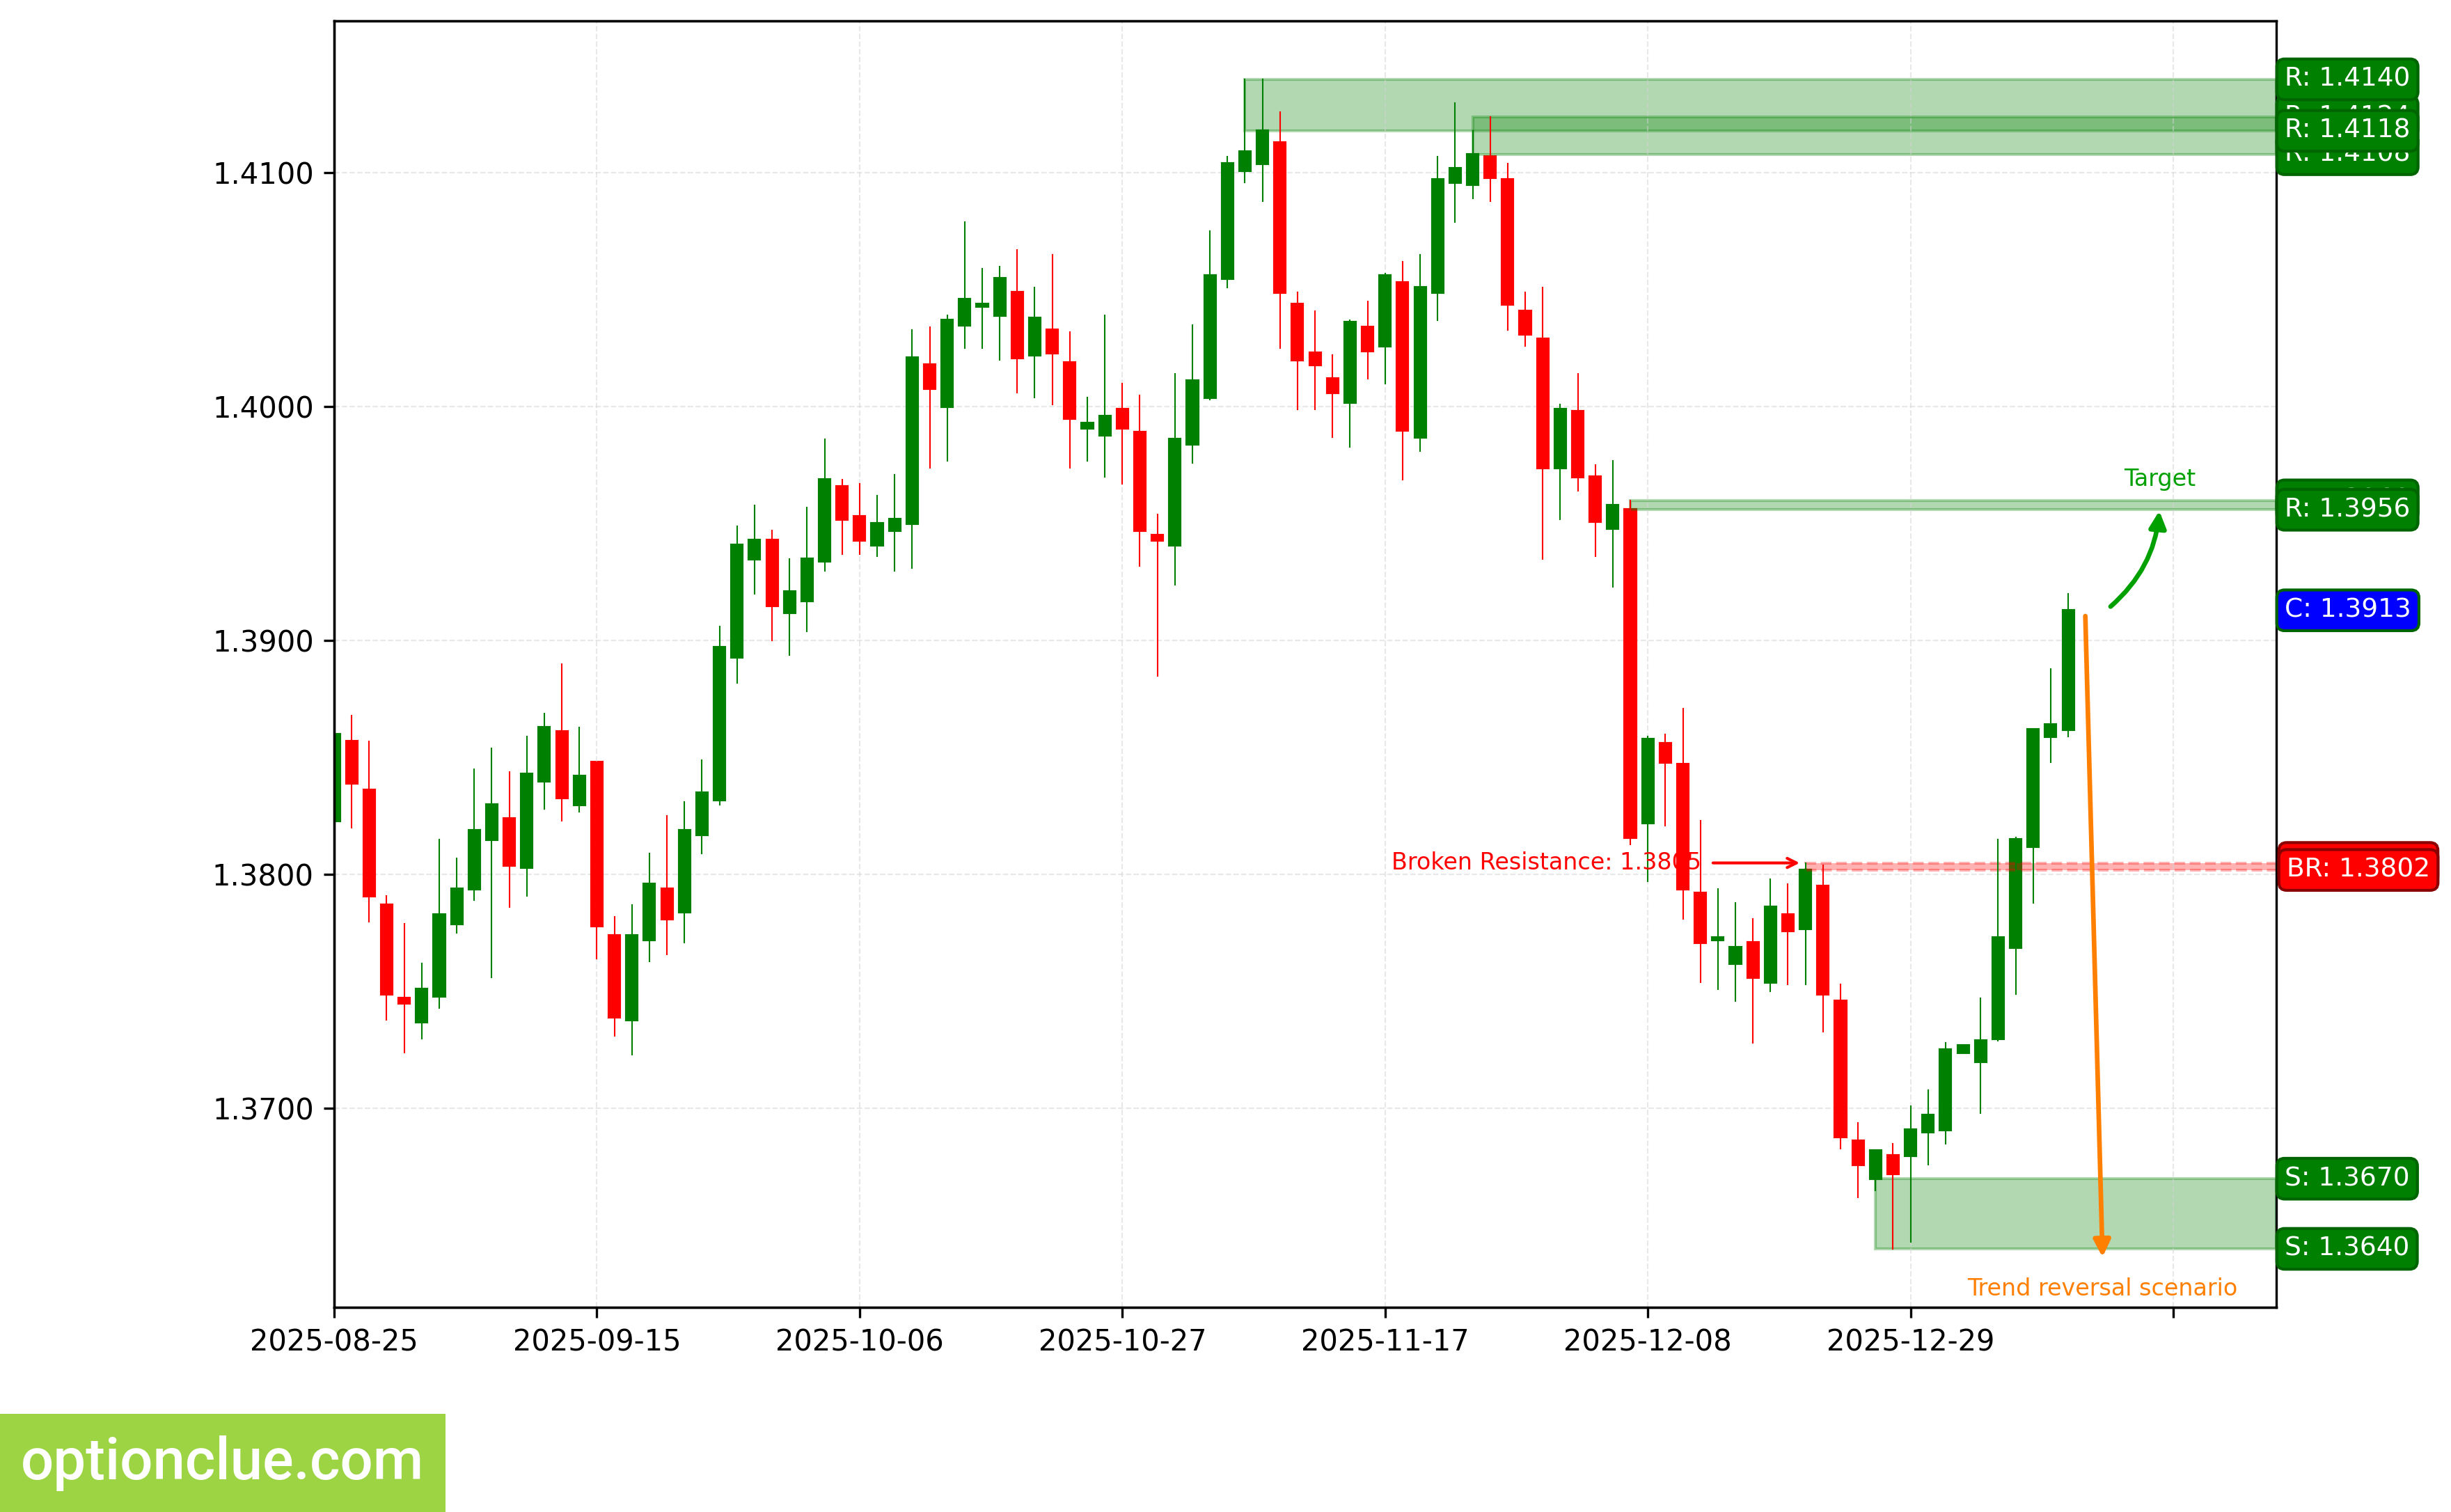
USDCAD. Technical Analysis. D1.
Australian Dollar (AUDUSD)
The bullish trend continues, a corrective wave is developing. An entry point for buying on rebound may form after the completion of the current correction. The last broken level is resistance (0.6716 — 0.6727). The breakout occurred 4 candlesticks ago.
The intermediate target for the upward movement is the resistance level with boundaries 0.6737 — 0.6766. In case of successful trend development, a further target will be at the resistance level with boundaries 0.6915 — 0.6942.
The potential profit/risk ratio from current prices when setting targets and fixing risks based on daily timeframe levels may be small (approximately 0.4:1). When using a further target — approximately 1.7:1. If the correction ends near the support level (0.6590 — 0.6603), the potential profit/risk ratio may be around 2.7:1. When using a further target — more than 6:1.
Long positions will remain relevant, as long as the market is above the nearest support level with boundaries 0.6590 — 0.6603. If the market successfully settles below this support, the trend will change to the opposite (bearish).
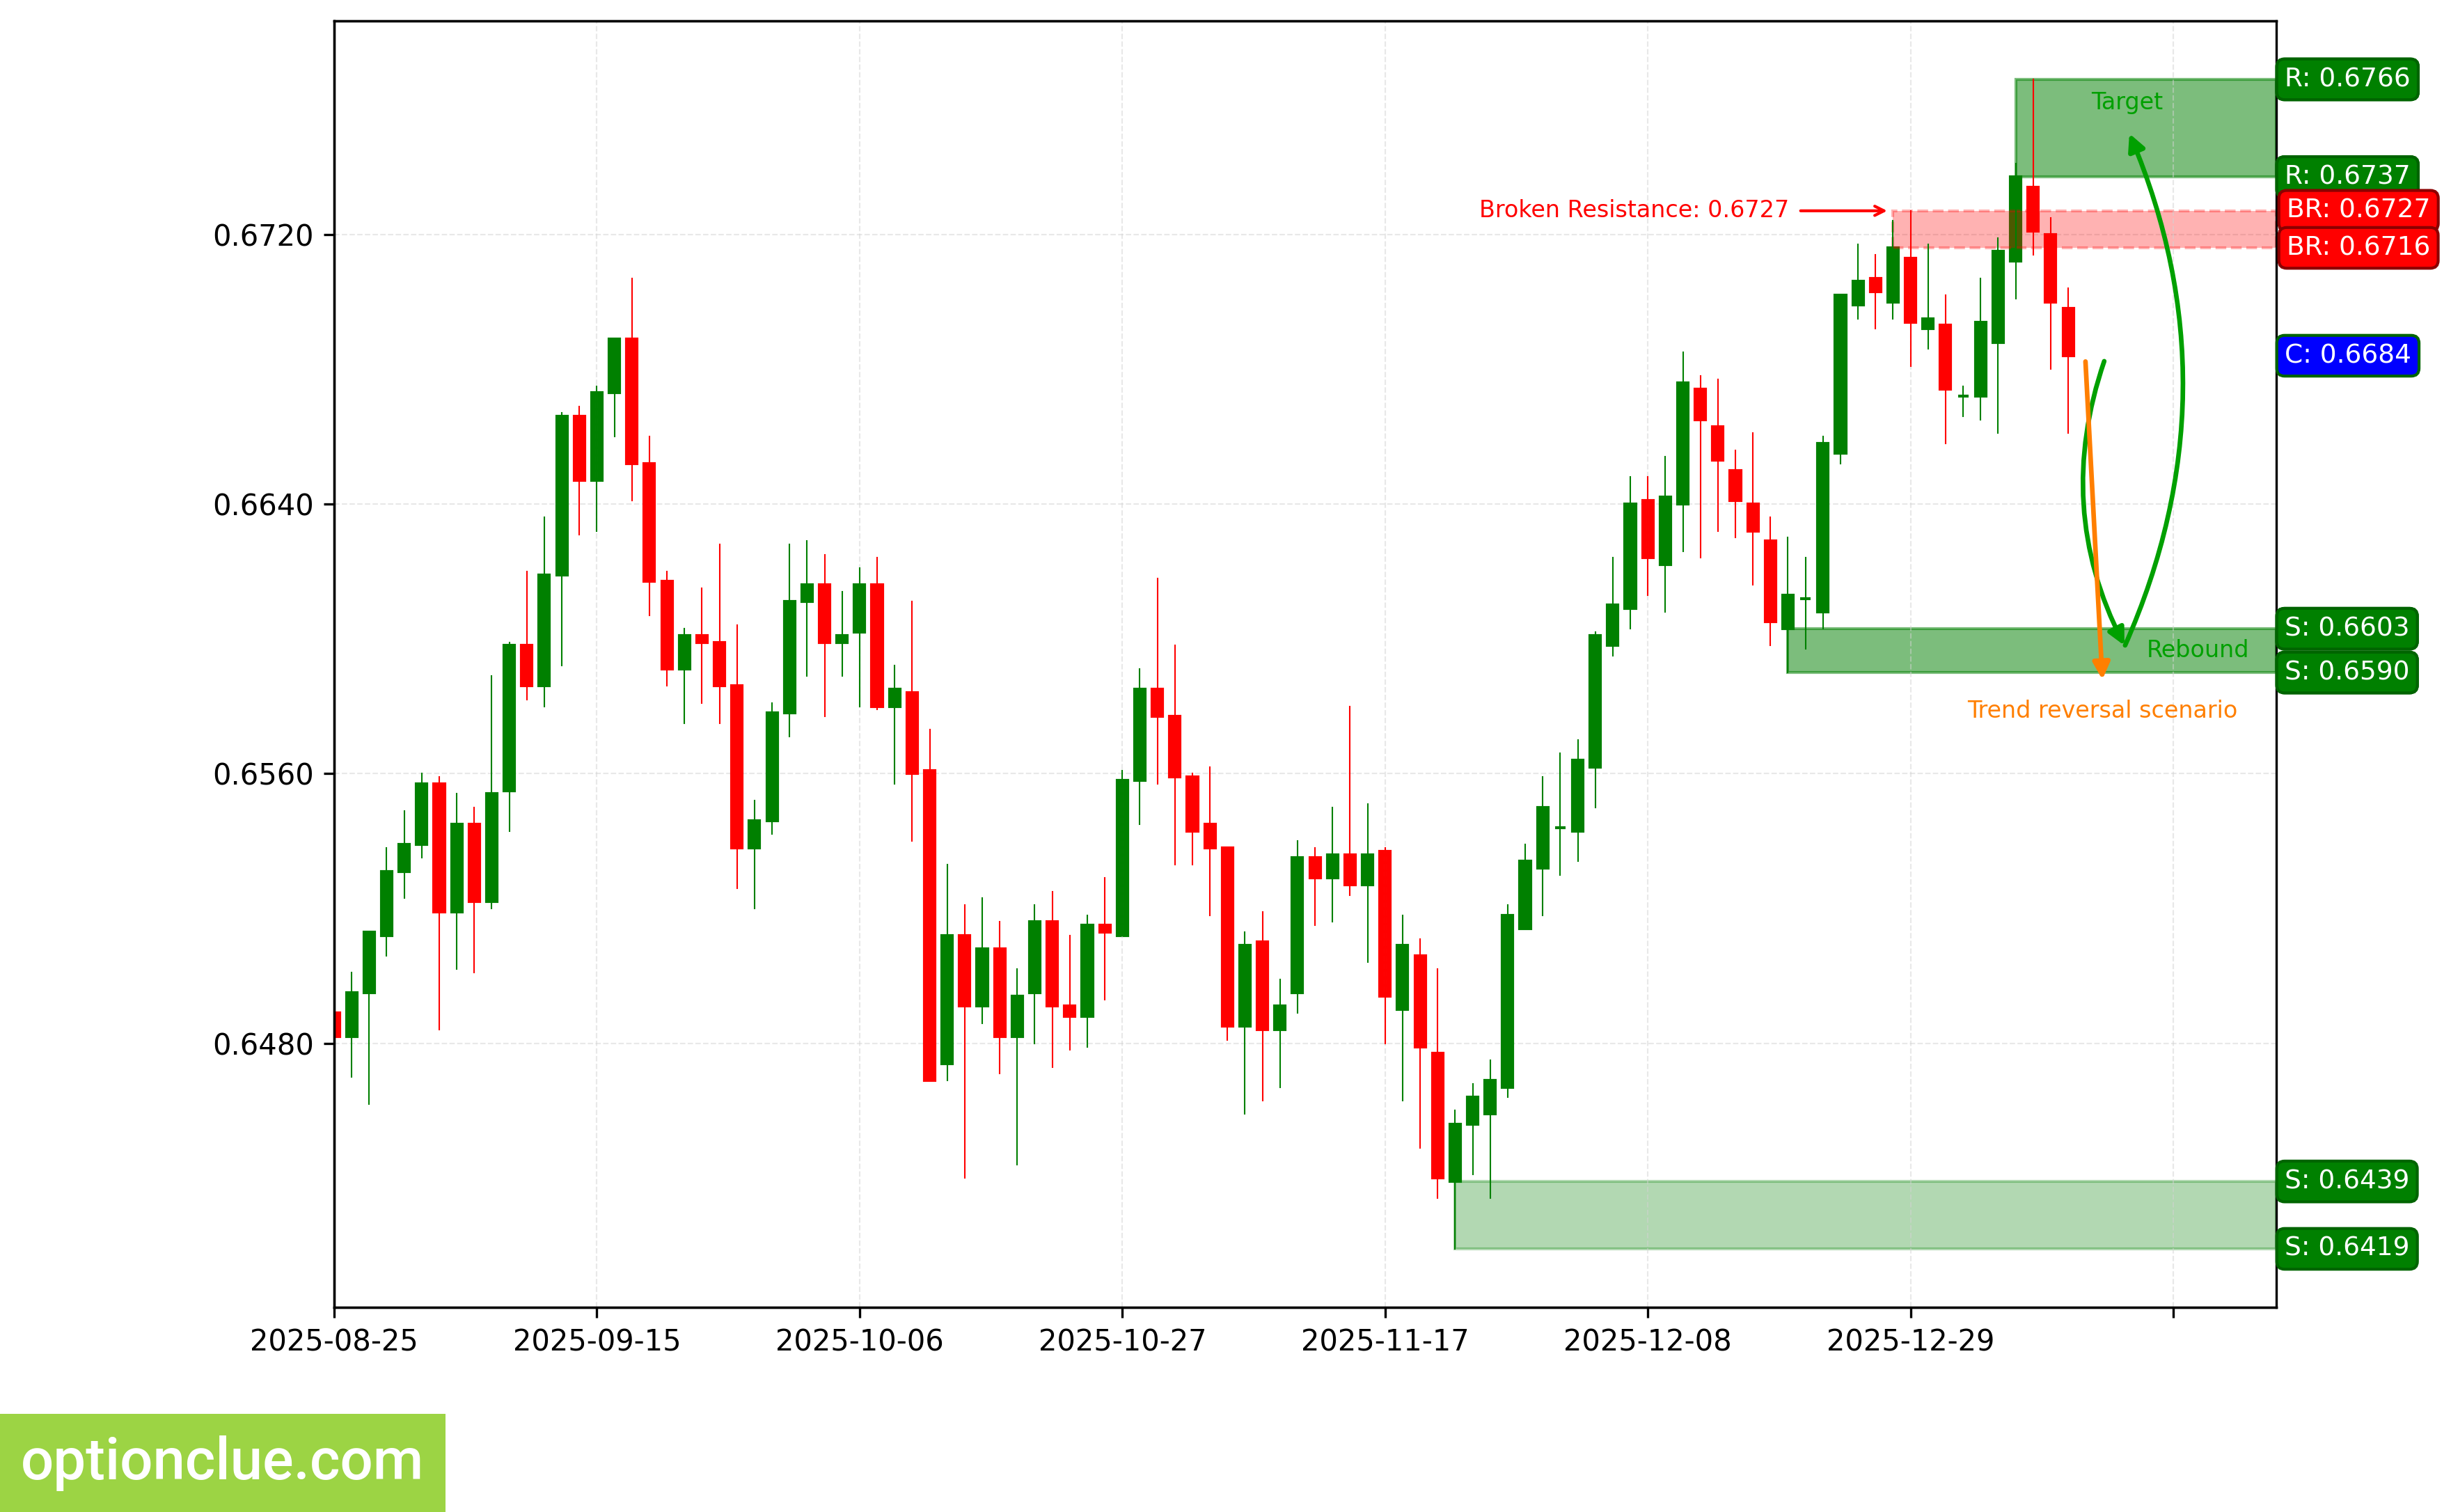
AUDUSD. Technical Analysis. D1.
Bitcoin (BTC)
The bullish trend continues, a corrective wave is developing. An entry point for buying on rebound may form after the completion of the current correction. The last broken level is resistance (88622 — 90502). The breakout occurred 7 candlesticks ago.
The intermediate target for the upward movement is the resistance level with boundaries 93883 — 94762. In case of successful trend development, a further target will be at the resistance level with boundaries 105997 — 107428.
The potential profit/risk ratio from current prices when setting targets and fixing risks based on daily timeframe levels may be small (approximately 0.6:1). When using a further target — around 2.5:1. If the correction ends near the support level (86628 — 87235), the potential profit/risk ratio may be around 2.7:1. When using a further target — around 7.5:1.
Long positions will remain relevant, as long as the market is above the nearest support level with boundaries 86628 — 87235. If the market successfully settles below this support, the trend will change to the opposite (bearish).
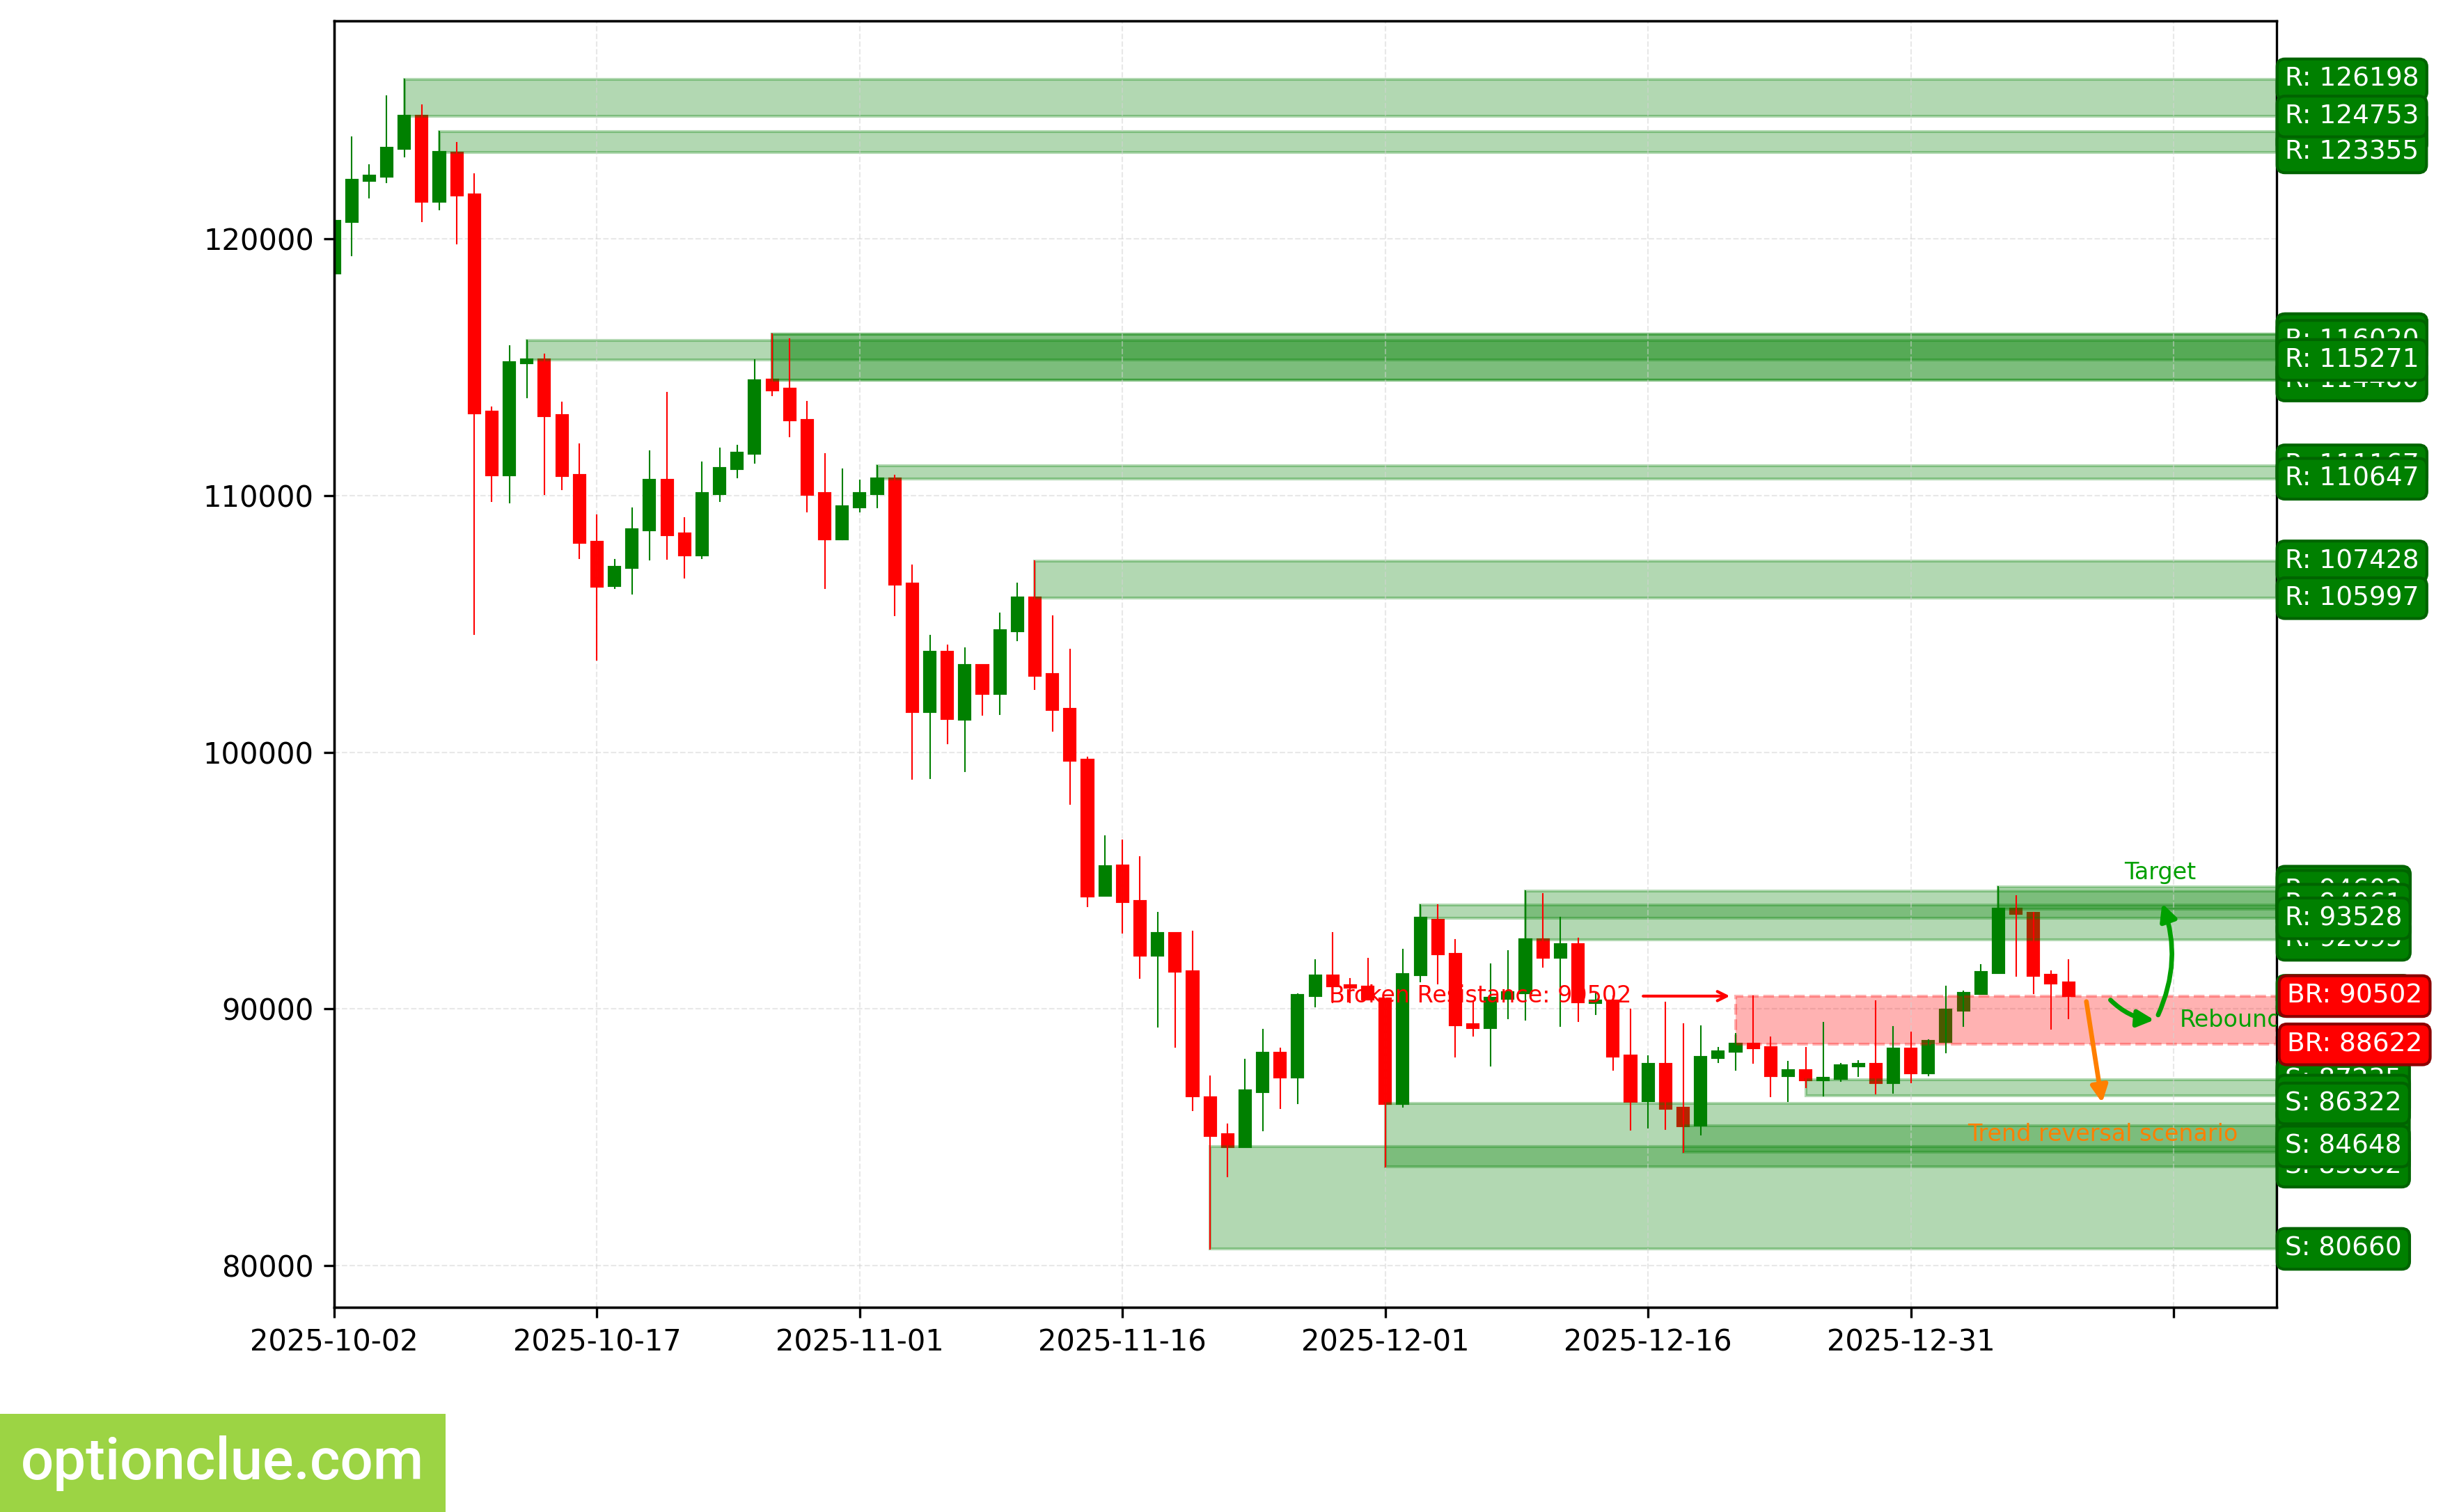
BTC. Technical Analysis. D1.
Ether (ETH)
The bullish trend continues, a corrective wave is developing. An entry point for buying on rebound may form after the completion of the current correction. The last broken level is resistance (3006 — 3073). The breakout occurred 8 candlesticks ago.
The intermediate target for the upward movement is the resistance level with boundaries 3296 — 3304. In case of successful trend development, a further target will be at the resistance level with boundaries 3583 — 3656.
The potential profit/risk ratio from current prices when setting targets and fixing risks based on daily timeframe levels may be small (approximately 0.7:1). When using a further target — approximately 1.7:1. If the correction ends near the support level (2891 — 2904), the potential profit/risk ratio may be around 3.9:1. When using a further target — around 6.7:1. If the correction ends near the last broken level (3006 — 3073), the potential profit/risk ratio is around 1:1. When selecting a further target — approximately 2.2:1.
Long positions will remain relevant, as long as the market remains above the nearest support level with boundaries 2891 — 2904. If the market successfully settles below this support, the trend will change to the opposite (bearish).
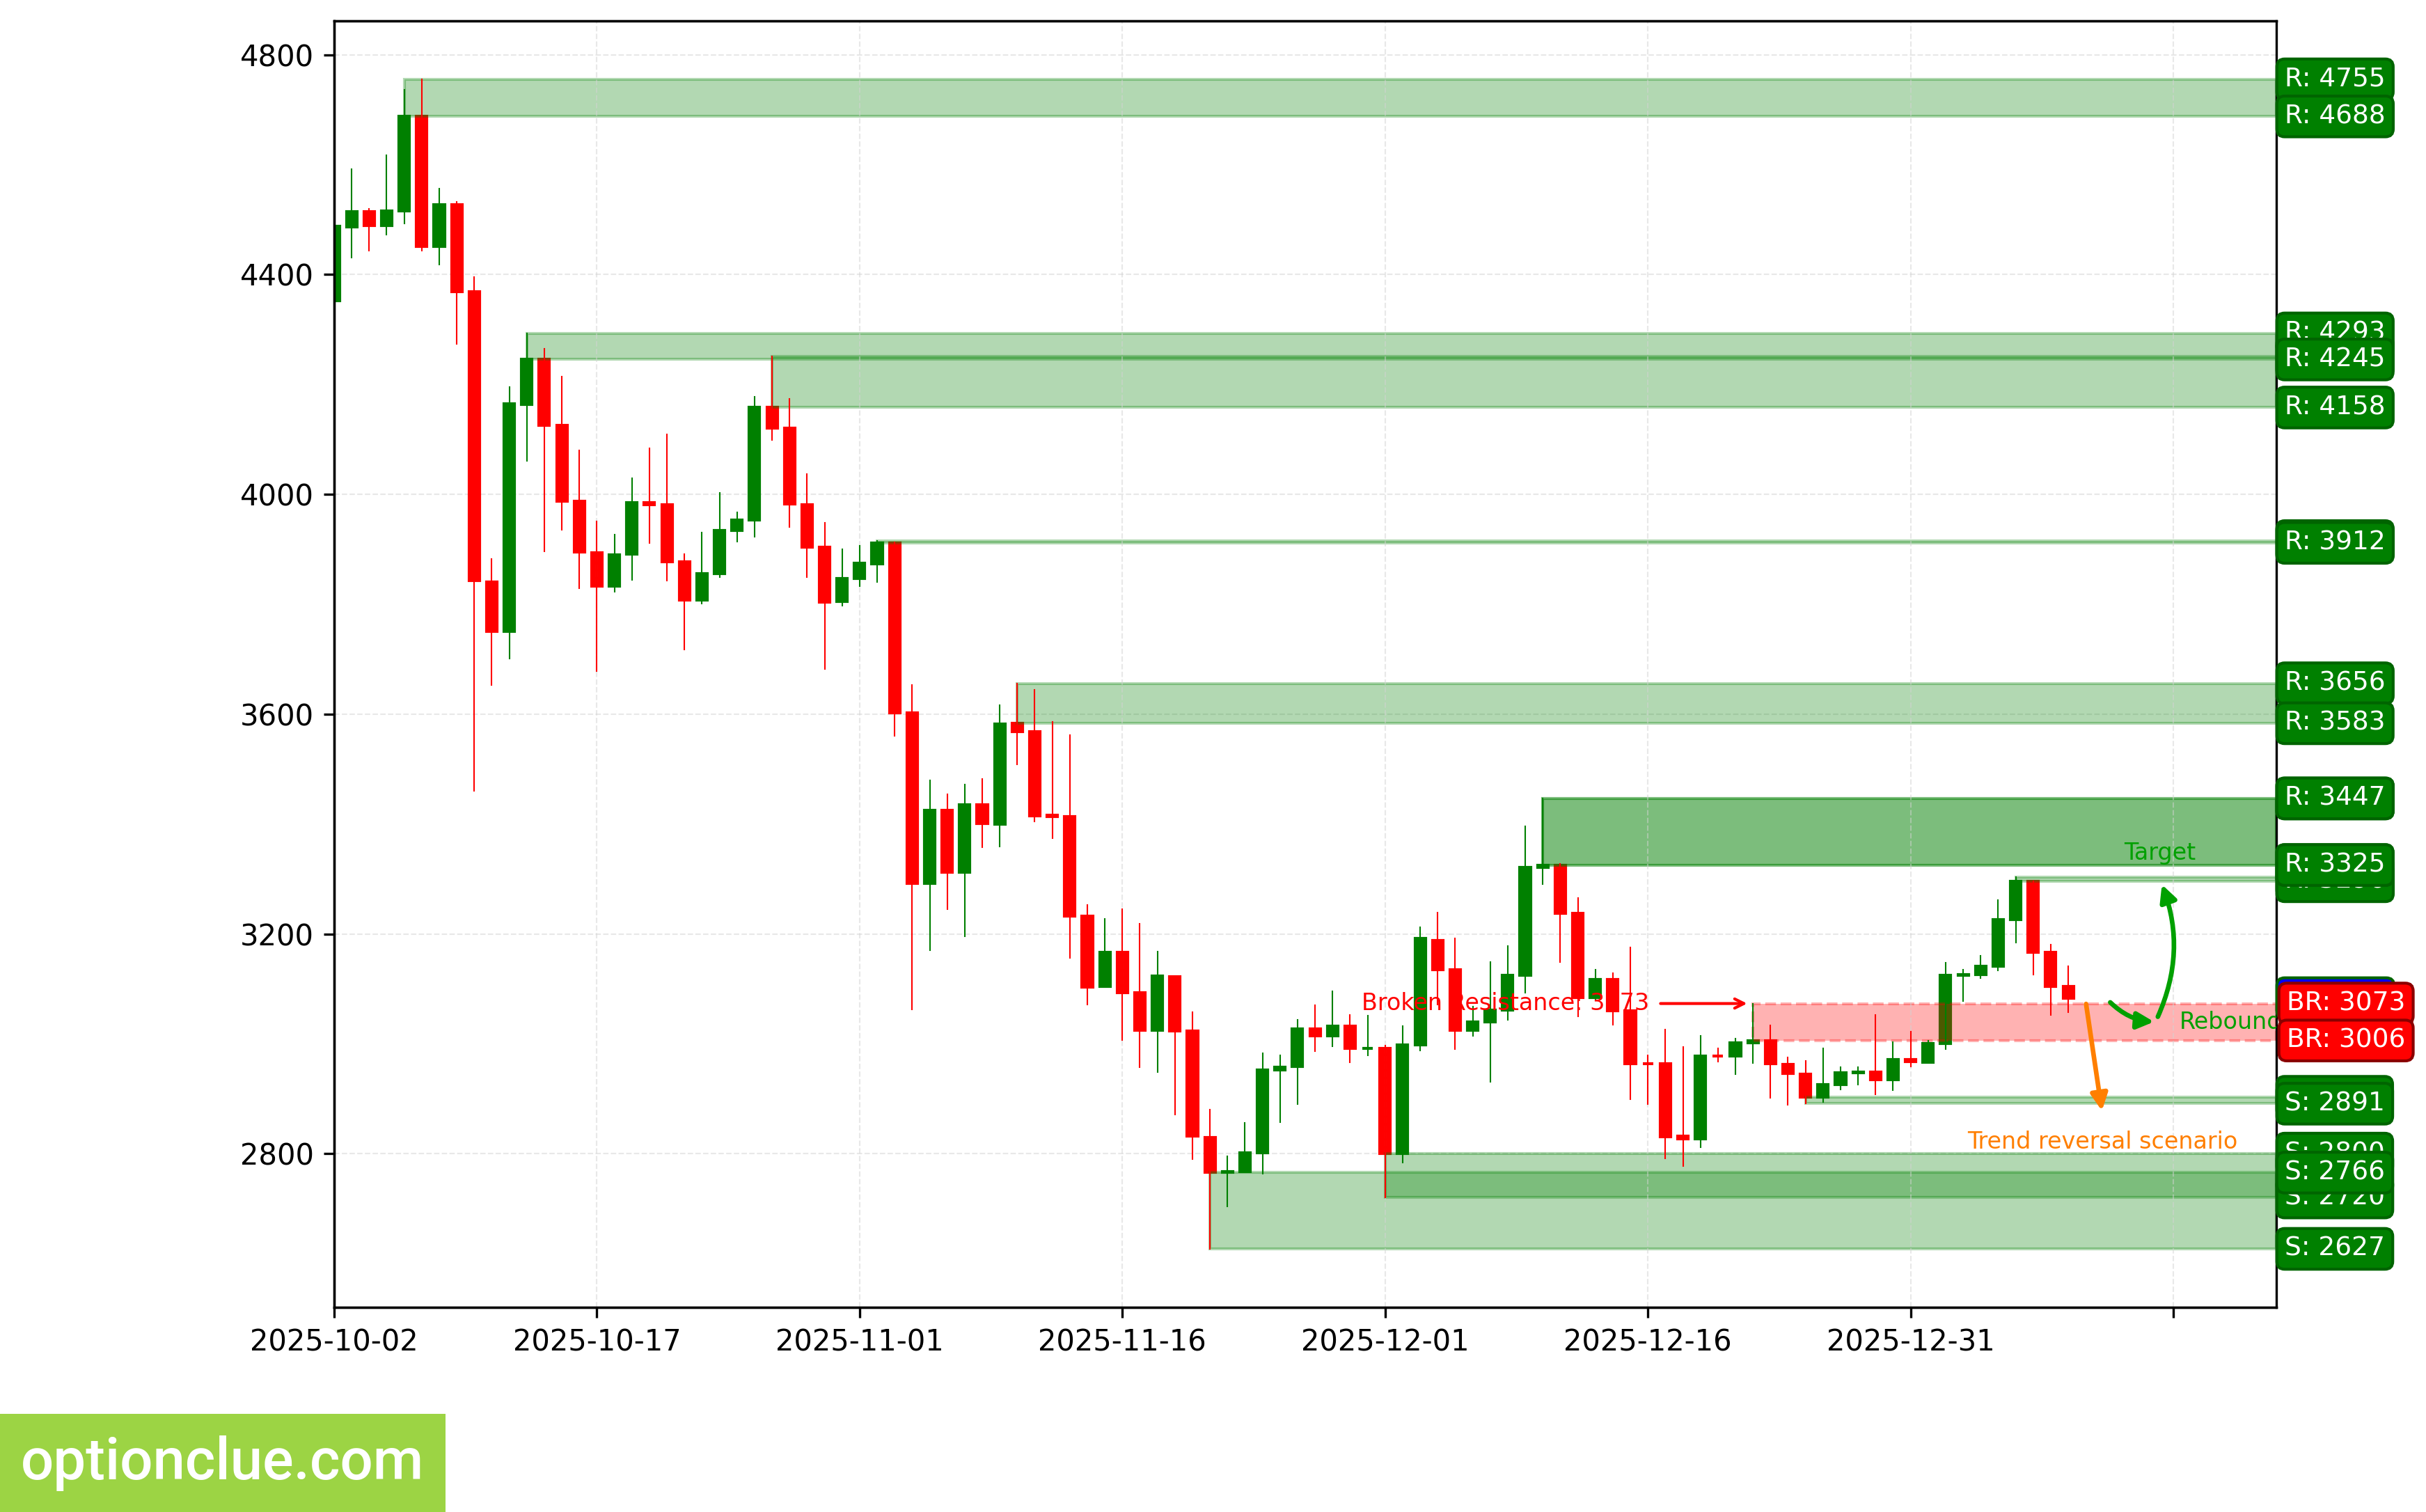
ETH. Technical Analysis. D1.
Apple Inc (AAPL)
The trend changed to bearish, when the support level (269.56 — 270.84) was broken last week. A corrective wave is developing. An entry point for selling on rebound may form after the completion of the current correction.
The intermediate target for the downward movement is the support level with boundaries 255.70 — 257.02. In case of successful trend development, a further target will be at the support level with boundaries 245.13 — 247.45.
The potential profit/risk ratio from current prices when setting targets and fixing risks based on daily timeframe levels may be small (around 0.1:1). When using a further target — also small (approximately 0.5:1). If the next correction ends near the resistance level (273.08 — 277.84), the potential profit/risk ratio may be approximately 2.8:1. For a further target — around 4.3:1. If the next correction ends near the last broken level (269.56 — 270.84), the potential profit/risk ratio may be around 1.1:1. When selecting a further target — approximately 1.9:1.
Short positions will remain relevant, as long as the market remains below the nearest resistance level with boundaries 273.08 — 277.84. If the market successfully settles above this nearest resistance, the trend will change to the opposite (bullish).
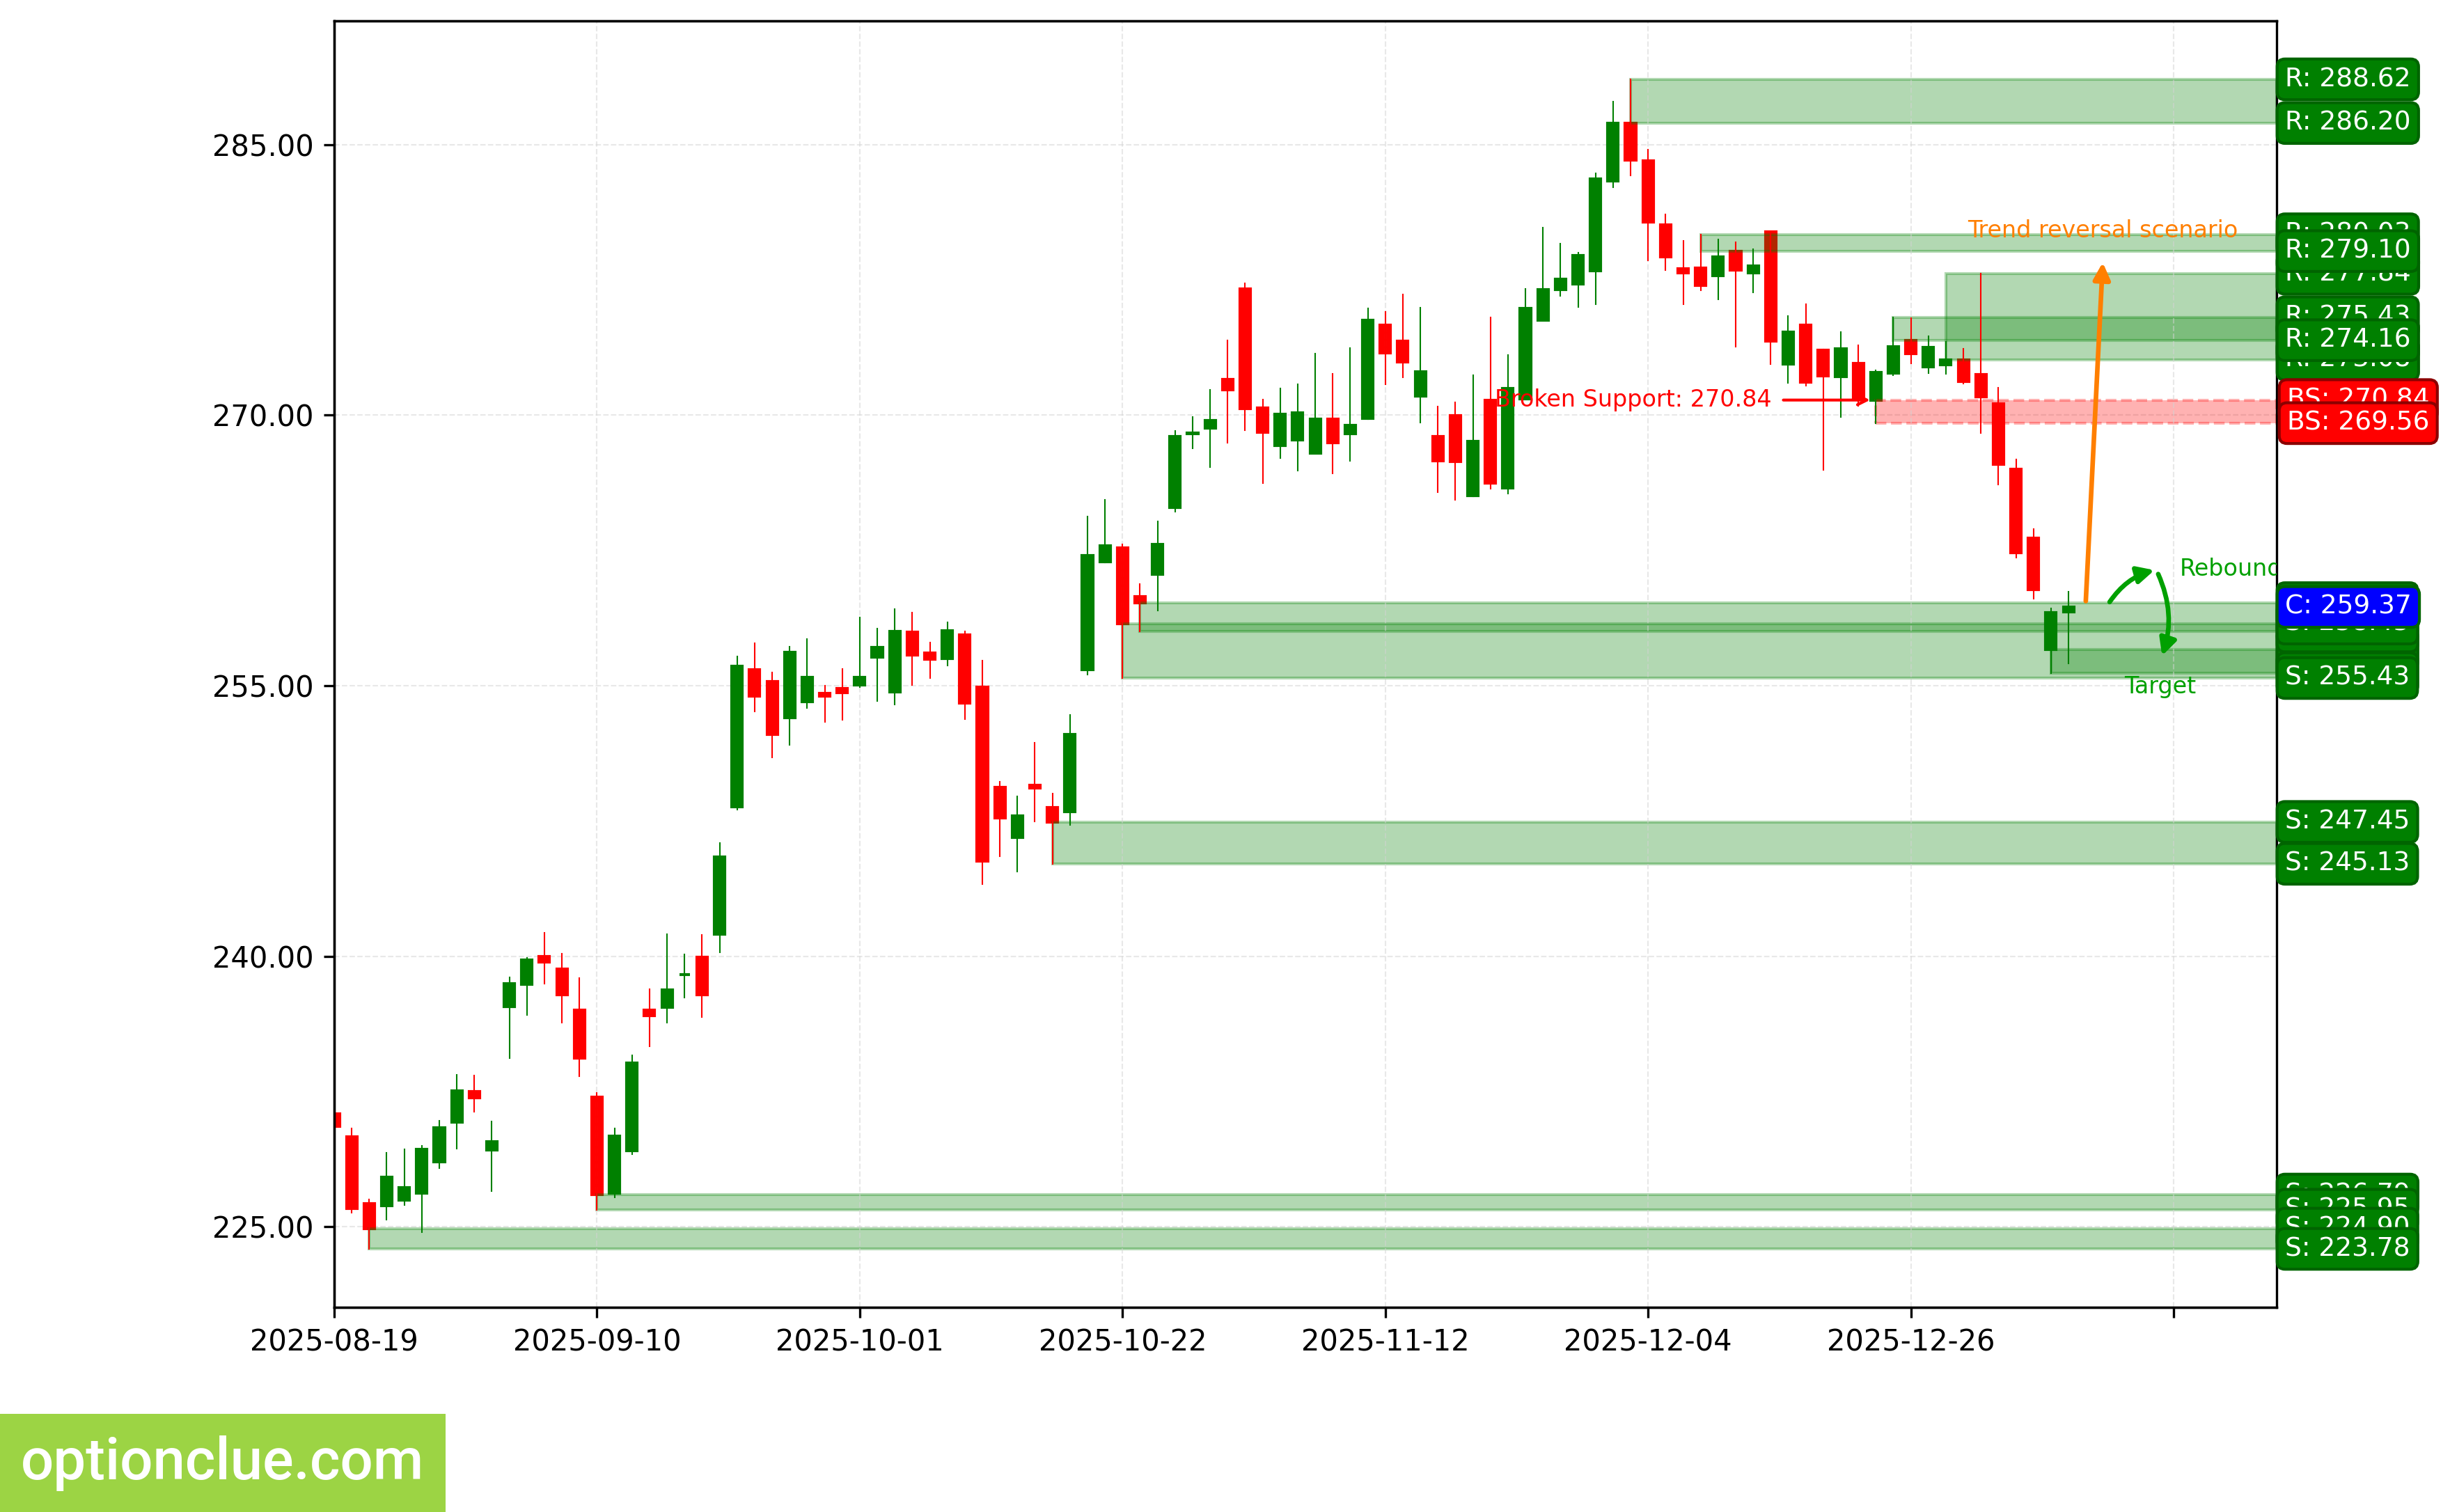
AAPL. Technical Analysis. D1.
NVIDIA Corp (NVDA)
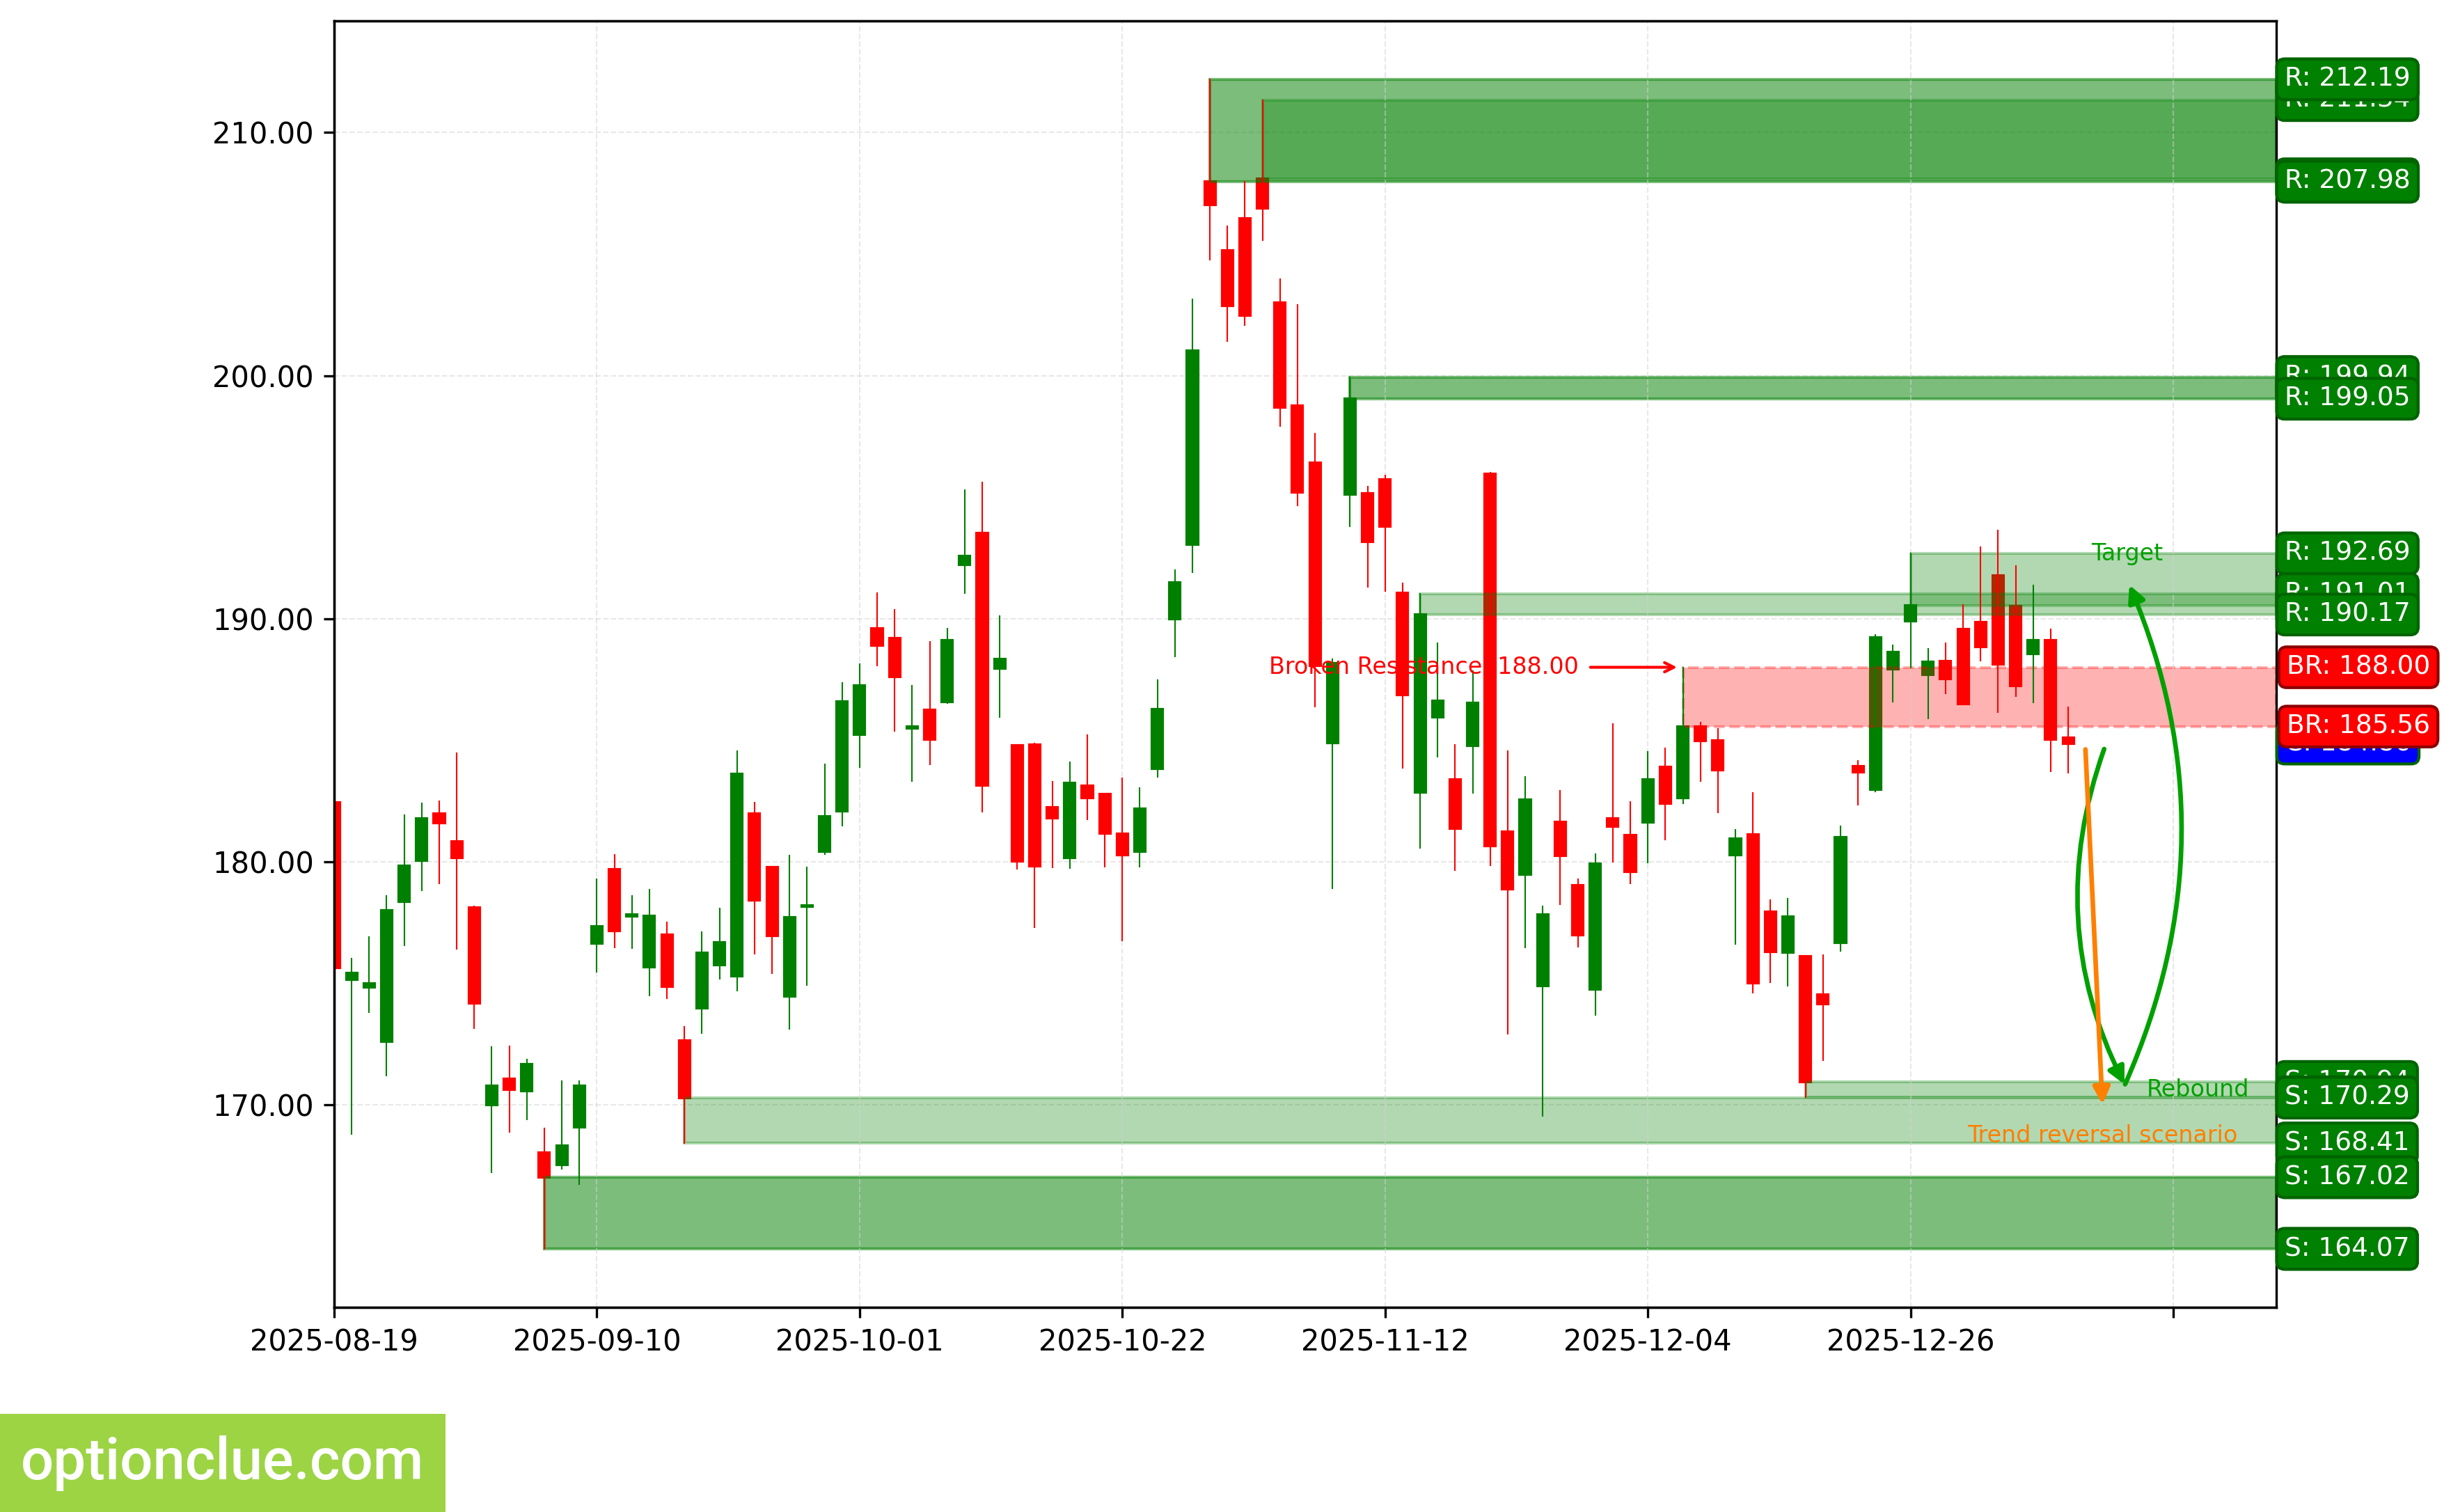
The bullish trend continues, a corrective wave is developing. An entry point for buying on rebound may form after the completion of the current correction. The last broken level is resistance (185.56 — 188.00). The breakout occurred 12 candlesticks ago.
The intermediate target for the upward movement is the resistance level with boundaries 190.53 — 192.69. In case of successful trend development, a further target will be at the resistance level with boundaries 199.05 — 199.94.
If the correction ends near the support level (170.31 — 170.94), the potential profit/risk ratio may be more than 3:1. For a further target — more than 5:1. If the correction ends near the last broken level (185.56 — 188.00), the potential profit/risk ratio may be small (around 0.2:1). When using a further target — also small (approximately 0.6:1).
Long positions will remain relevant, as long as the market remains above the nearest support level with boundaries 170.31 — 170.94. If the market successfully settles below this support, the trend will change to the opposite (bearish).
NVDA. Technical Analysis. D1.
Tesla Inc (TSLA)
The bearish trend continues, a corrective wave is developing. An entry point for selling on rebound may form after the completion of the current correction. The last broken level is support (465.83 — 467.26). The breakout occurred 9 candlesticks ago.
The intermediate target for the downward movement is the support level with boundaries 424.37 — 427.89. In case of successful trend development, a further target will be at the support level with boundaries 383.76 — 391.09.
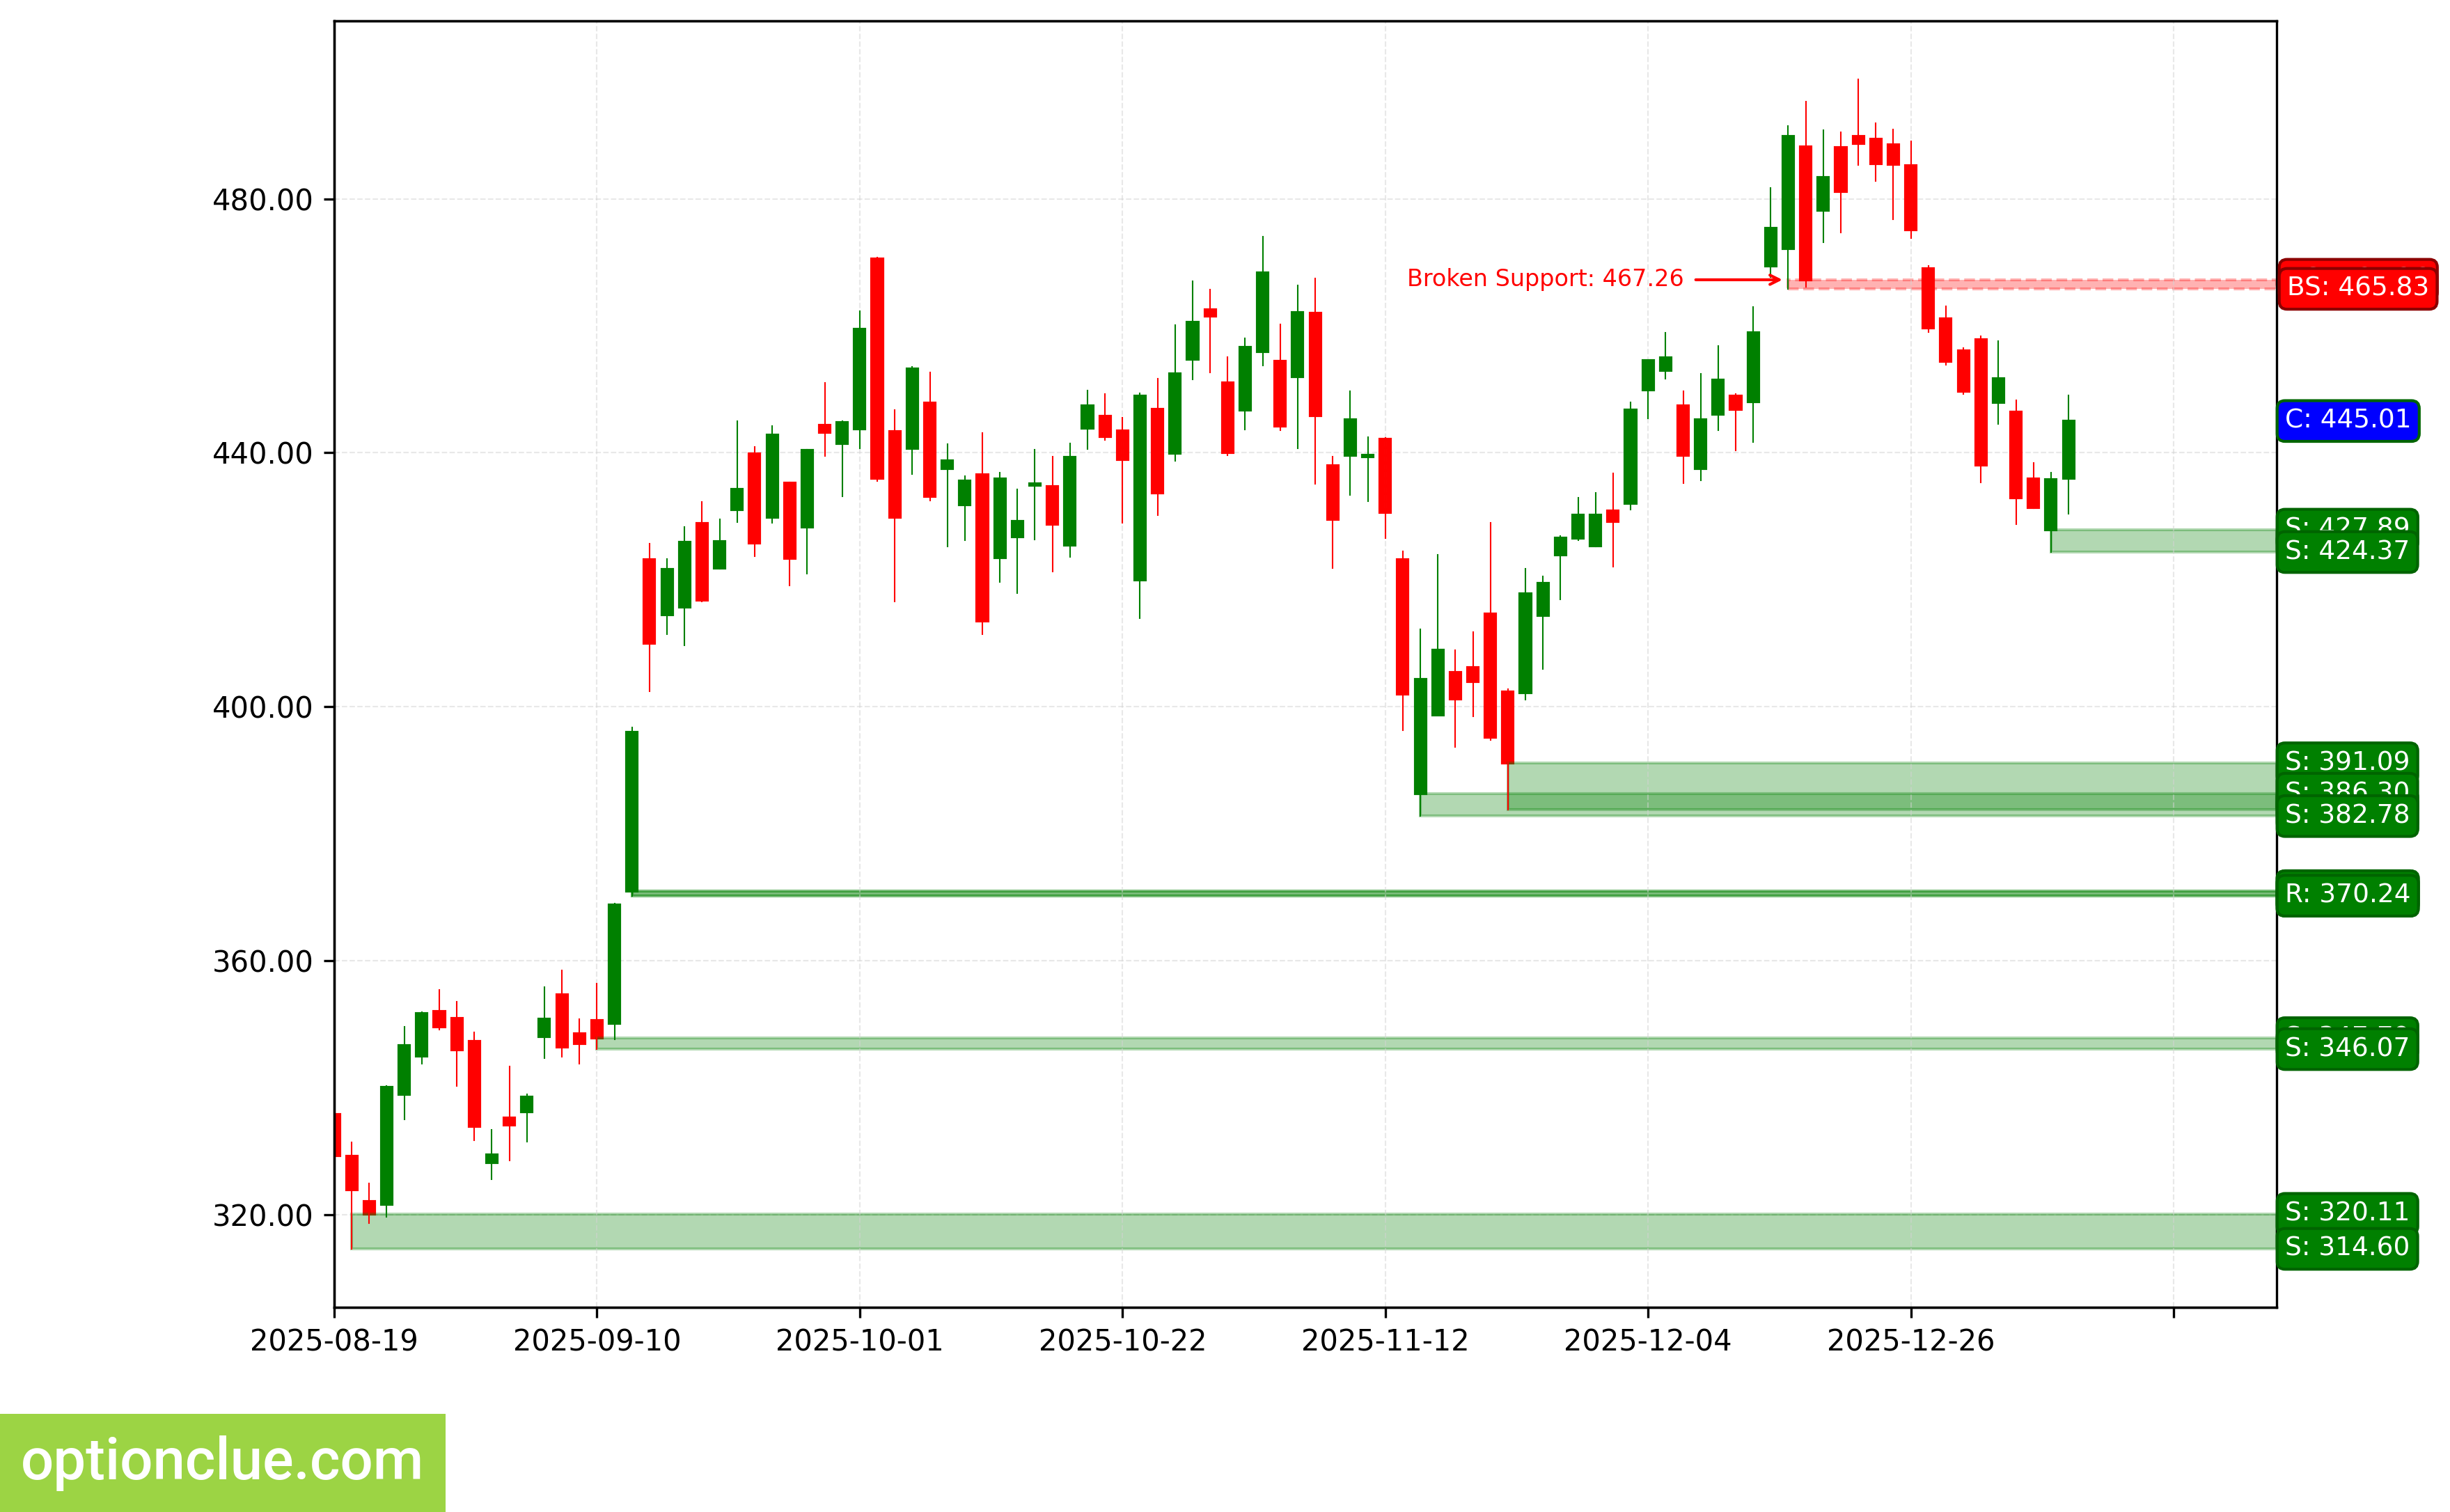
TSLA. Technical Analysis. D1.
Summary
From the perspective of medium-term trading, financial instruments with a correction close to completion on Daily and/or potentially the most promising profit-to-risk ratios include: GBPUSD, AUDUSD, BTC, ETH. In the near future, they may deserve attention depending on the depth of the market correction: EURUSD, USDJPY, TSLA.
The remaining financial instruments on the trading list may also be of interest, but rebound signals on Daily will likely appear no earlier than in a week.