
No-fluff technical analysis. Key zones, actionable scenarios, and specific price targets.
Key Topics
- Euro (EURUSD)
- British Pound (GBPUSD)
- Swiss Franc (USDCHF)
- Japanese Yen (USDJPY)
- Canadian Dollar (USDCAD)
- Australian Dollar (AUDUSD)
- New Zealand Dollar (NZDUSD)
- Bitcoin (BTC)
- Ether (ETH)
- Apple Inc (AAPL)
- NVIDIA Corp (NVDA)
- Tesla Inc (TSLA)
- Summary
Euro (EURUSD)
The bearish trend continues, a corrective wave is developing. A short entry on a rebound may form after the correction is complete.
The last broken level was support (1.1540 — 1.1568). The breakout occurred 7 candlesticks ago.
The intermediate target for the downward move is the support level with boundaries at 1.1468 — 1.1482. If the trend develops successfully, a more distant target will be at the support level with boundaries at 1.1389 — 1.1404.
If the correction ends near the last broken level (1.1540 — 1.1568), the potential reward/risk ratio could be small (0.7:1). If there is a correction to the resistance level (1.1650 — 1.1668), the potential reward/risk ratio could be approximately 2:1.
Short positions will remain relevant as long as the market stays below the nearest resistance level with boundaries at 1.1650 — 1.1668.
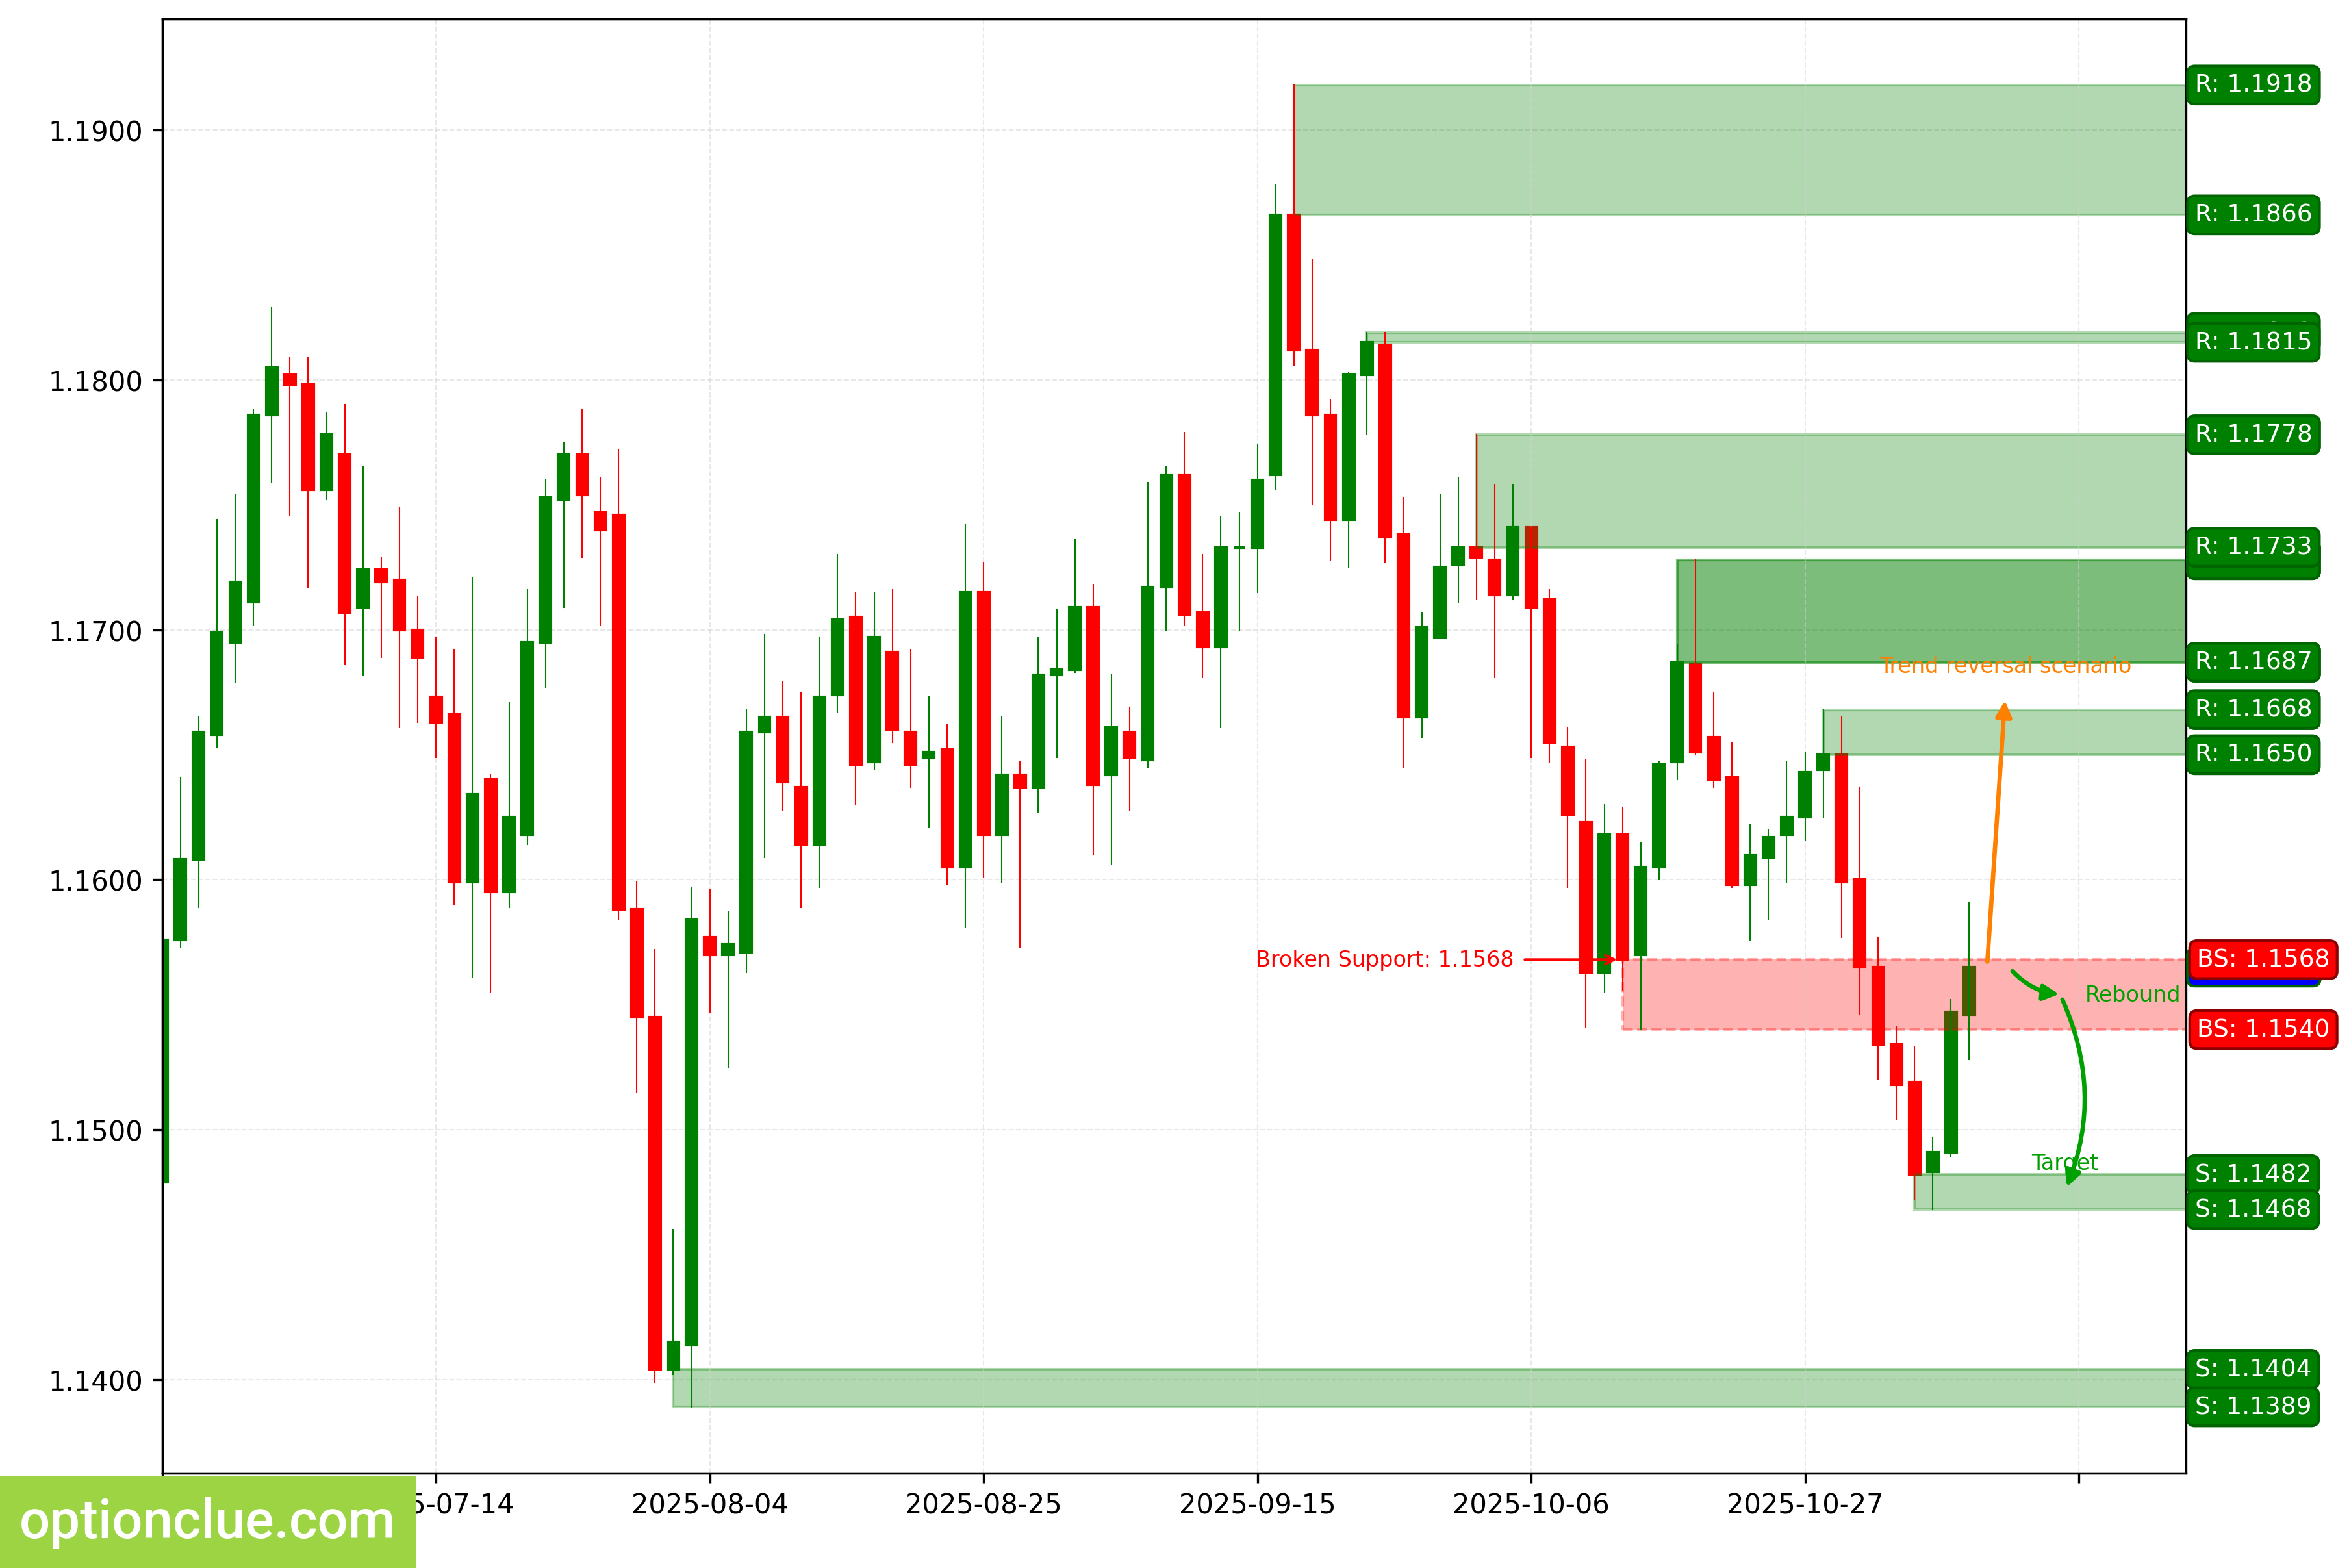
EURUSD. Technical analysis. D1.
British Pound (GBPUSD)
The trend is bearish, a corrective wave is developing. The last broken level was support (1.3094 — 1.3138). The breakout occurred 4 candlesticks ago.
A short entry on a rebound may form after the correction on the daily timeframe is complete.
The intermediate target for the downward move is the support level with boundaries at 1.3007 — 1.3018. If the trend develops successfully, a more distant target will be at the support level with boundaries at 1.2708 — 1.2720.
Short positions will remain relevant as long as the market stays below the nearest resistance level with boundaries at 1.3436 — 1.3471.
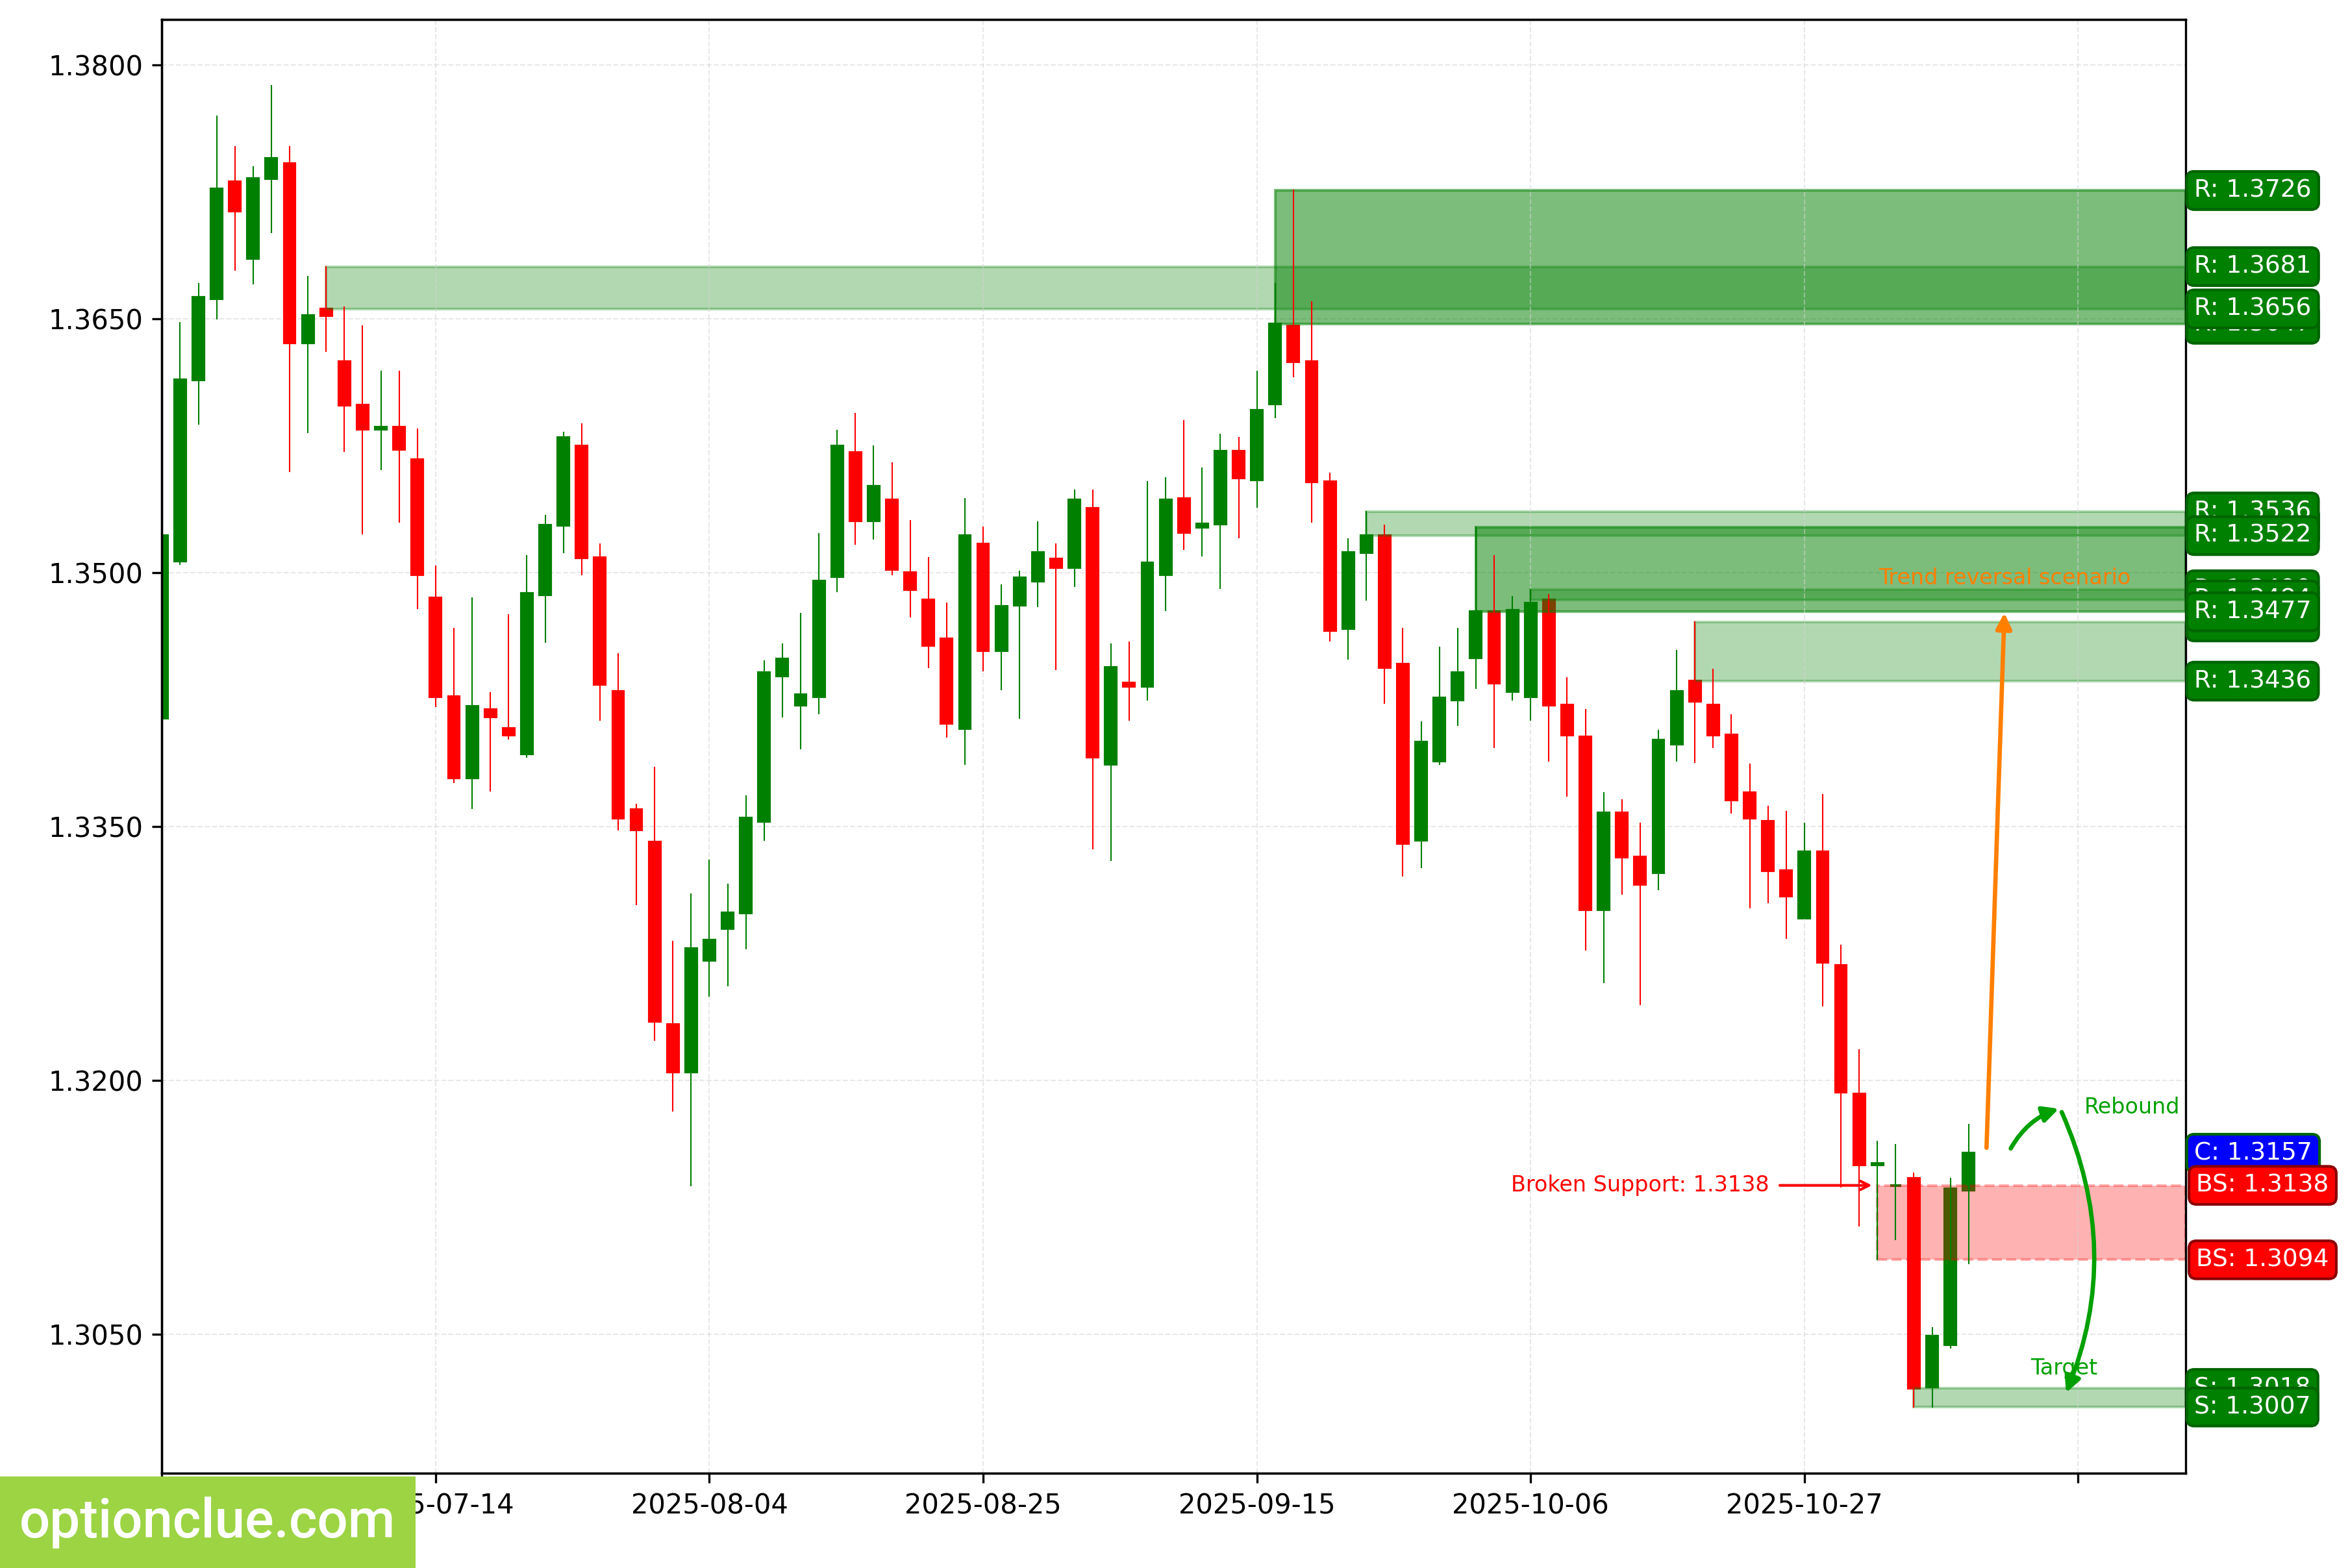
GBPUSD. Technical analysis. D1.
Swiss Franc (USDCHF)
The bullish trend continues, a corrective wave is developing. The last broken level was resistance (0.7961 — 0.7986). The breakout occurred 8 candlesticks ago.
A long entry on a rebound may form after the current correction is complete.
The intermediate target for the upward move is the resistance level with boundaries at 0.8105 — 0.8124. If the market successfully consolidates above this resistance, it will open the way for the price to move towards target #2 — the resistance level with boundaries at 0.8124 — 0.8131.
If the correction ends near the last broken level (0.7961 — 0.7986), the potential reward/risk ratio could be small (slightly more than 1:1).
Long positions will remain relevant as long as the market stays above the nearest daily support level with boundaries at 0.7923 — 0.7931.
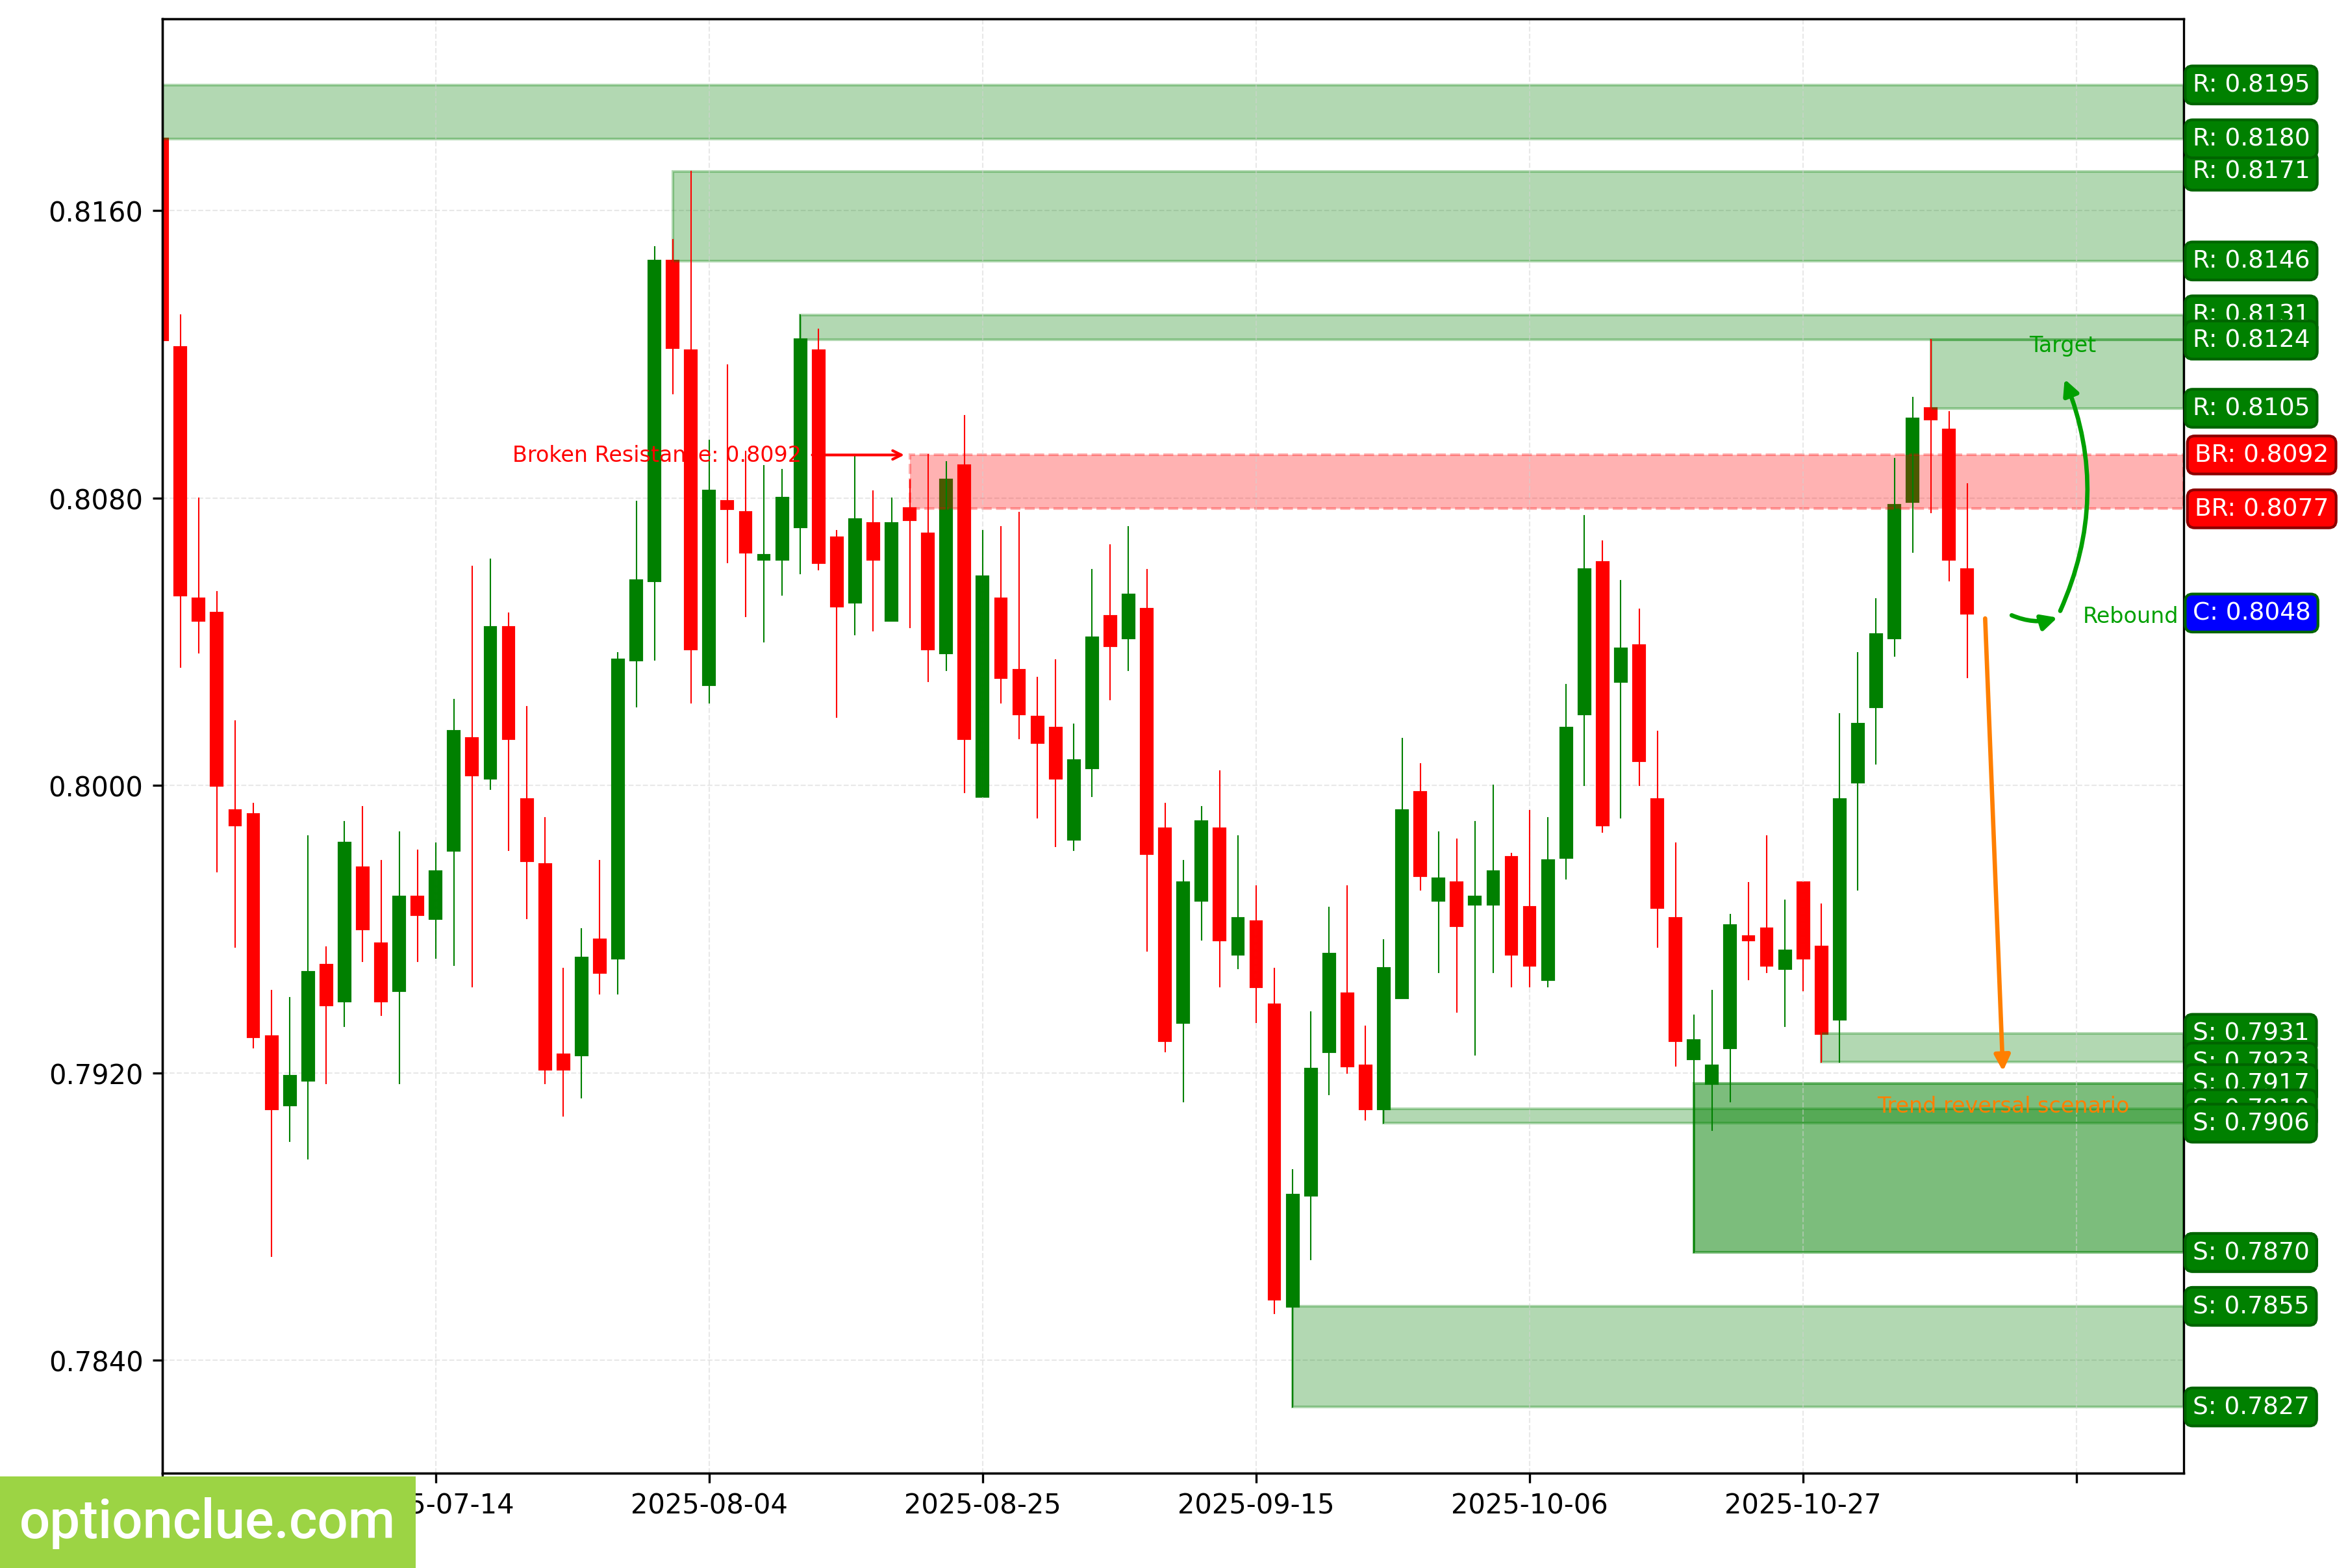
USDCHF. Technical analysis. D1.
Japanese Yen (USDJPY)
The bullish trend continues; on the last closed candlestick, the correction likely ended and a long entry on a rebound formed. An impulse wave is now developing.
The last broken level was resistance (153.02 — 153.25). The breakout occurred 7 candlesticks ago.
The intermediate target for the upward move is the resistance level with boundaries at 154.21 — 154.48. If the market successfully consolidates above this resistance, it will open the way for the price to move towards target #2 — the resistance level with boundaries at 154.41 — 154.80.
The potential reward/risk ratio from current prices, when setting targets and managing risk based on daily levels, could be 0.4:1. With a more distant target, it could be 0.7:1.
Long positions will remain relevant as long as the market stays above the nearest daily support level with boundaries at 151.53 — 152.10. If the market successfully consolidates below the nearest support (151.53 — 152.10), the trend will reverse to bearish.
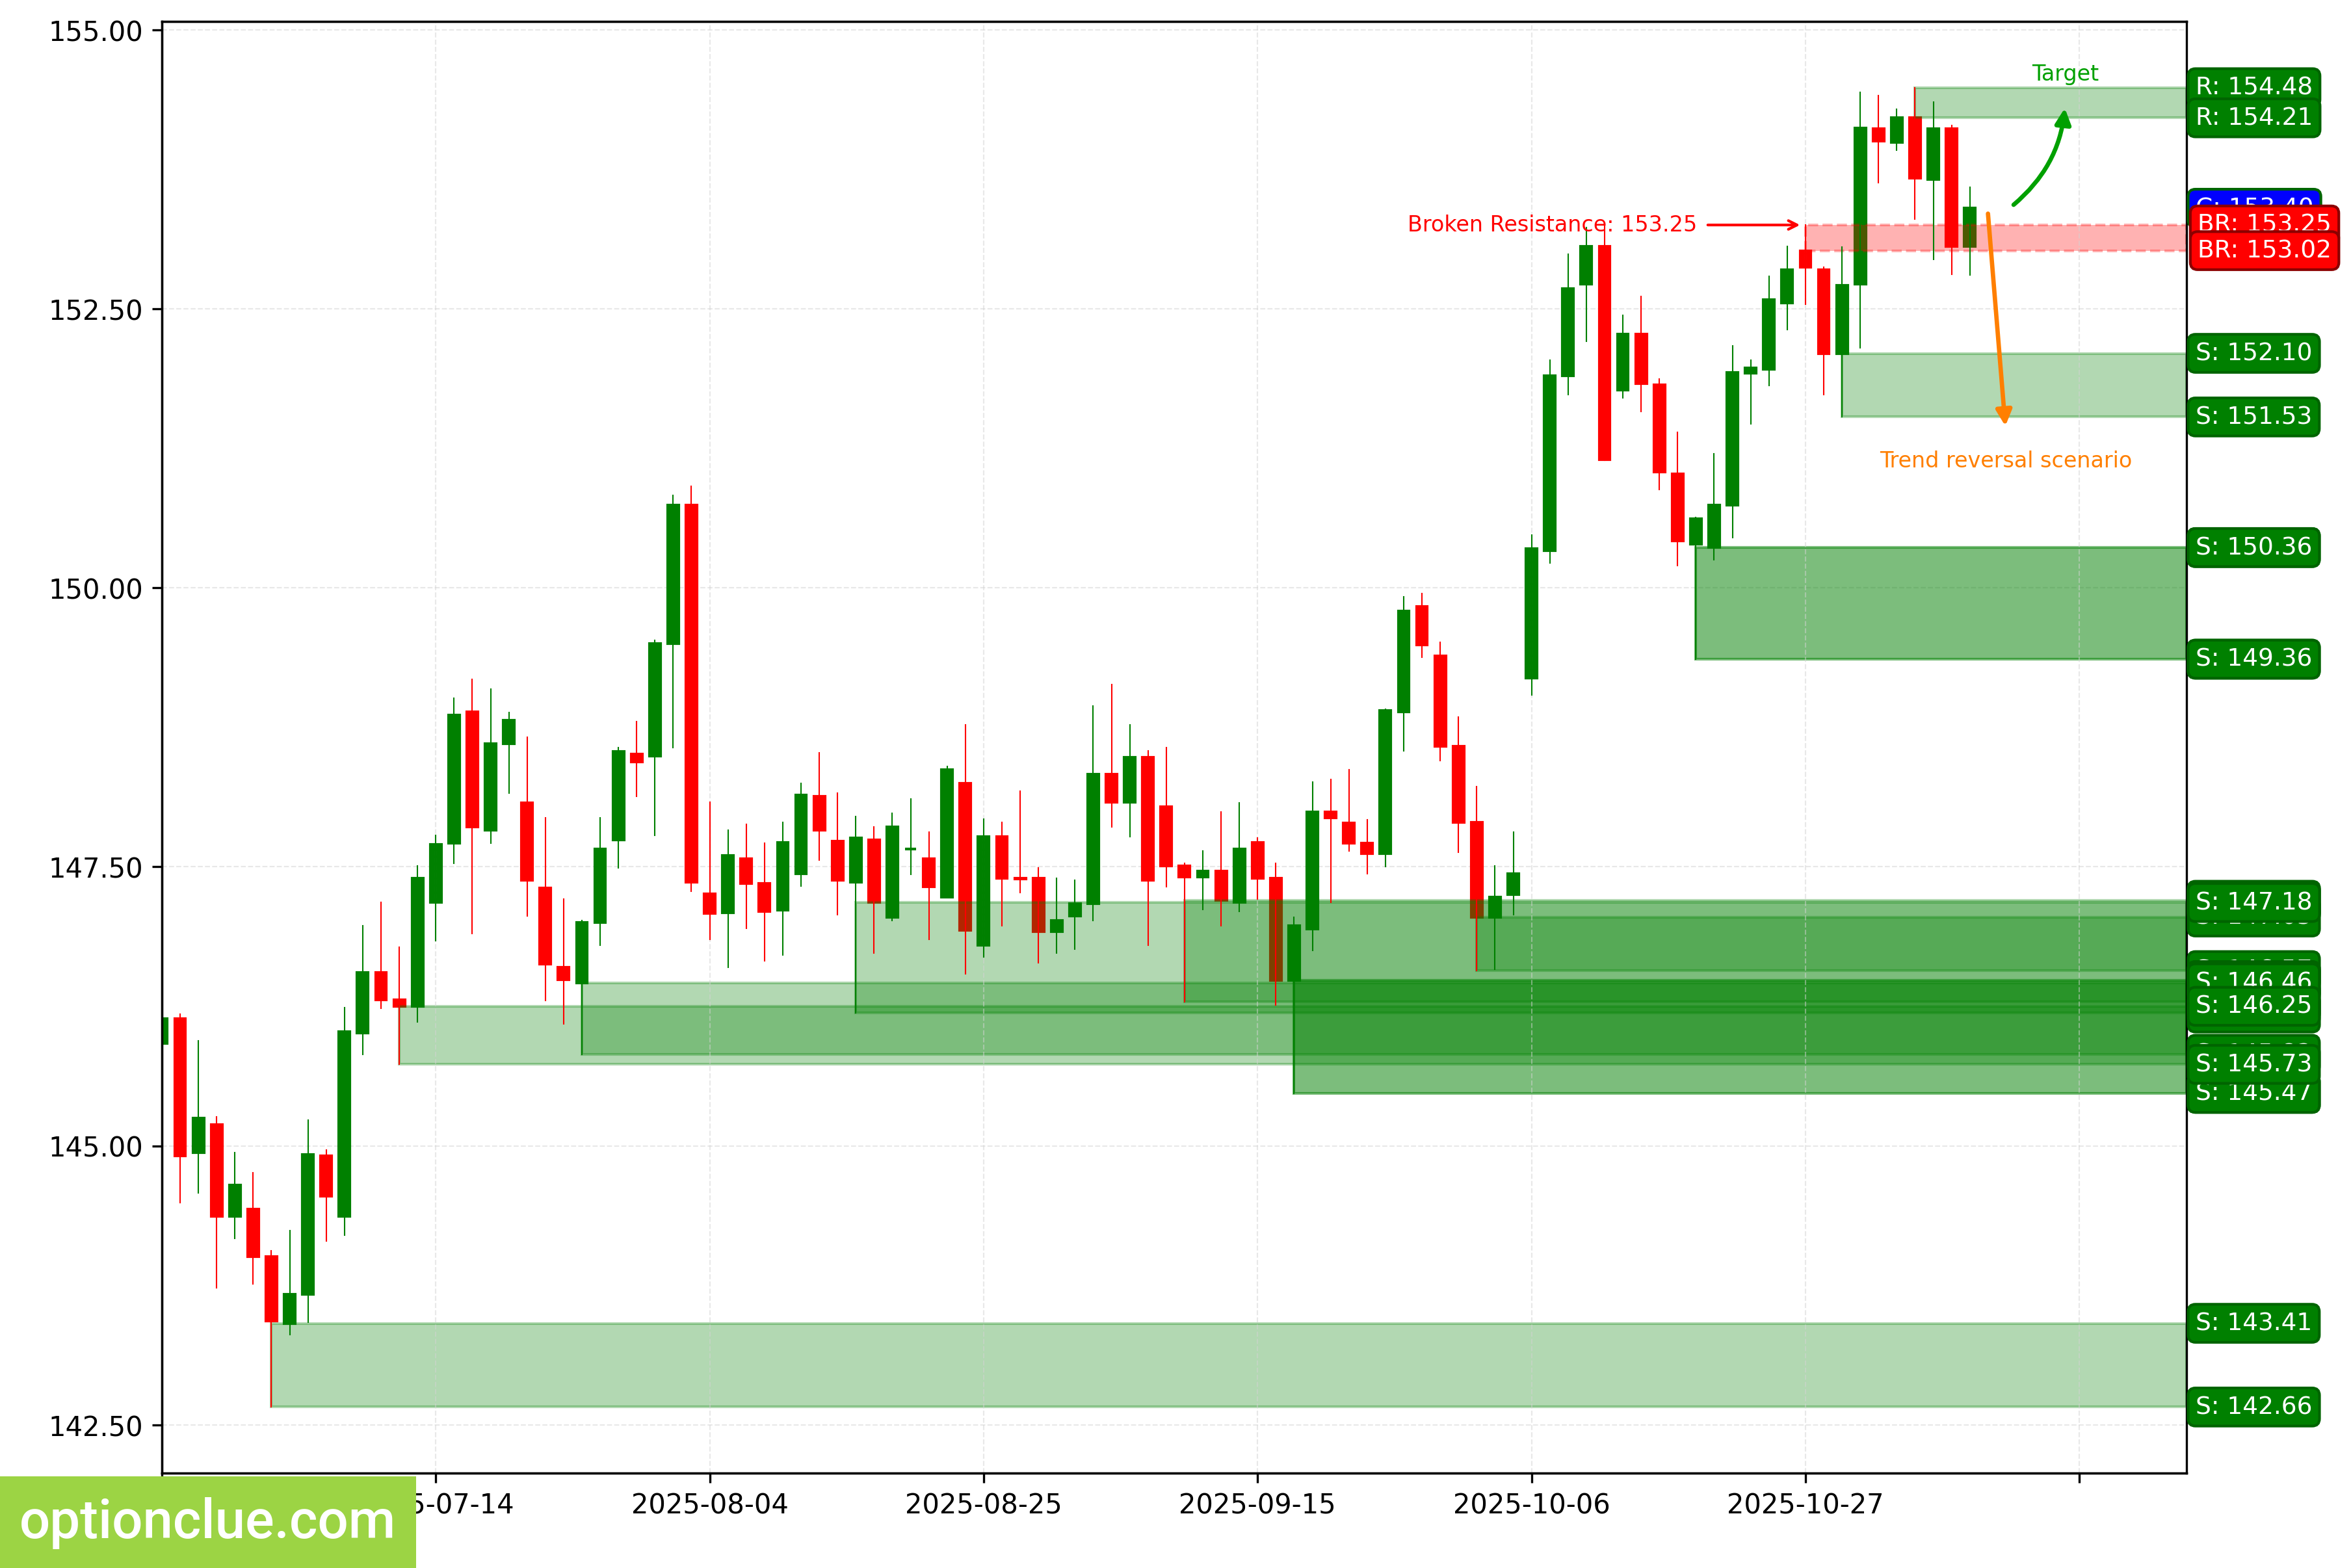
USDJPY. Technical analysis. D1.
Canadian Dollar (USDCAD)
The bullish trend continues, a corrective wave is developing. The last broken level was resistance (1.4036 — 1.4065). The breakout occurred 4 candlesticks ago, and the price has returned to this last broken level.
A long entry on a rebound may form after the current correction is complete.
The intermediate target for the upward move is the resistance level with boundaries at 1.4385 — 1.4415. If the market successfully consolidates above this resistance, it will open the way for the price to move towards target #2 — the resistance level with boundaries at 1.4440 — 1.4452.
If the correction ends near the support level (1.3885 — 1.3941), the potential reward/risk ratio could be 4:1.
Long positions will remain relevant as long as the market stays above the nearest daily support level with boundaries at 1.3885 — 1.3941.
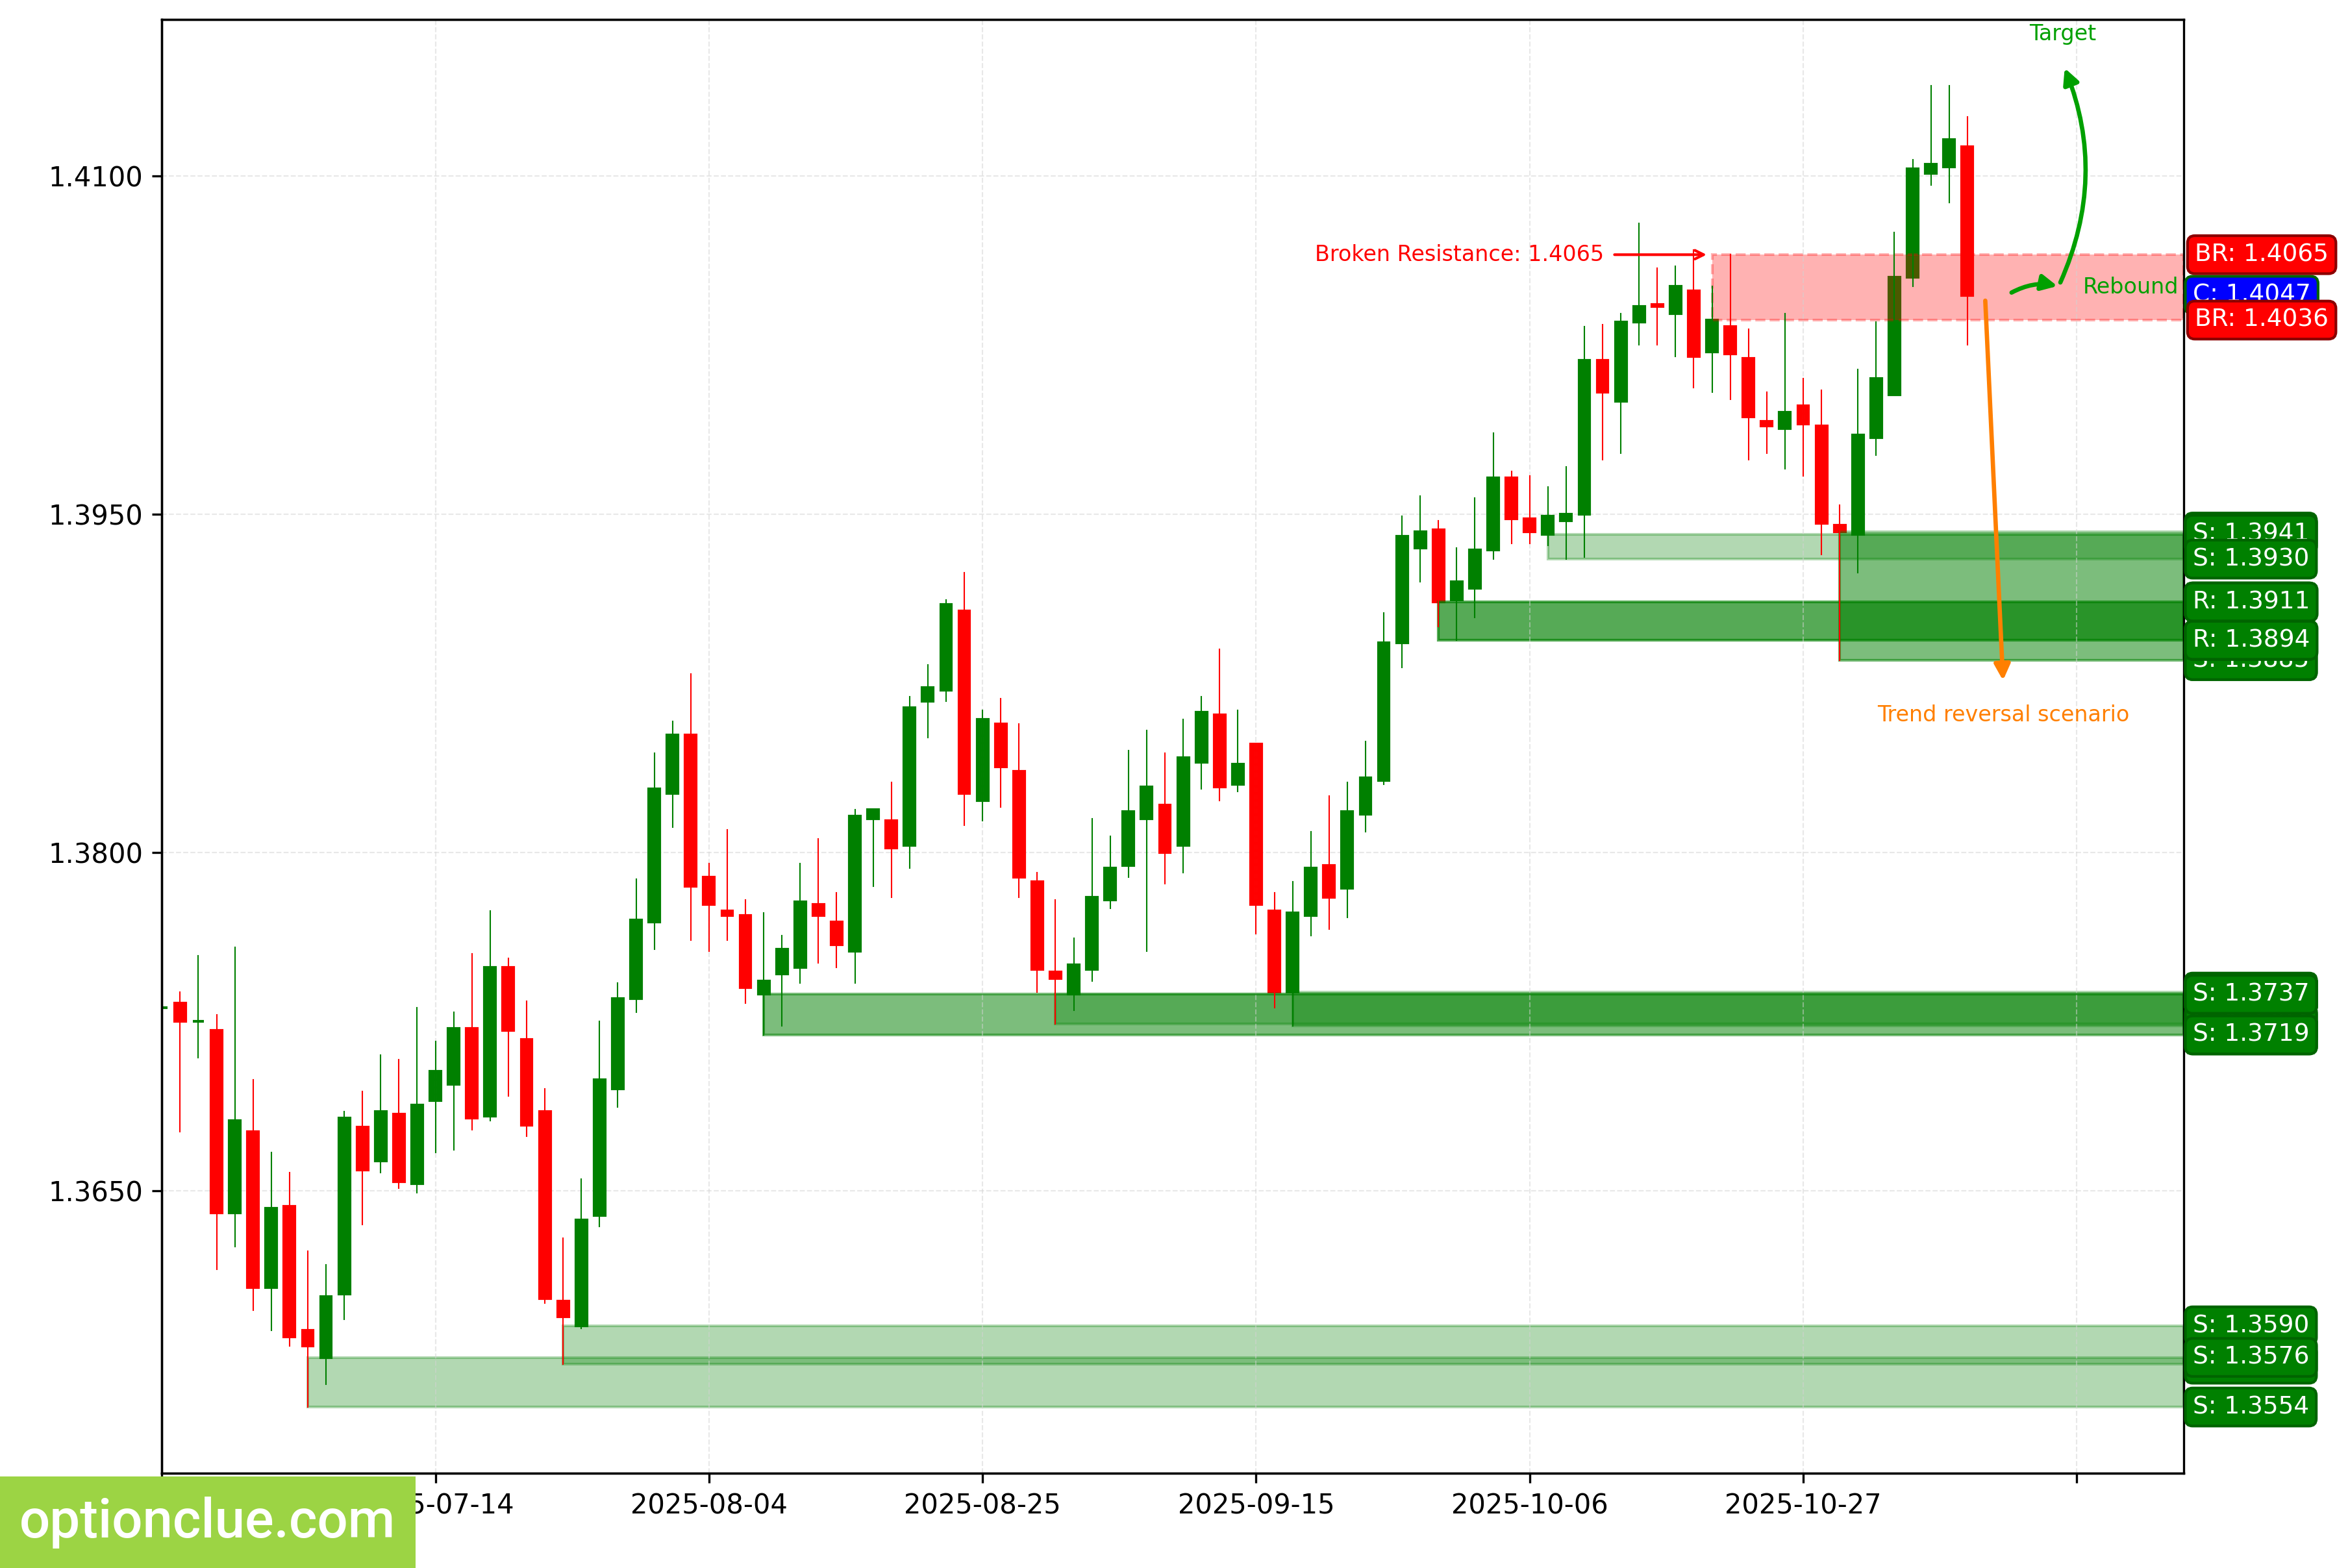
USDCAD. Technical analysis. D1.
Australian Dollar (AUDUSD)
The bullish trend continues; on the last closed candlestick, the correction likely ended and a long entry on a rebound formed; an impulse wave is developing. The intermediate target for the upward move is the resistance level with boundaries at 0.6584 — 0.6617.
The potential reward/risk ratio from current prices, when setting targets and managing risk based on daily levels, could be around 2:1. With a more distant target, it could be 3:1.
If the market successfully consolidates above this resistance, it will open the way for the price to move towards target #2 — the resistance level with boundaries at 0.6598 — 0.6628. Long positions will remain relevant as long as the market stays above the nearest daily support level with boundaries at 0.6471 — 0.6485.
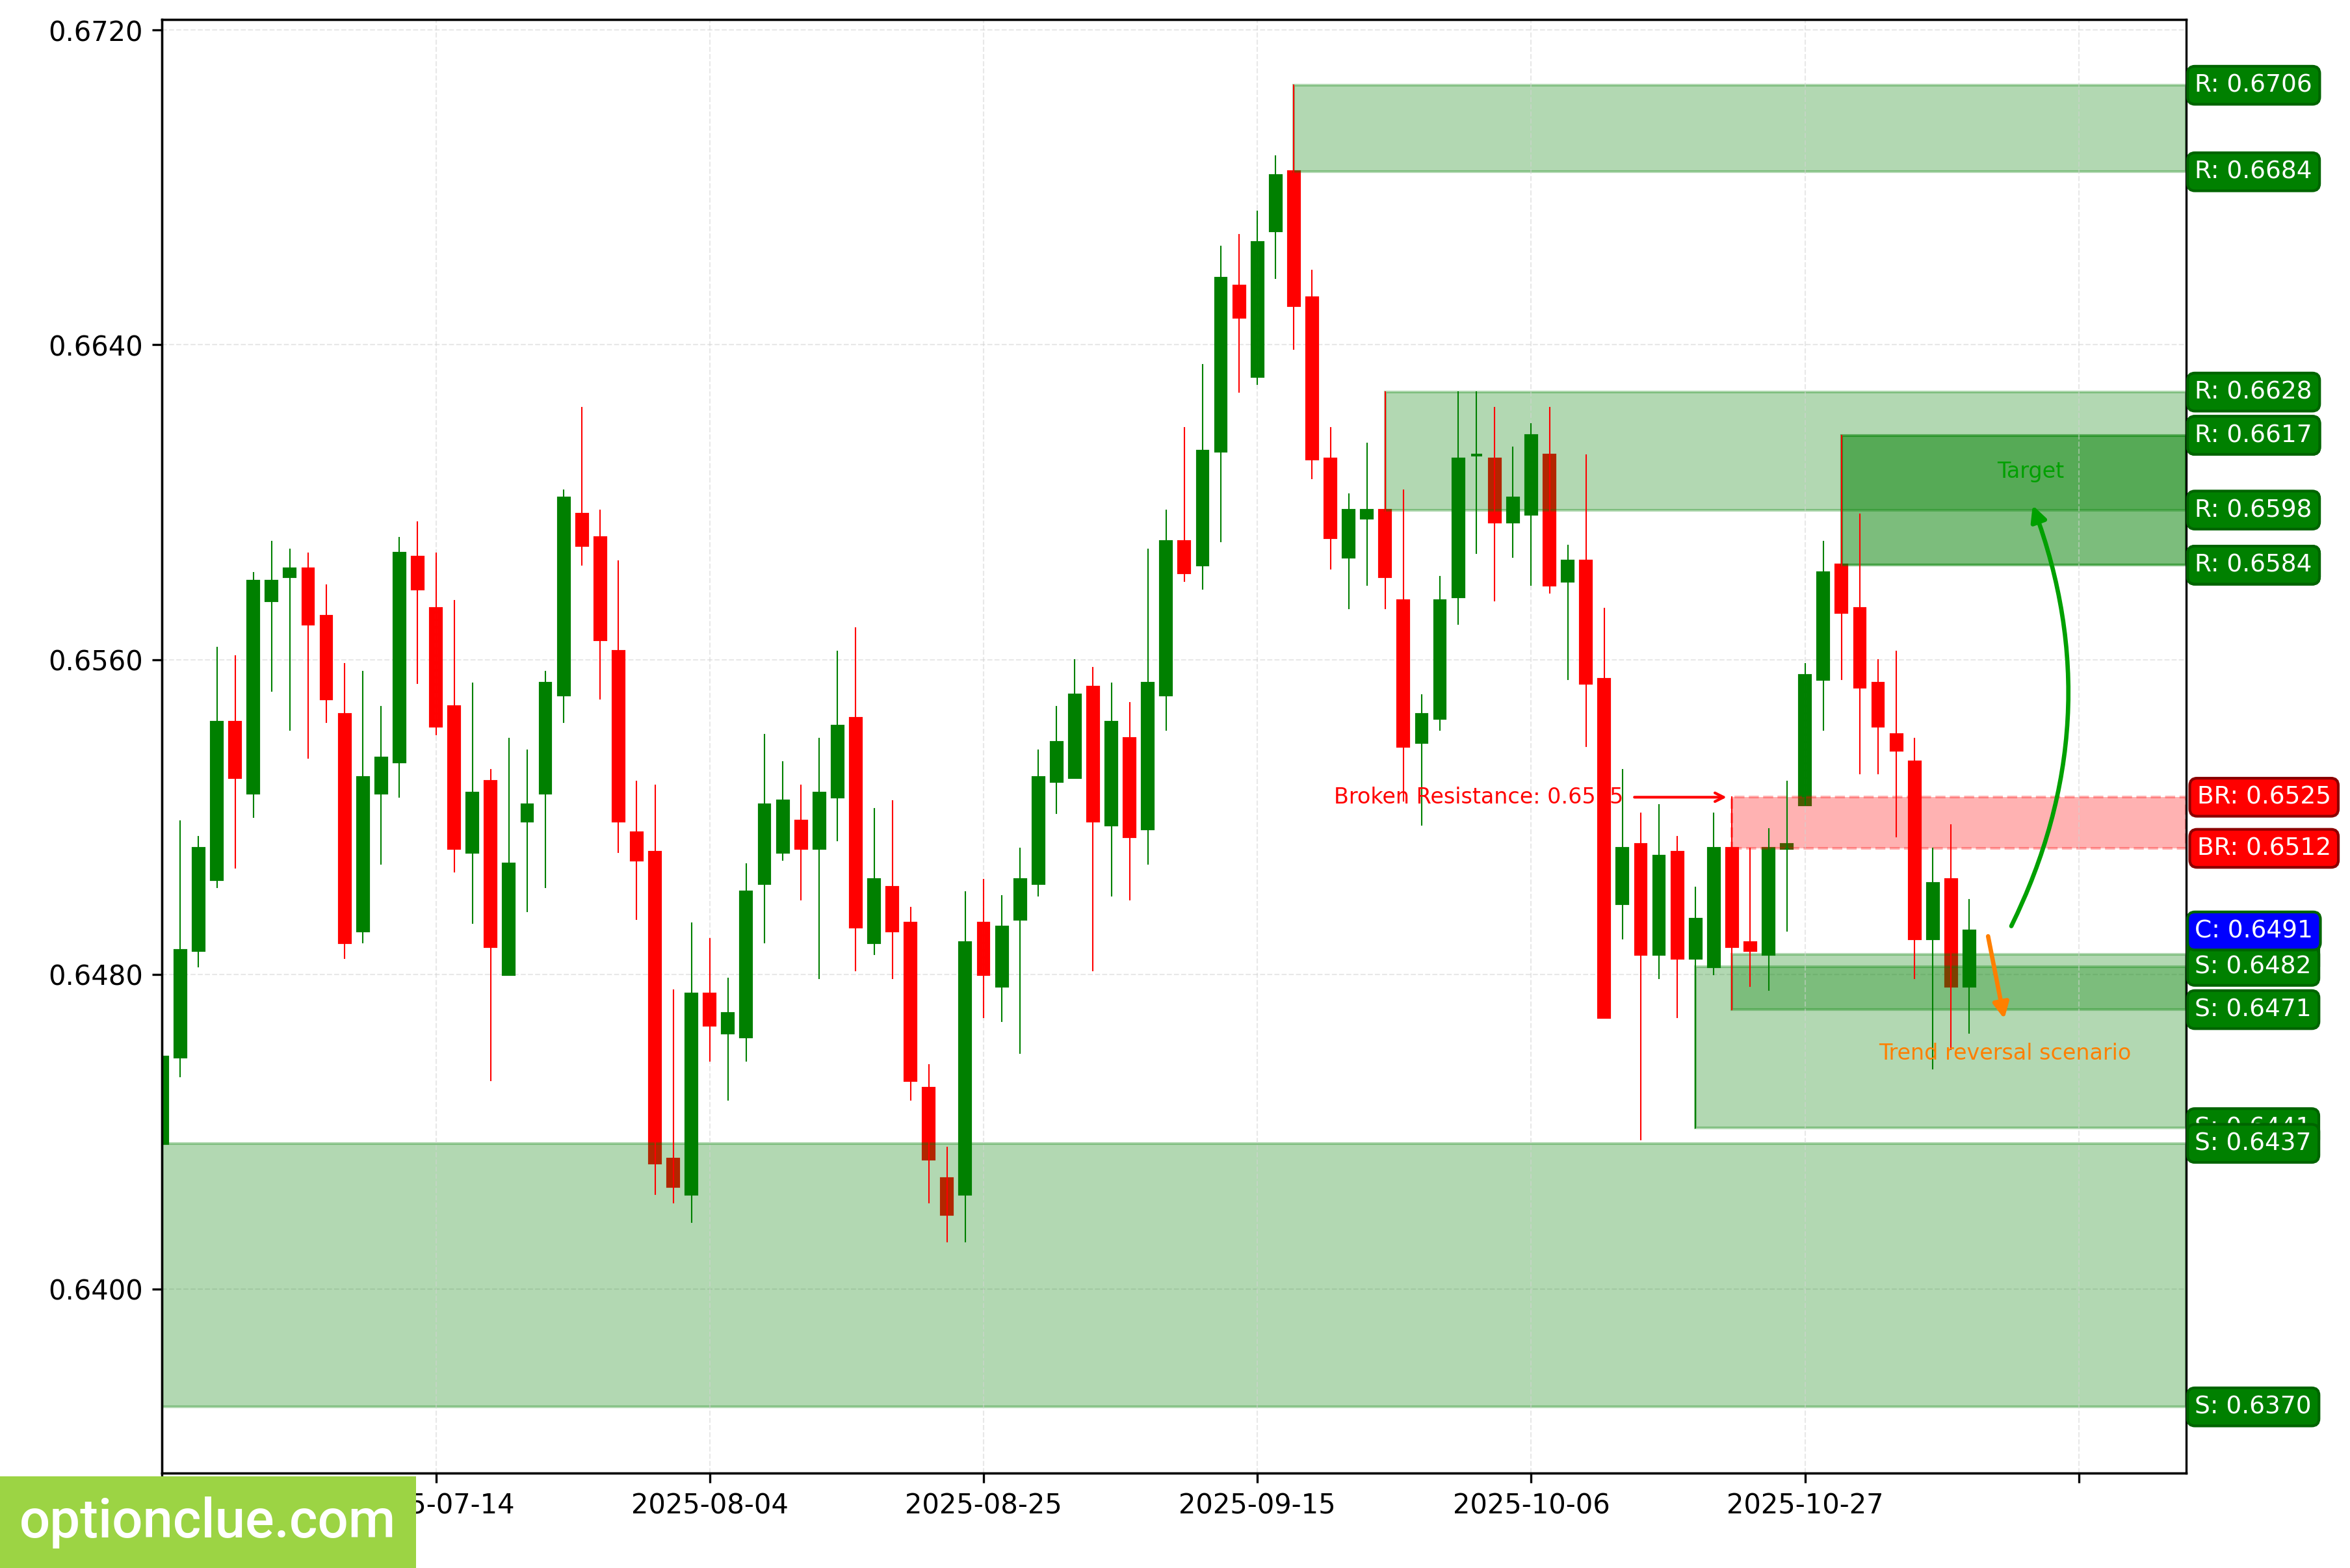
AUDUSD. Technical analysis. D1.
New Zealand Dollar (NZDUSD)
The trend has changed to bearish after the support level (0.5681 — 0.5713) was broken last week; an impulse wave is developing. The intermediate target for the downward move is the support level with boundaries at 0.5485 — 0.5528.
If the correction ends near the last broken level (0.5681 — 0.5713), the potential reward/risk ratio could be small (slightly more than 1:1). If there is a correction to the resistance level (0.5781 — 0.5801), the potential reward/risk ratio could be 4:1.
A short entry on a rebound on the daily timeframe may appear after a correction forms. Short positions will remain relevant as long as the market stays below the nearest resistance level with boundaries at 0.5781 — 0.5801.
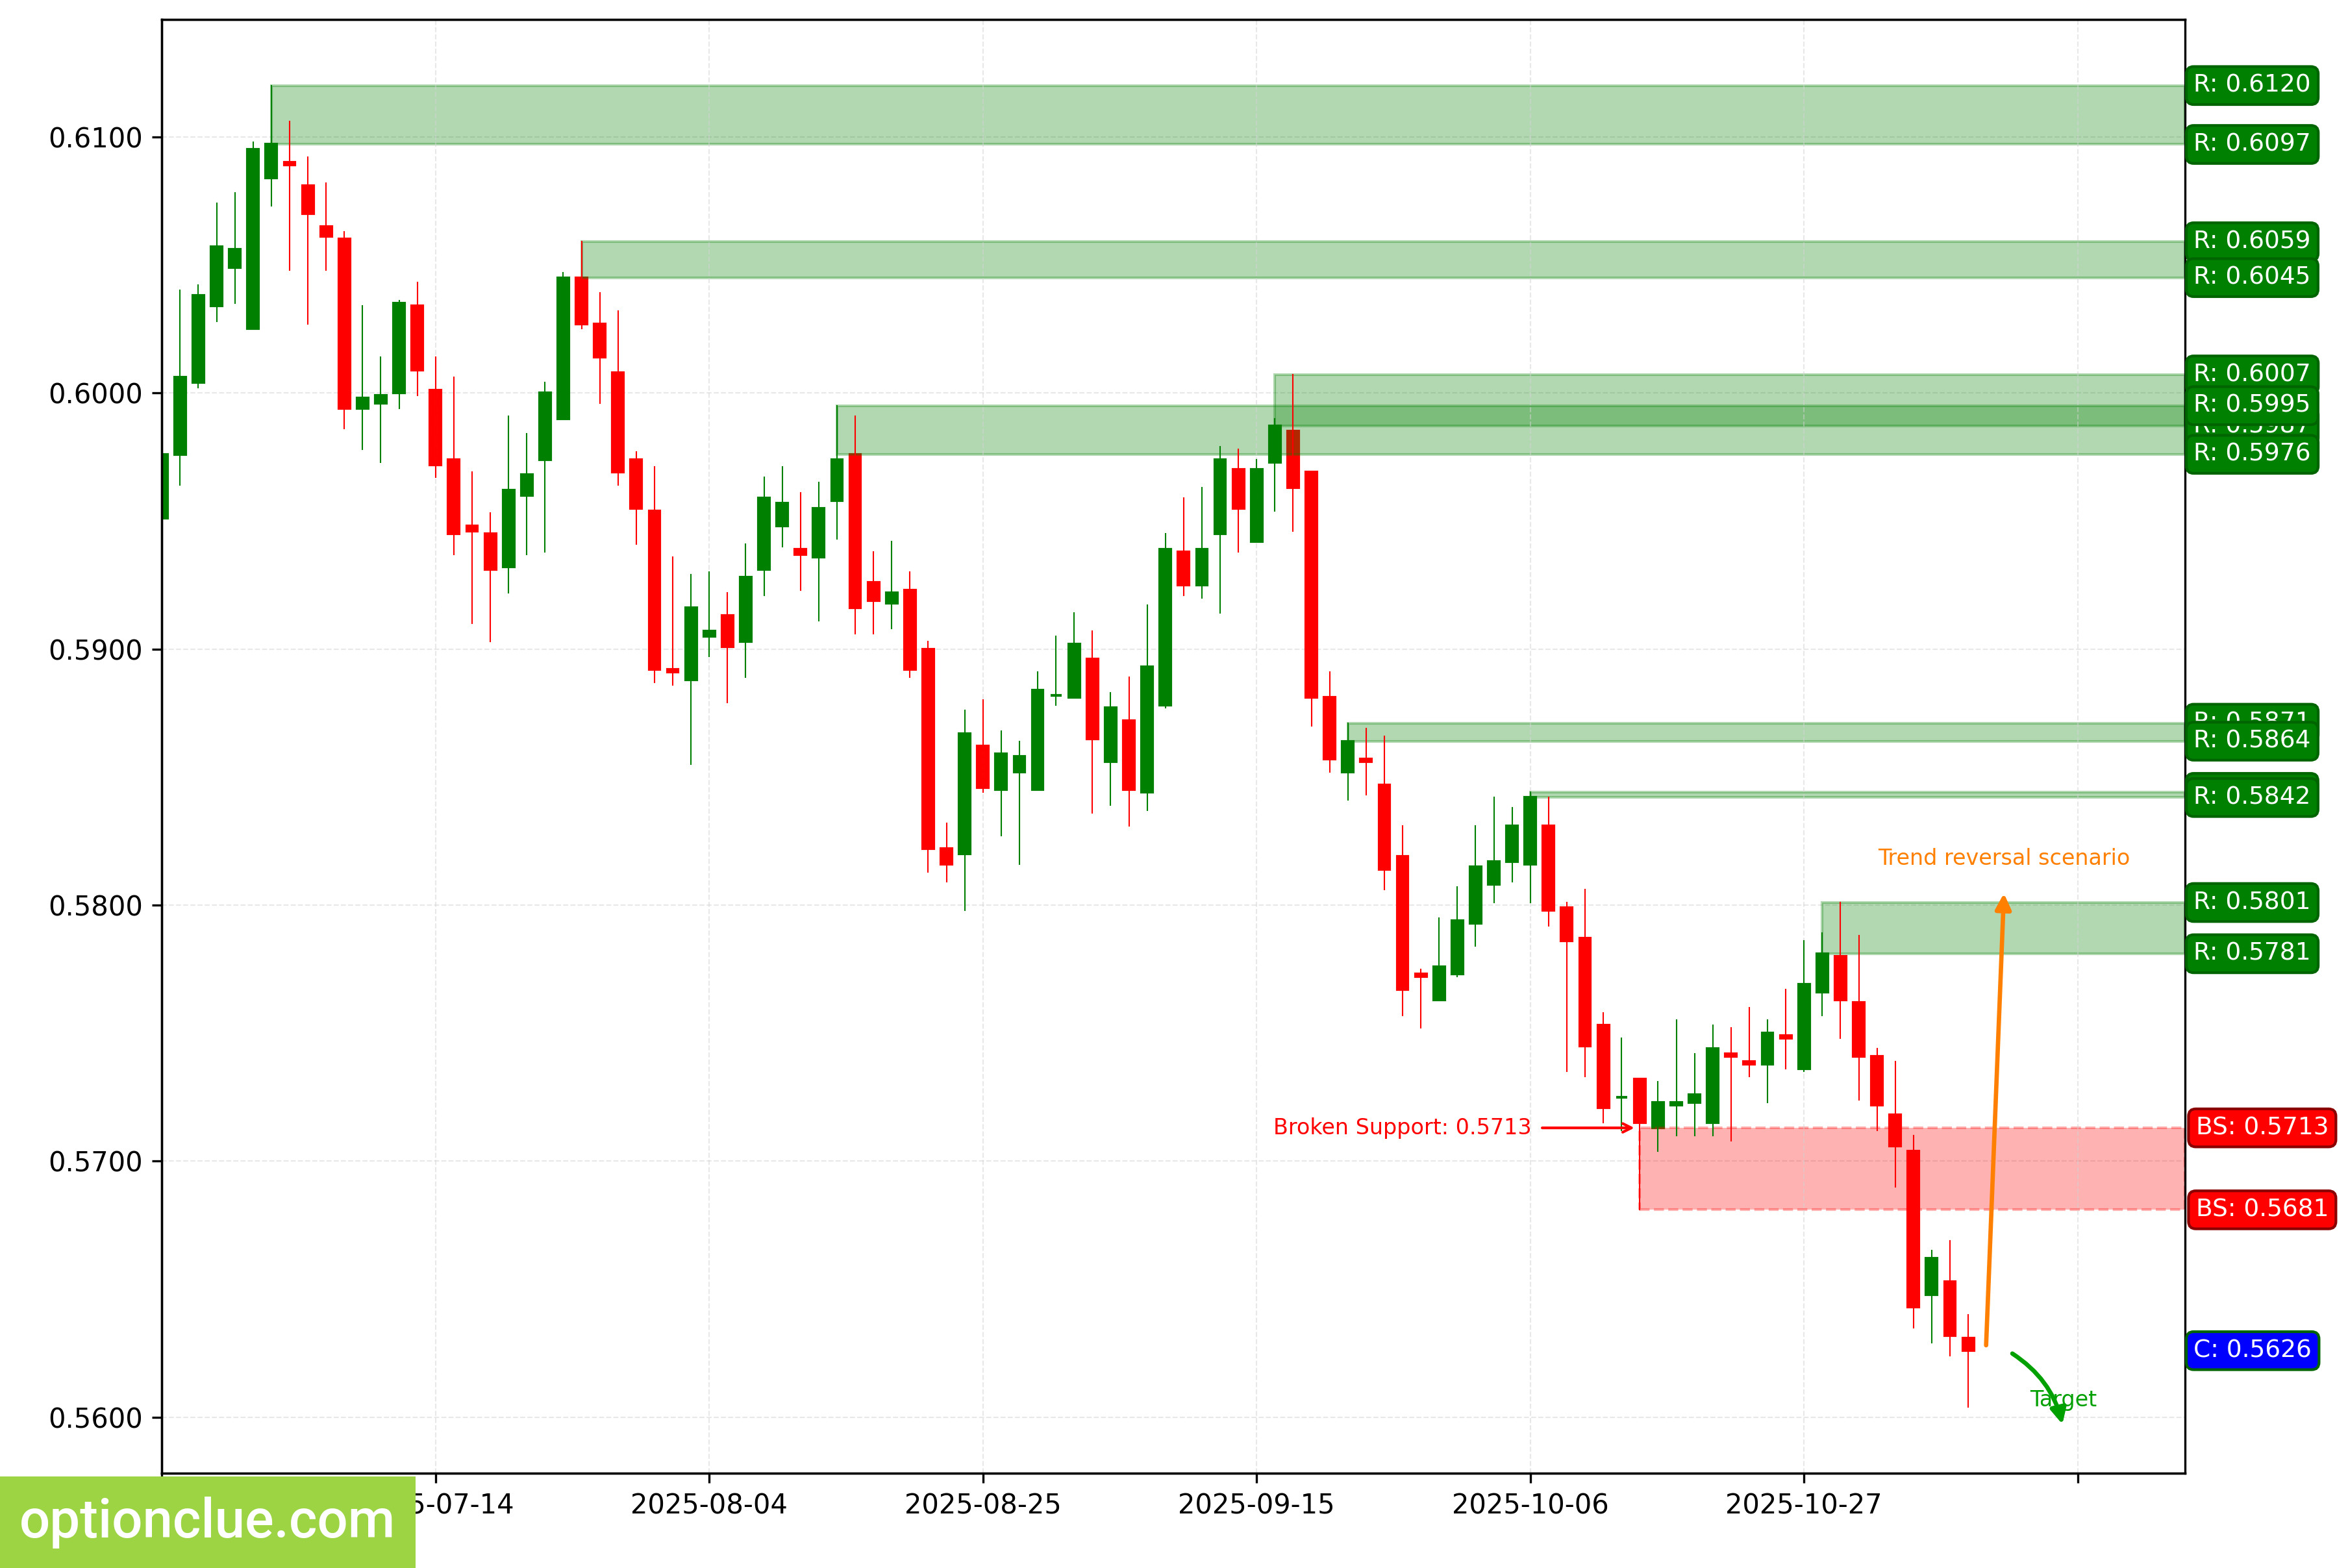
NZDUSD. Technical analysis. D1.
Bitcoin (BTC)
The trend has changed to bearish after the support level (106279 — 108308) was broken last week. The breakout occurred 6 candlesticks ago. A short entry on a rebound on the daily timeframe may appear after a correction forms.
The intermediate target for the downward move is the support level with boundaries at 98225 — 100997. If the trend develops successfully, a more distant target will be at the support level with boundaries at 93363 — 94273.
If the correction ends near the resistance level (103284 — 104042), the potential reward/risk ratio could be small (0.6:1). To improve the ratio, it makes sense to consider either a deeper correction or more distant targets.
Short positions will remain relevant as long as the market stays below the nearest resistance level with boundaries at 103284 — 104042. If the market successfully consolidates above this nearest resistance, the trend will reverse to bullish.
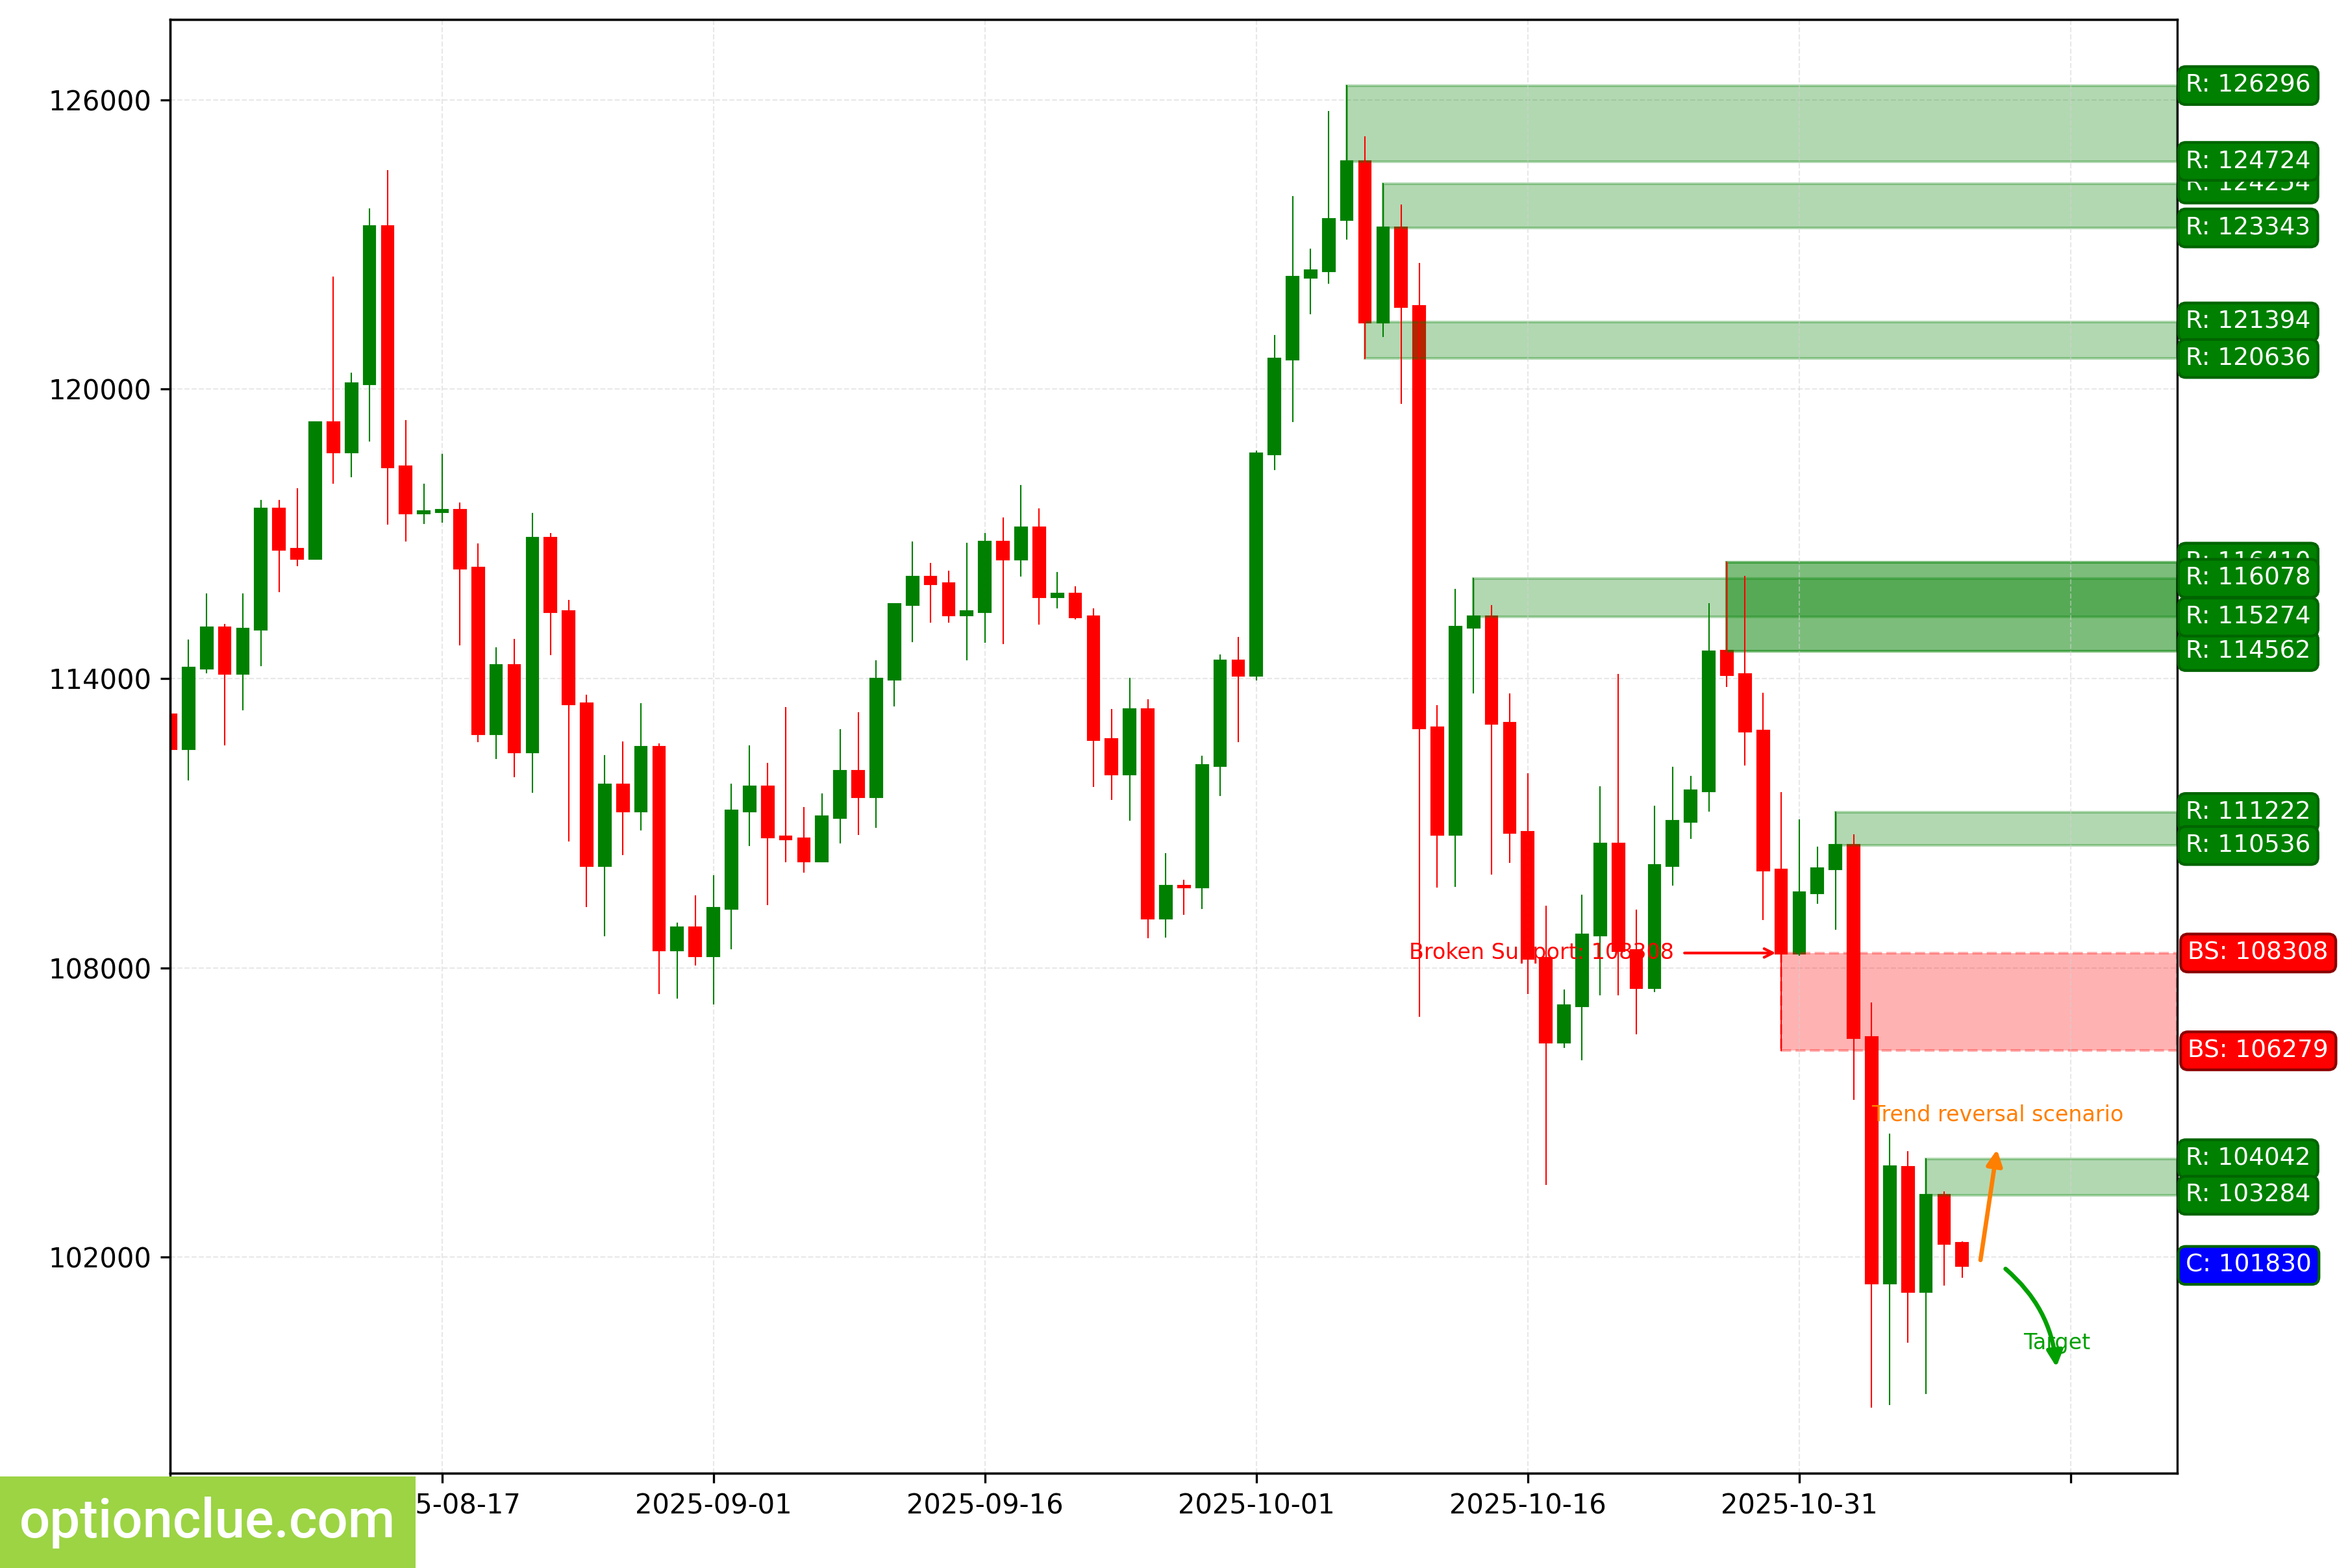
BTC. Technical analysis. D1.
Ether (ETH)
The trend has changed to bearish after the support level (3510 — 3751) was broken last week. The breakout occurred 6 candlesticks ago, and an impulse wave is developing. The intermediate target for the downward move is the support level with boundaries at 3055 — 3286.
If the correction ends near the resistance level (3434 — 3487), the potential reward/risk ratio could be small (0.7:1). To improve the ratio, it makes sense to consider either a deeper correction or more distant targets.
If the trend develops successfully, a more distant target will be at the support level with boundaries at 2475 — 2509. A short entry on a rebound on the daily timeframe may appear after a correction forms.
Short positions will remain relevant as long as the market stays below the nearest resistance level with boundaries at 3434 — 3487.
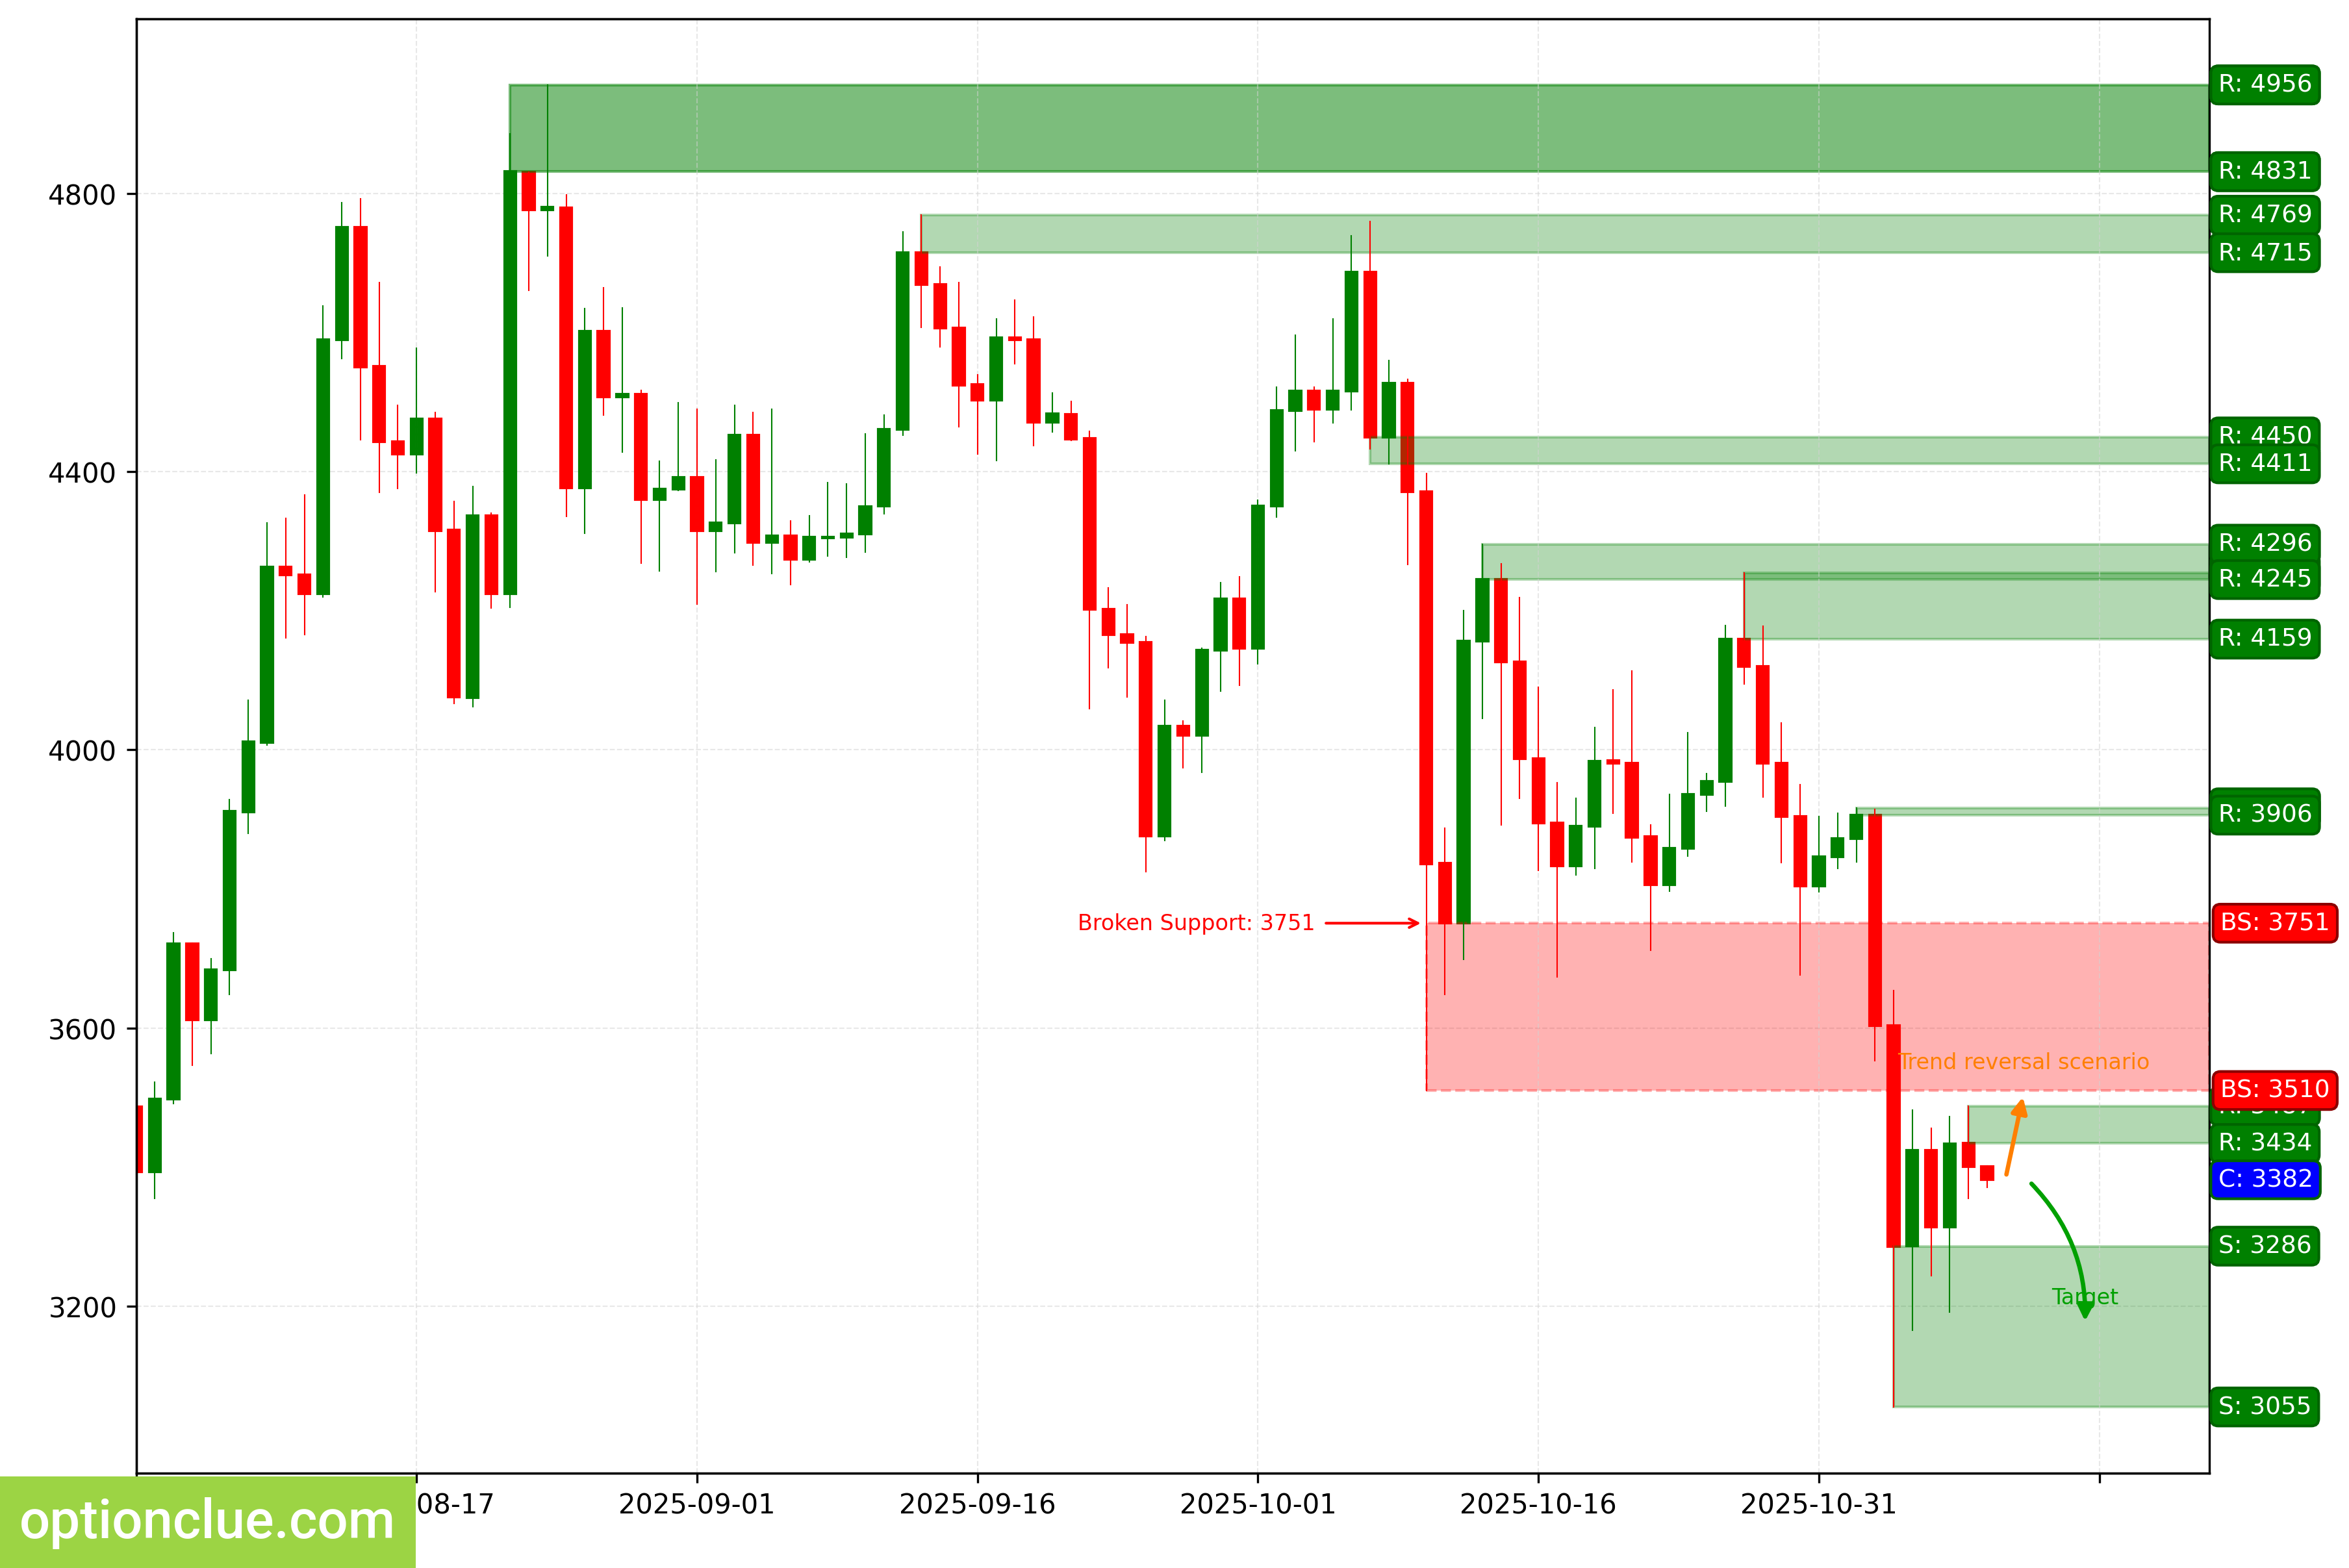
ETH. Technical analysis. D1.
Apple Inc (AAPL)
The bullish trend continues, a corrective wave is developing. The last broken level was resistance (262.77 — 265.29). The breakout occurred 10 candlesticks ago.
A long entry on a rebound may form after the current correction on the daily timeframe is complete.
Long positions will remain relevant as long as the market stays above the nearest support level with boundaries at 266.25 — 268.33.
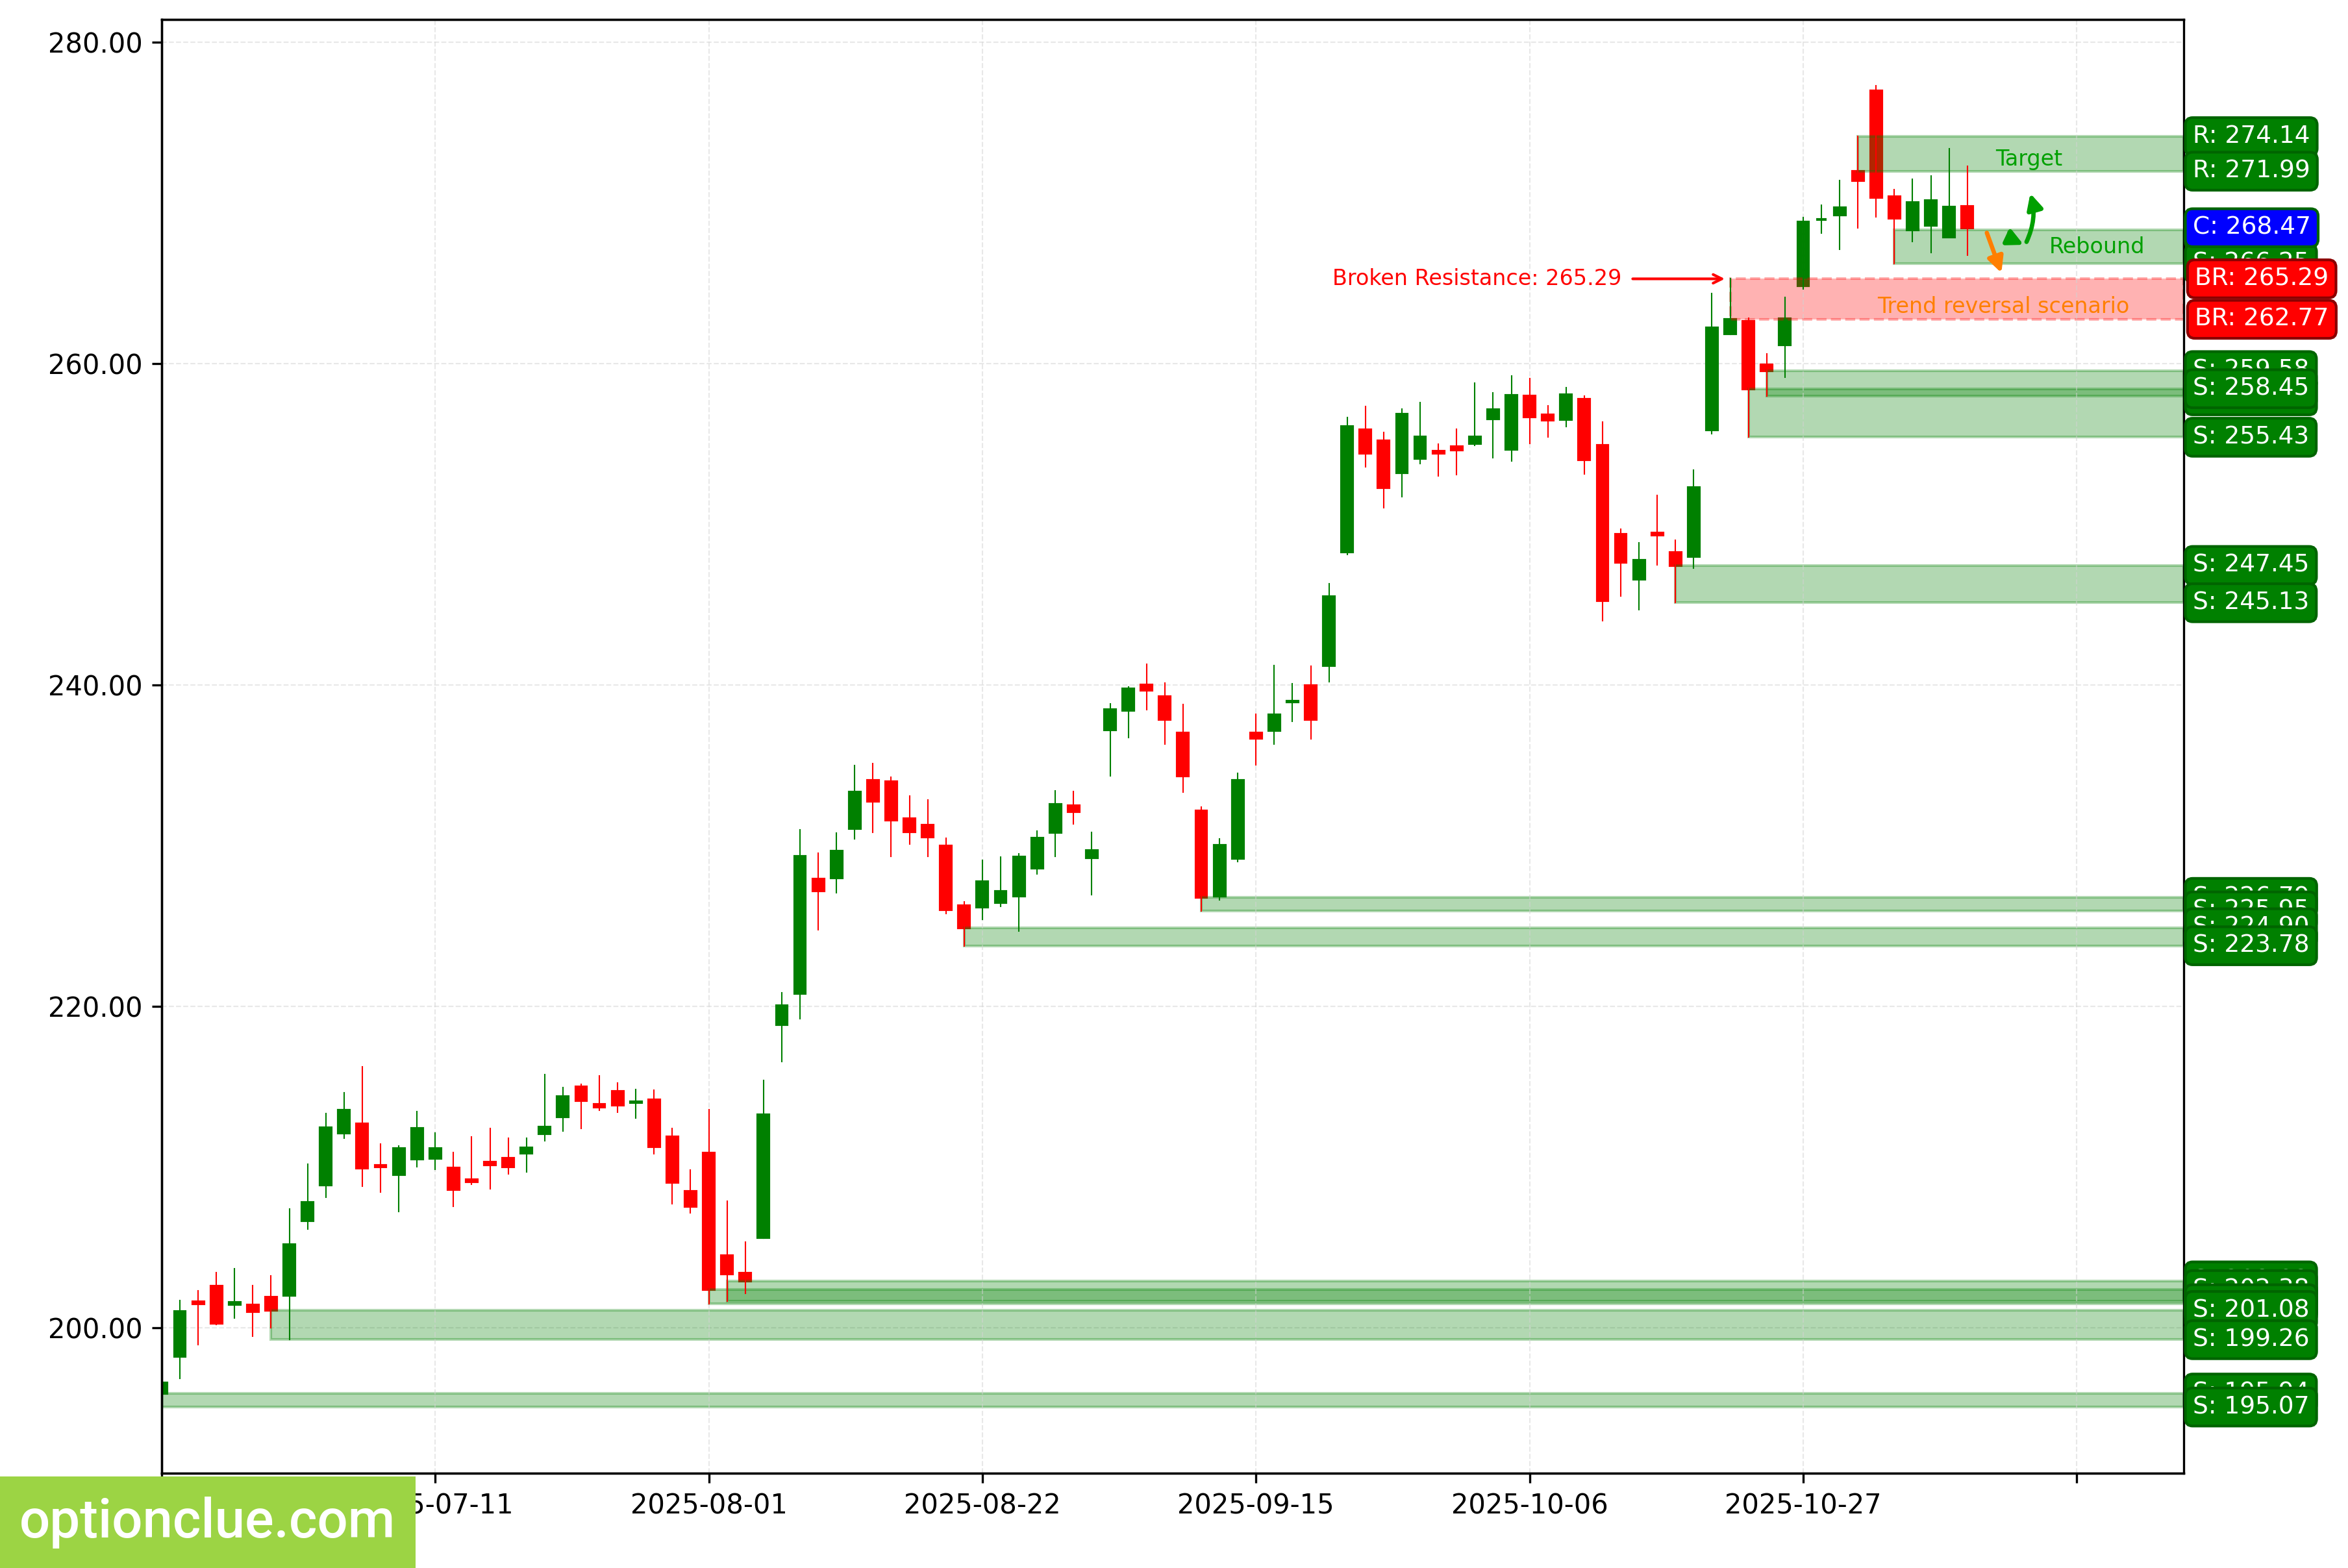
AAPL. Technical analysis. D1.
NVIDIA Corp (NVDA)
The market remains in a bullish trend. On the last closed candlestick, the correction likely ended and a long entry on a rebound formed; an impulse wave is developing.
The last broken level was resistance (183.22 — 185.20). The breakout occurred 11 candlesticks ago.
The intermediate target for the upward move is the resistance level with boundaries at 208.08 — 211.34. If the market successfully consolidates above this resistance, it will open the way for the price to move towards target #2 — the resistance level with boundaries at 207.98 — 212.19.
The potential reward/risk ratio from current prices, when setting targets and managing risk based on daily levels, could be greater than 1:1.
Long positions will remain relevant as long as the market stays above the nearest daily support level with boundaries at 176.76 — 180.28.
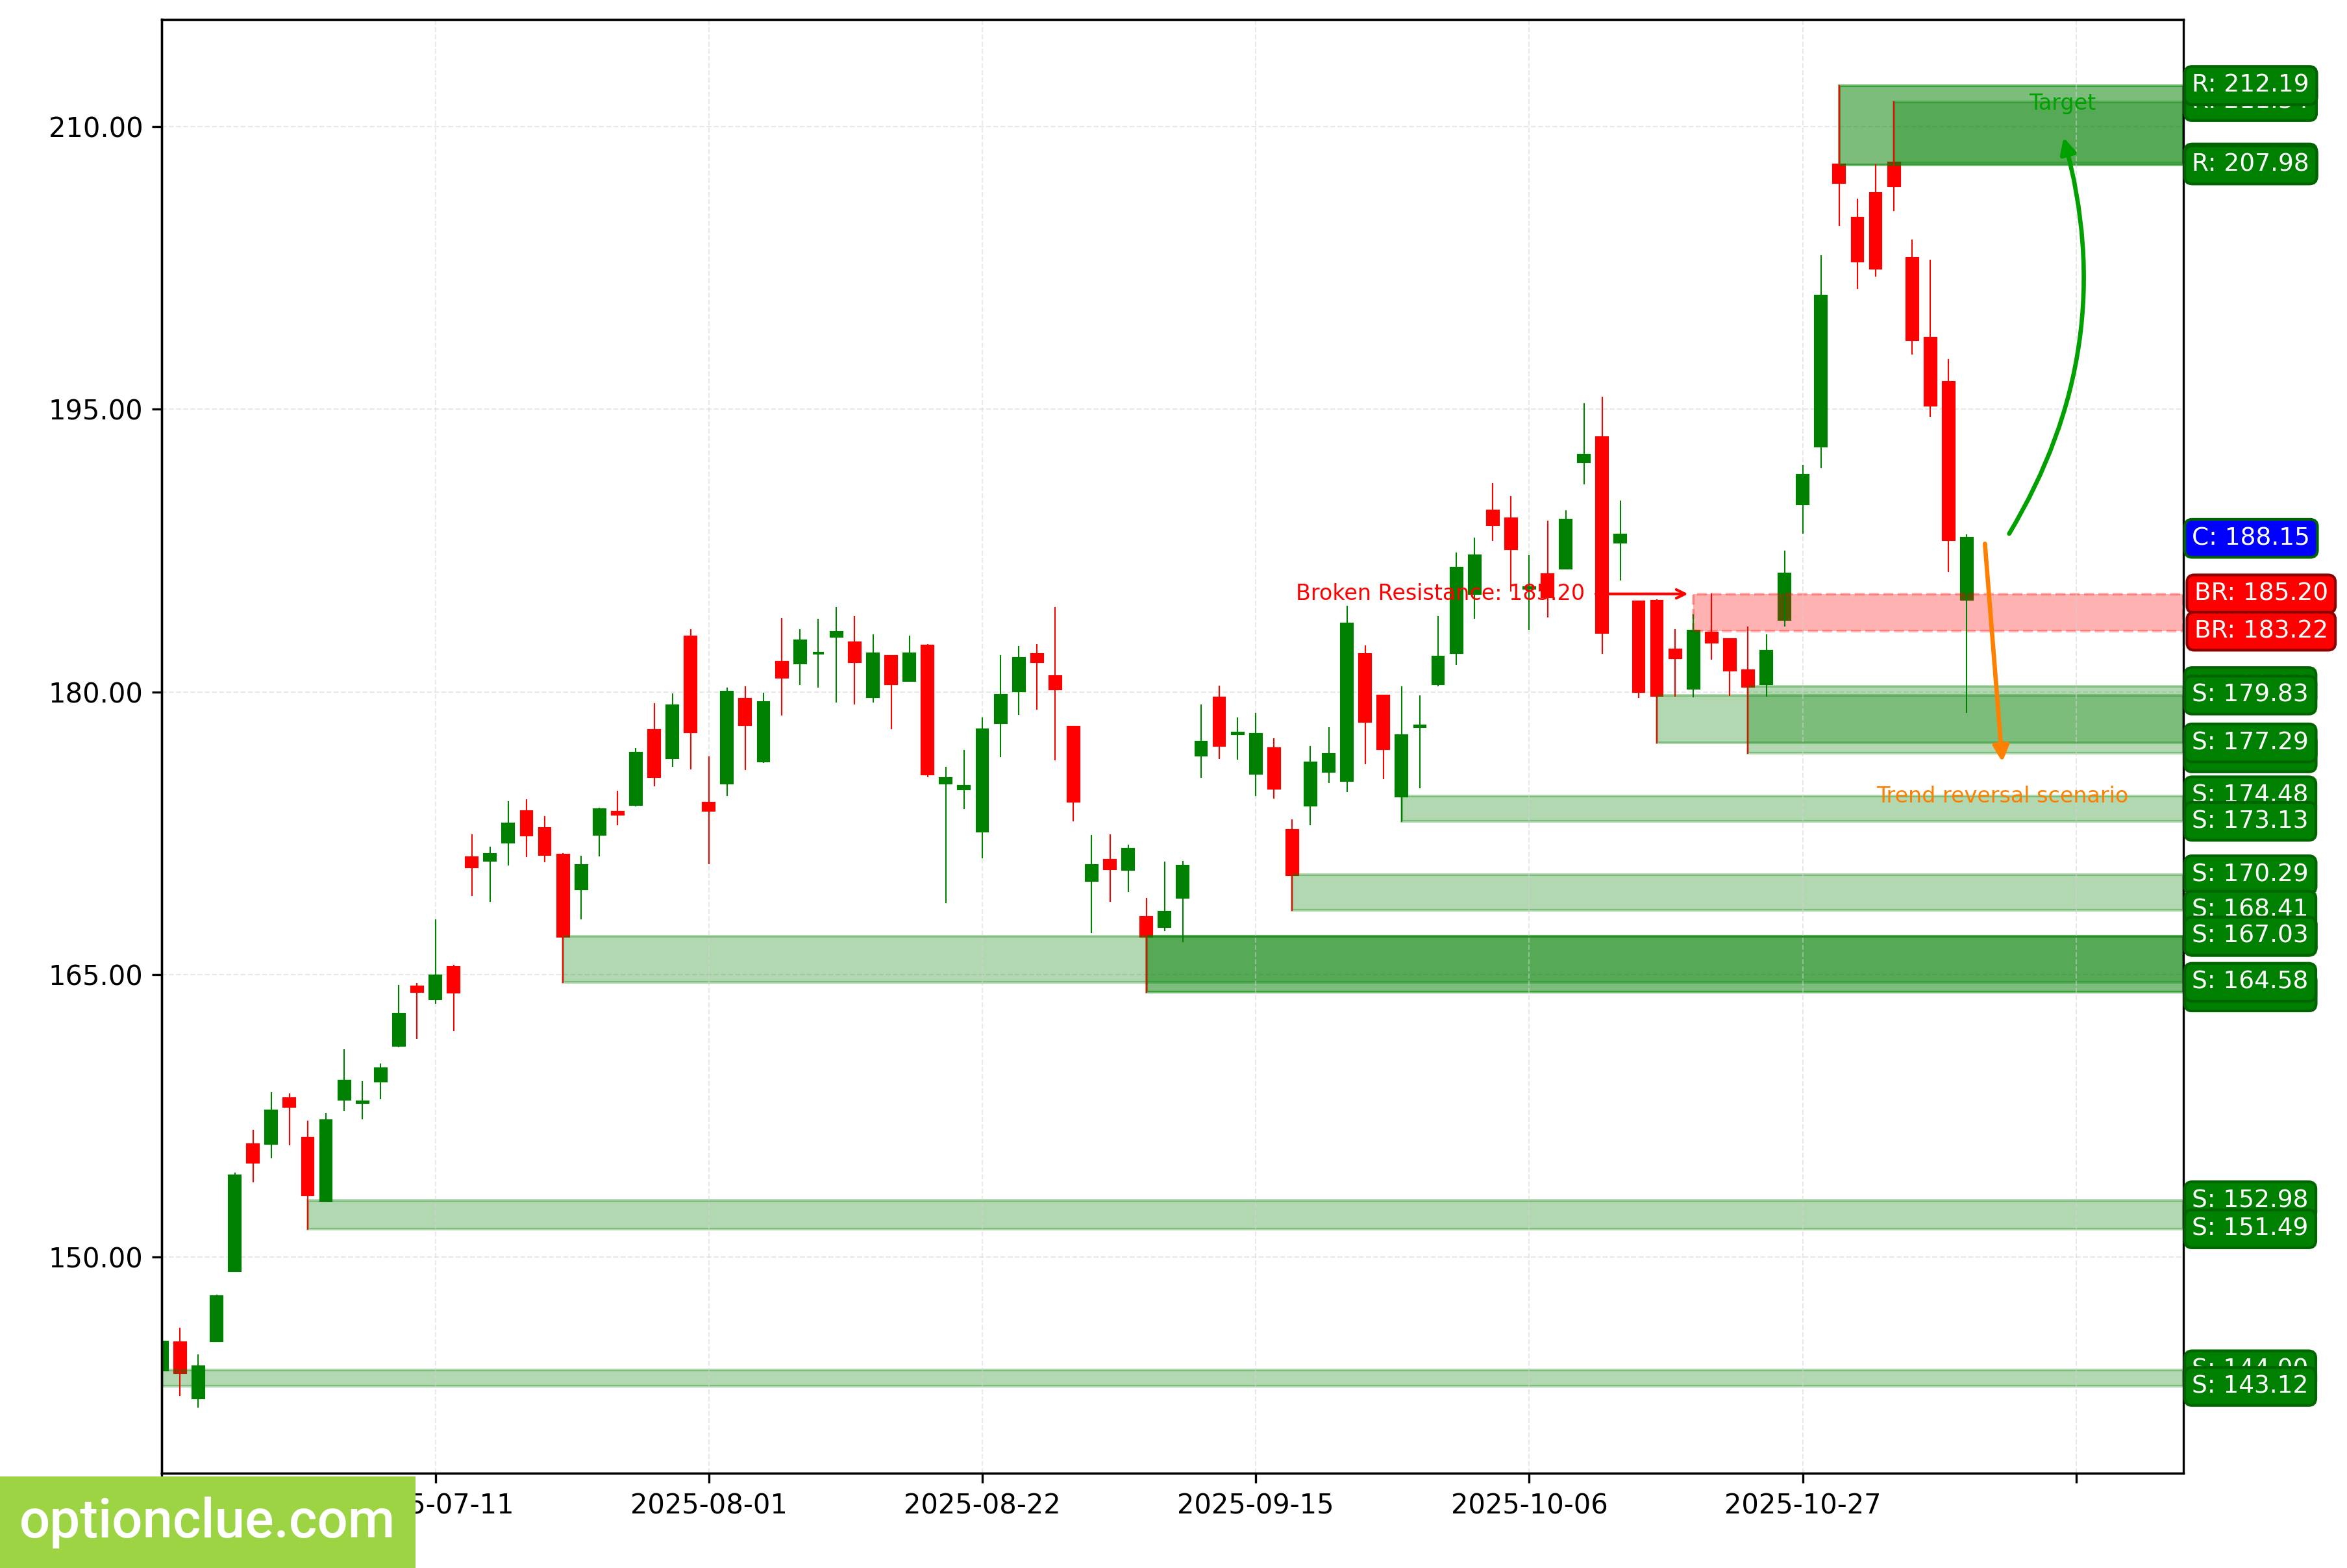
NVDA. Technical analysis. D1.
Tesla Inc (TSLA)
The trend changed to bearish after the support level (440.71 — 444.26) was broken last week. The breakout occurred on the last closed candlestick, and an impulse wave is developing.
The intermediate target for the downward move is the support level with boundaries at 413.90 — 420.00.
If the correction ends near the last broken level (440.71 — 444.26), the potential reward/risk ratio could be small (0.4:1). If there is a correction to the resistance level (468.37 — 474.07), the potential reward/risk ratio could be around 2:1.
If the trend develops successfully, a more distant target will be at the support level with boundaries at 411.45 — 413.49. A short entry on a rebound may form after a correction forms.
Short positions will remain relevant as long as the market stays below the nearest resistance level with boundaries at 468.37 — 474.07.
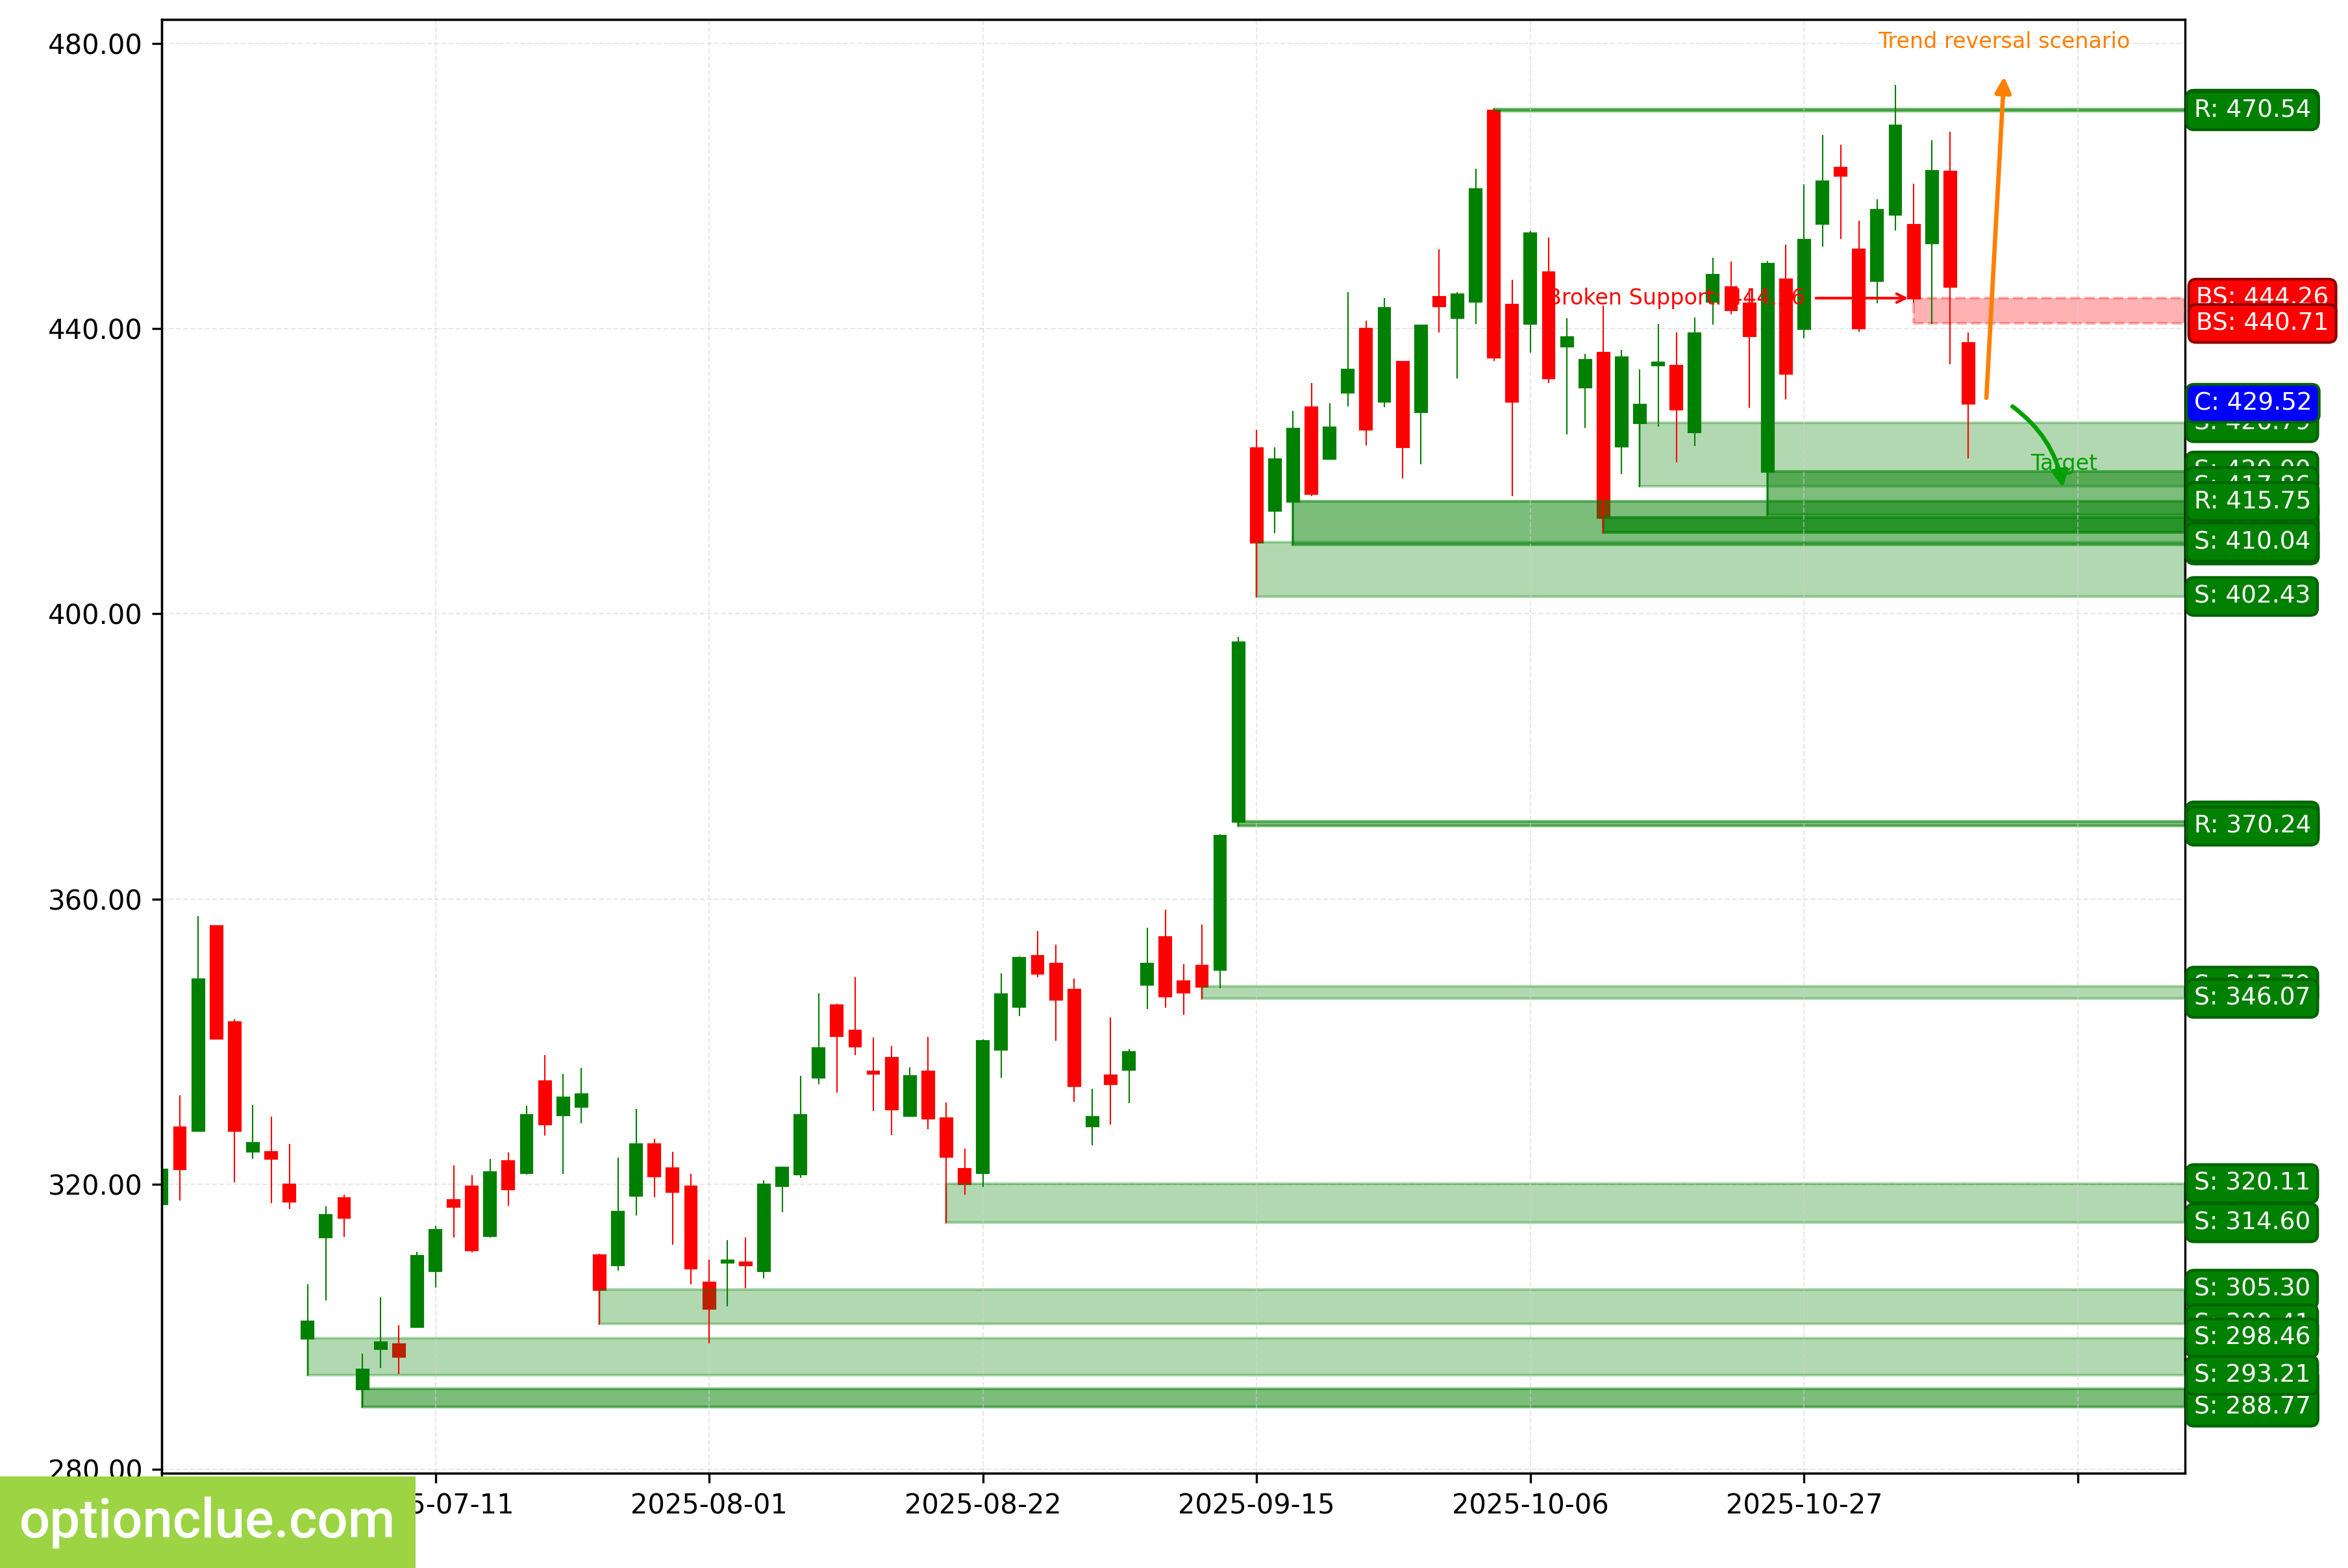
TSLA. Technical analysis. D1.
Summary
In the medium term, EURUSD, GBPUSD, USDJPY, AUDUSD, USDCAD, NVDA stand out due to their corrections on the daily timeframe being close to completion.
The other assets may be worthy of attention depending on the depth of the market’s correction.