
We examine the most important levels for key financial instruments and probable development scenarios.
Key Topics
- Euro (EURUSD)
- British Pound (GBPUSD)
- Japanese Yen (USDJPY)
- Canadian Dollar (USDCAD)
- Australian Dollar (AUDUSD)
- Bitcoin (BTC)
- Ether (ETH)
- Apple Inc (AAPL)
- NVIDIA Corp (NVDA)
- Tesla Inc (TSLA)
- Summary
Euro (EURUSD)
The trend has changed to bearish, when the support level (1.1741 — 1.1772) was broken out 5 candlesticks ago. A corrective wave is developing. An entry point for selling on rebound may form after the current correction completes.
The intermediate target for the downward movement is the support level with boundaries 1.1570 — 1.1583. In case of successful trend development, a further target will be at the support level with boundaries 1.1468 — 1.1482.
The potential profit/risk ratio from current prices when setting targets and fixing risks at daily timeframe levels may be small (about 0.1:1). When using a further target — also small (approximately 0.5:1). If the correction completes near the resistance level (1.1813 — 1.1828), the potential profit/risk ratio may be approximately 2.5:1. When selecting a further target — around 3.6:1. If the correction completes near the last broken level (1.1741 — 1.1772), the potential profit/risk ratio may be around 1.1:1. For a further target — approximately 1.7:1.
Short positions will remain relevant, as long as the market remains below the nearest resistance level with boundaries 1.1813 — 1.1828. If the market successfully closes above this nearest resistance, the trend will change to the opposite (bullish).
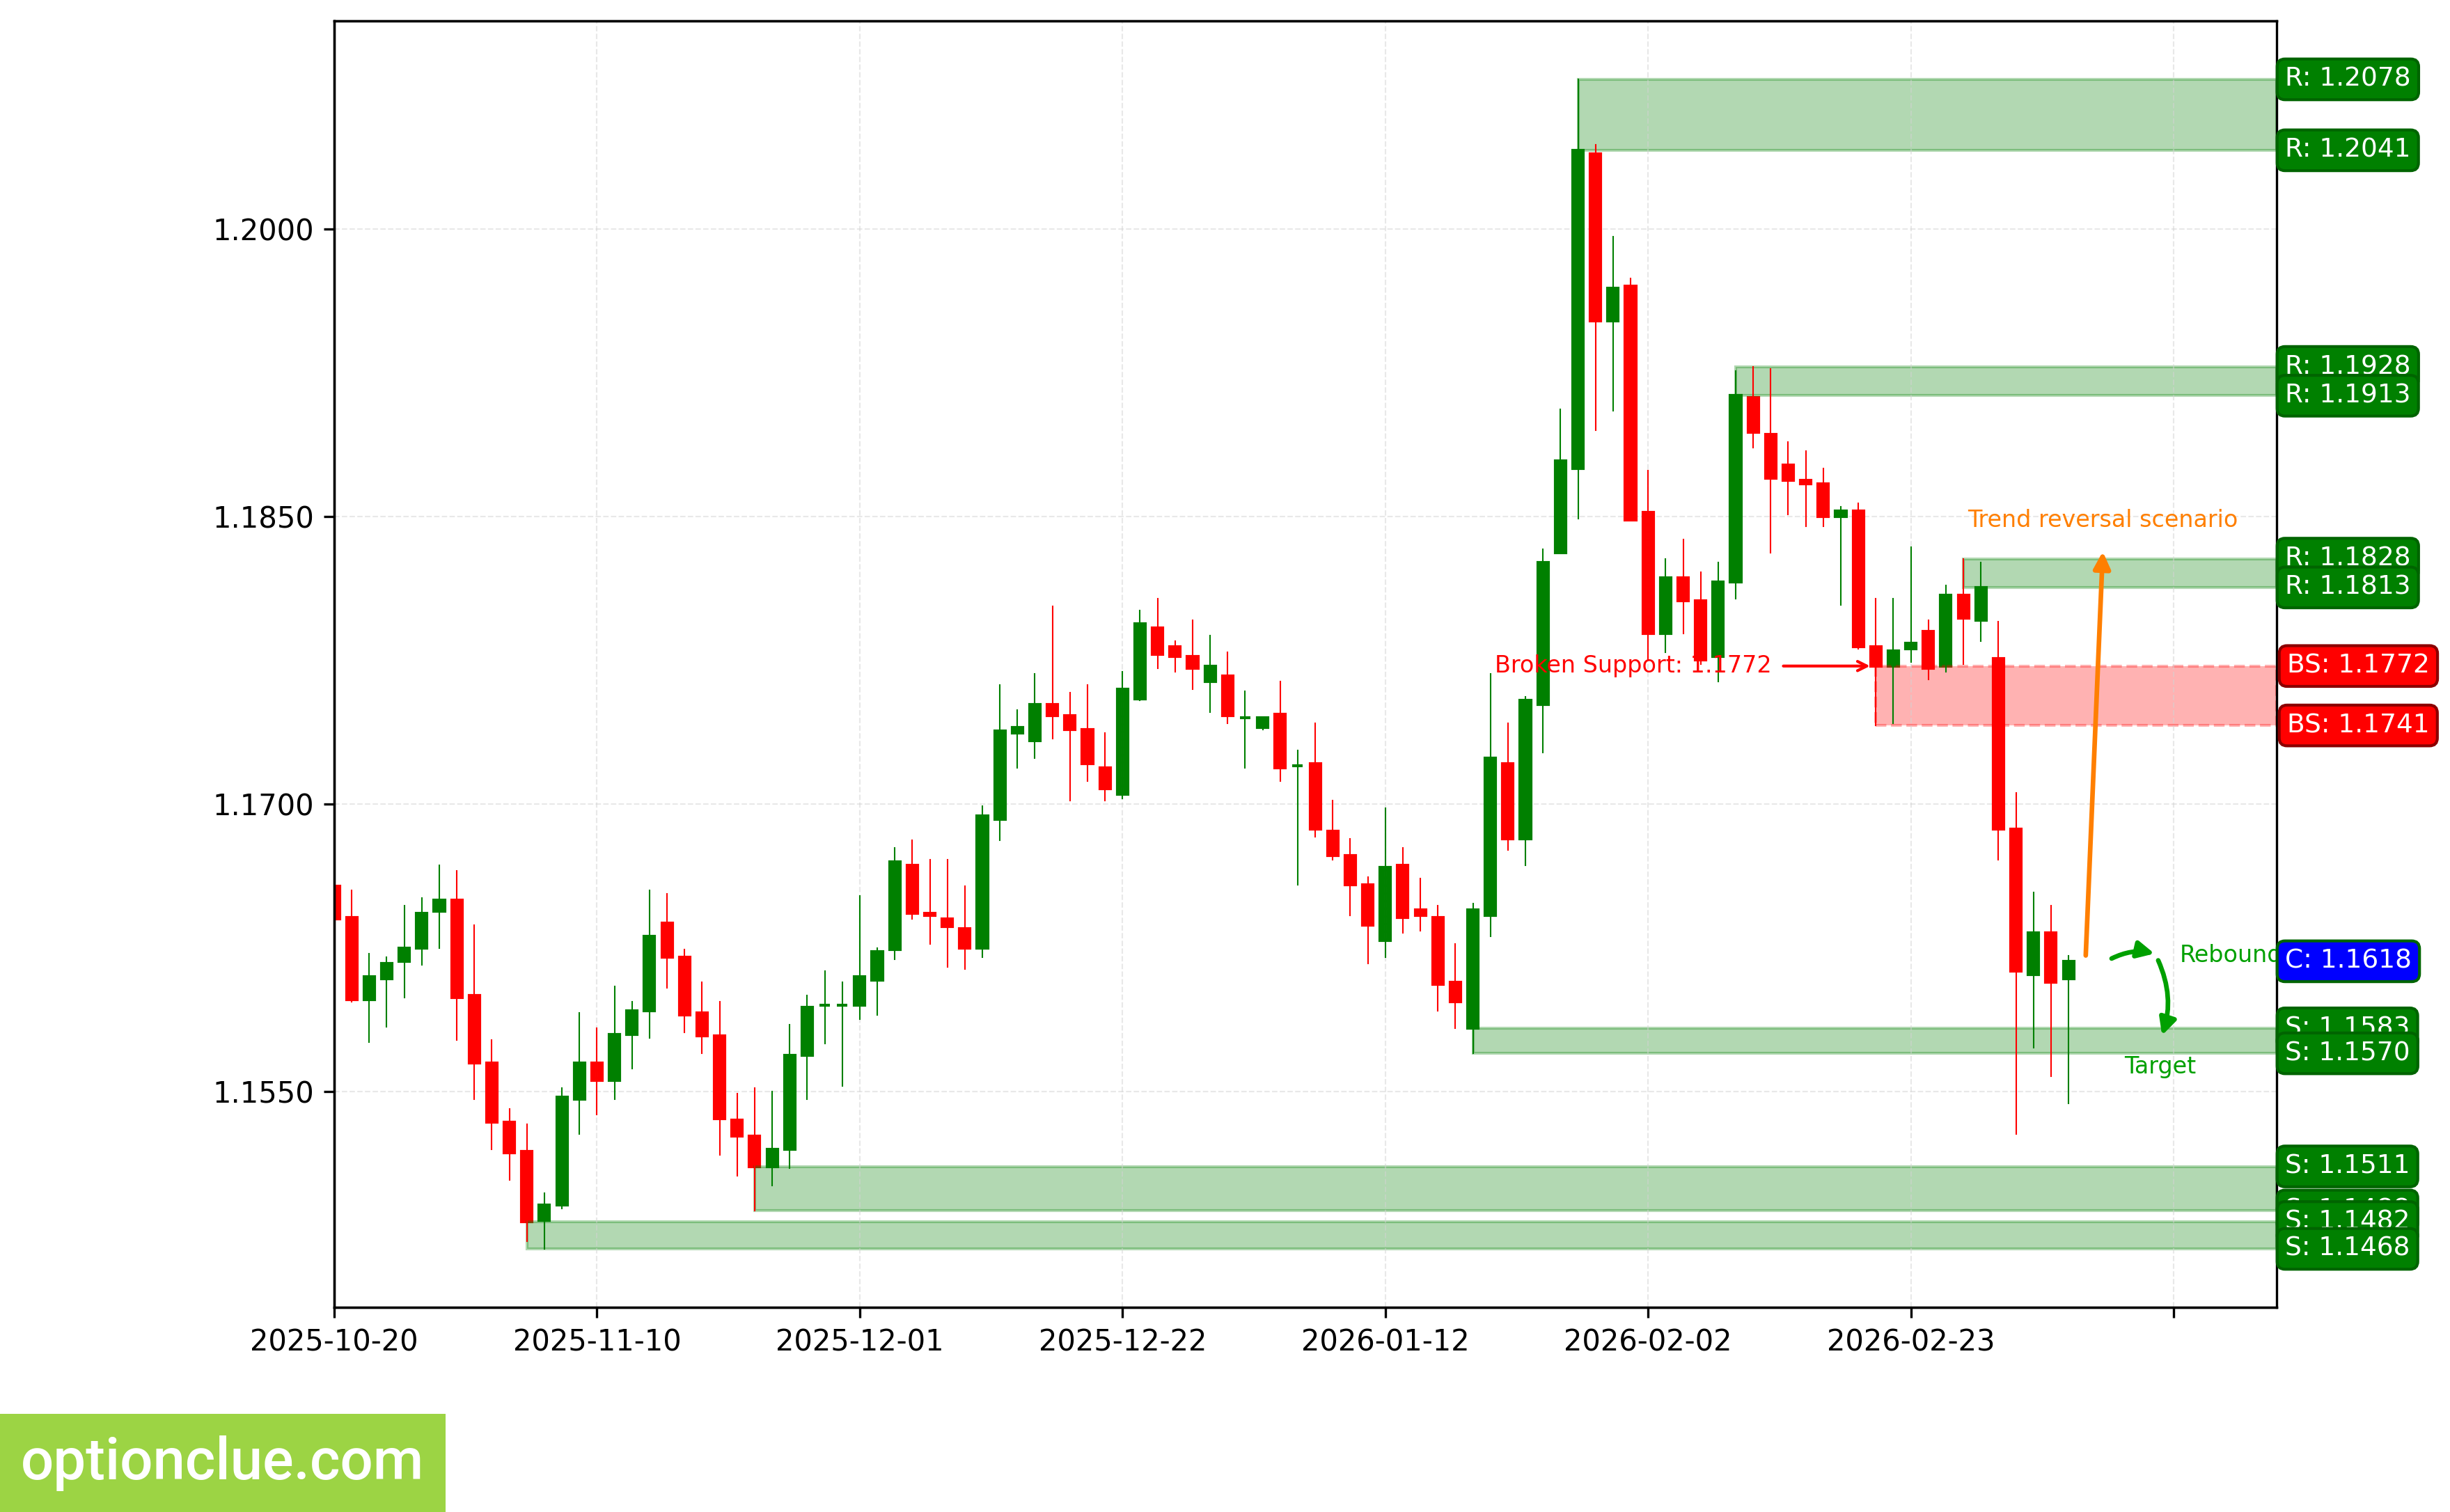
EURUSD. Technical analysis. D1.
British Pound (GBPUSD)
The trend has changed to bearish, when the support level (1.3434 — 1.3460) was broken out last week. The breakout occurred 5 candlesticks ago. A corrective wave is developing. An entry point for selling on rebound may form after the current correction completes.
The intermediate target for the downward movement is the support level with boundaries 1.3253 — 1.3352. In case of successful trend development, a further target will be at the support level with boundaries 1.3038 — 1.3060.
The potential profit/risk ratio from current prices when setting targets and fixing risks at daily timeframe levels may be small (about 0.2:1). When using a further target — around 1:1. If the correction completes near the resistance level (1.3653 — 1.3662), the potential profit/risk ratio may be approximately 2.5:1. For a further target — around 5:1. If the correction completes near the last broken level (1.3434 — 1.3460), the potential profit/risk ratio may be small (about 0.3:1). When selecting a further target — around 1.2:1.
Short positions will remain relevant, as long as the market remains below the nearest resistance level with boundaries 1.3653 — 1.3662. If the market successfully closes above this nearest resistance, the trend will change to the opposite (bullish).
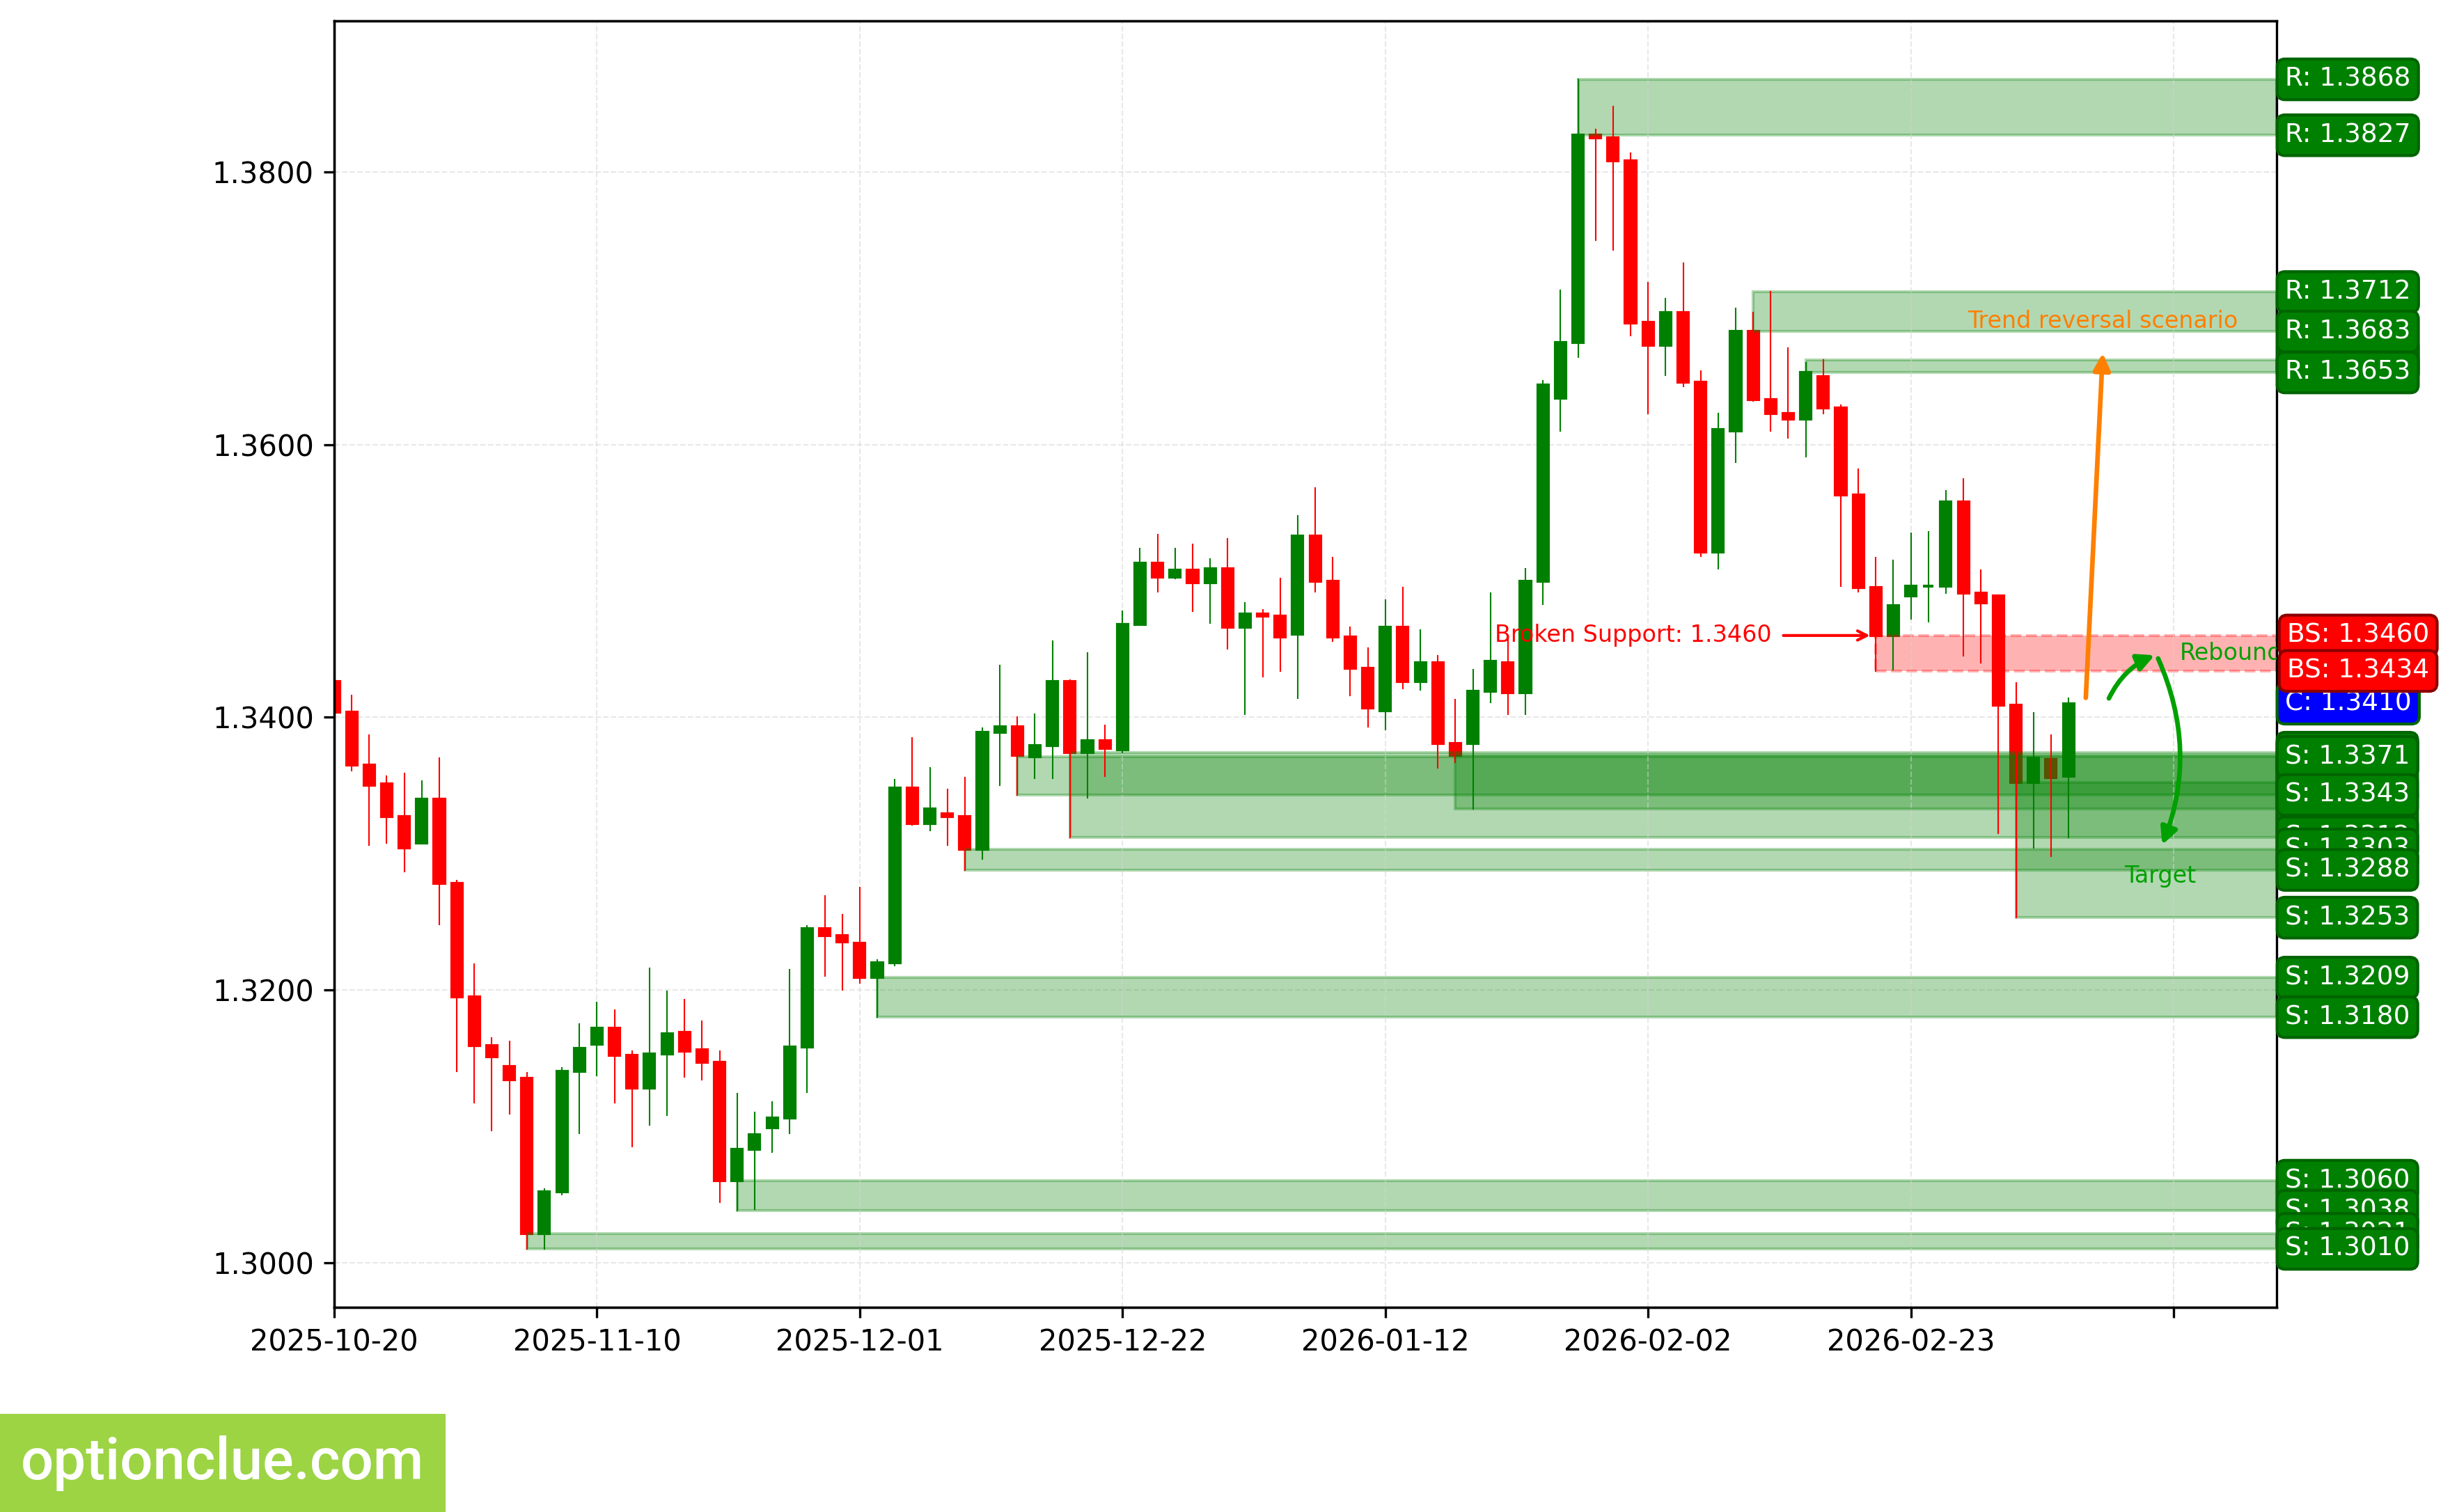
GBPUSD. Technical analysis. D1.
Japanese Yen (USDJPY)
The bullish trend continues, the correction likely completed 2 candlesticks ago, an impulse wave is developing. The last broken level is resistance (156.19 — 156.82). The breakout occurred 5 candlesticks ago.
The intermediate target for the upward movement is the resistance level with boundaries 158.50 — 159.22.
The potential profit/risk ratio from current prices when setting targets and fixing risks at daily timeframe levels may be small (approximately 0.3:1).
Long positions will remain relevant, as long as the market remains above the nearest support level with boundaries 156.47 — 156.98. If the market successfully closes below this support, the trend will change to the opposite (bearish).
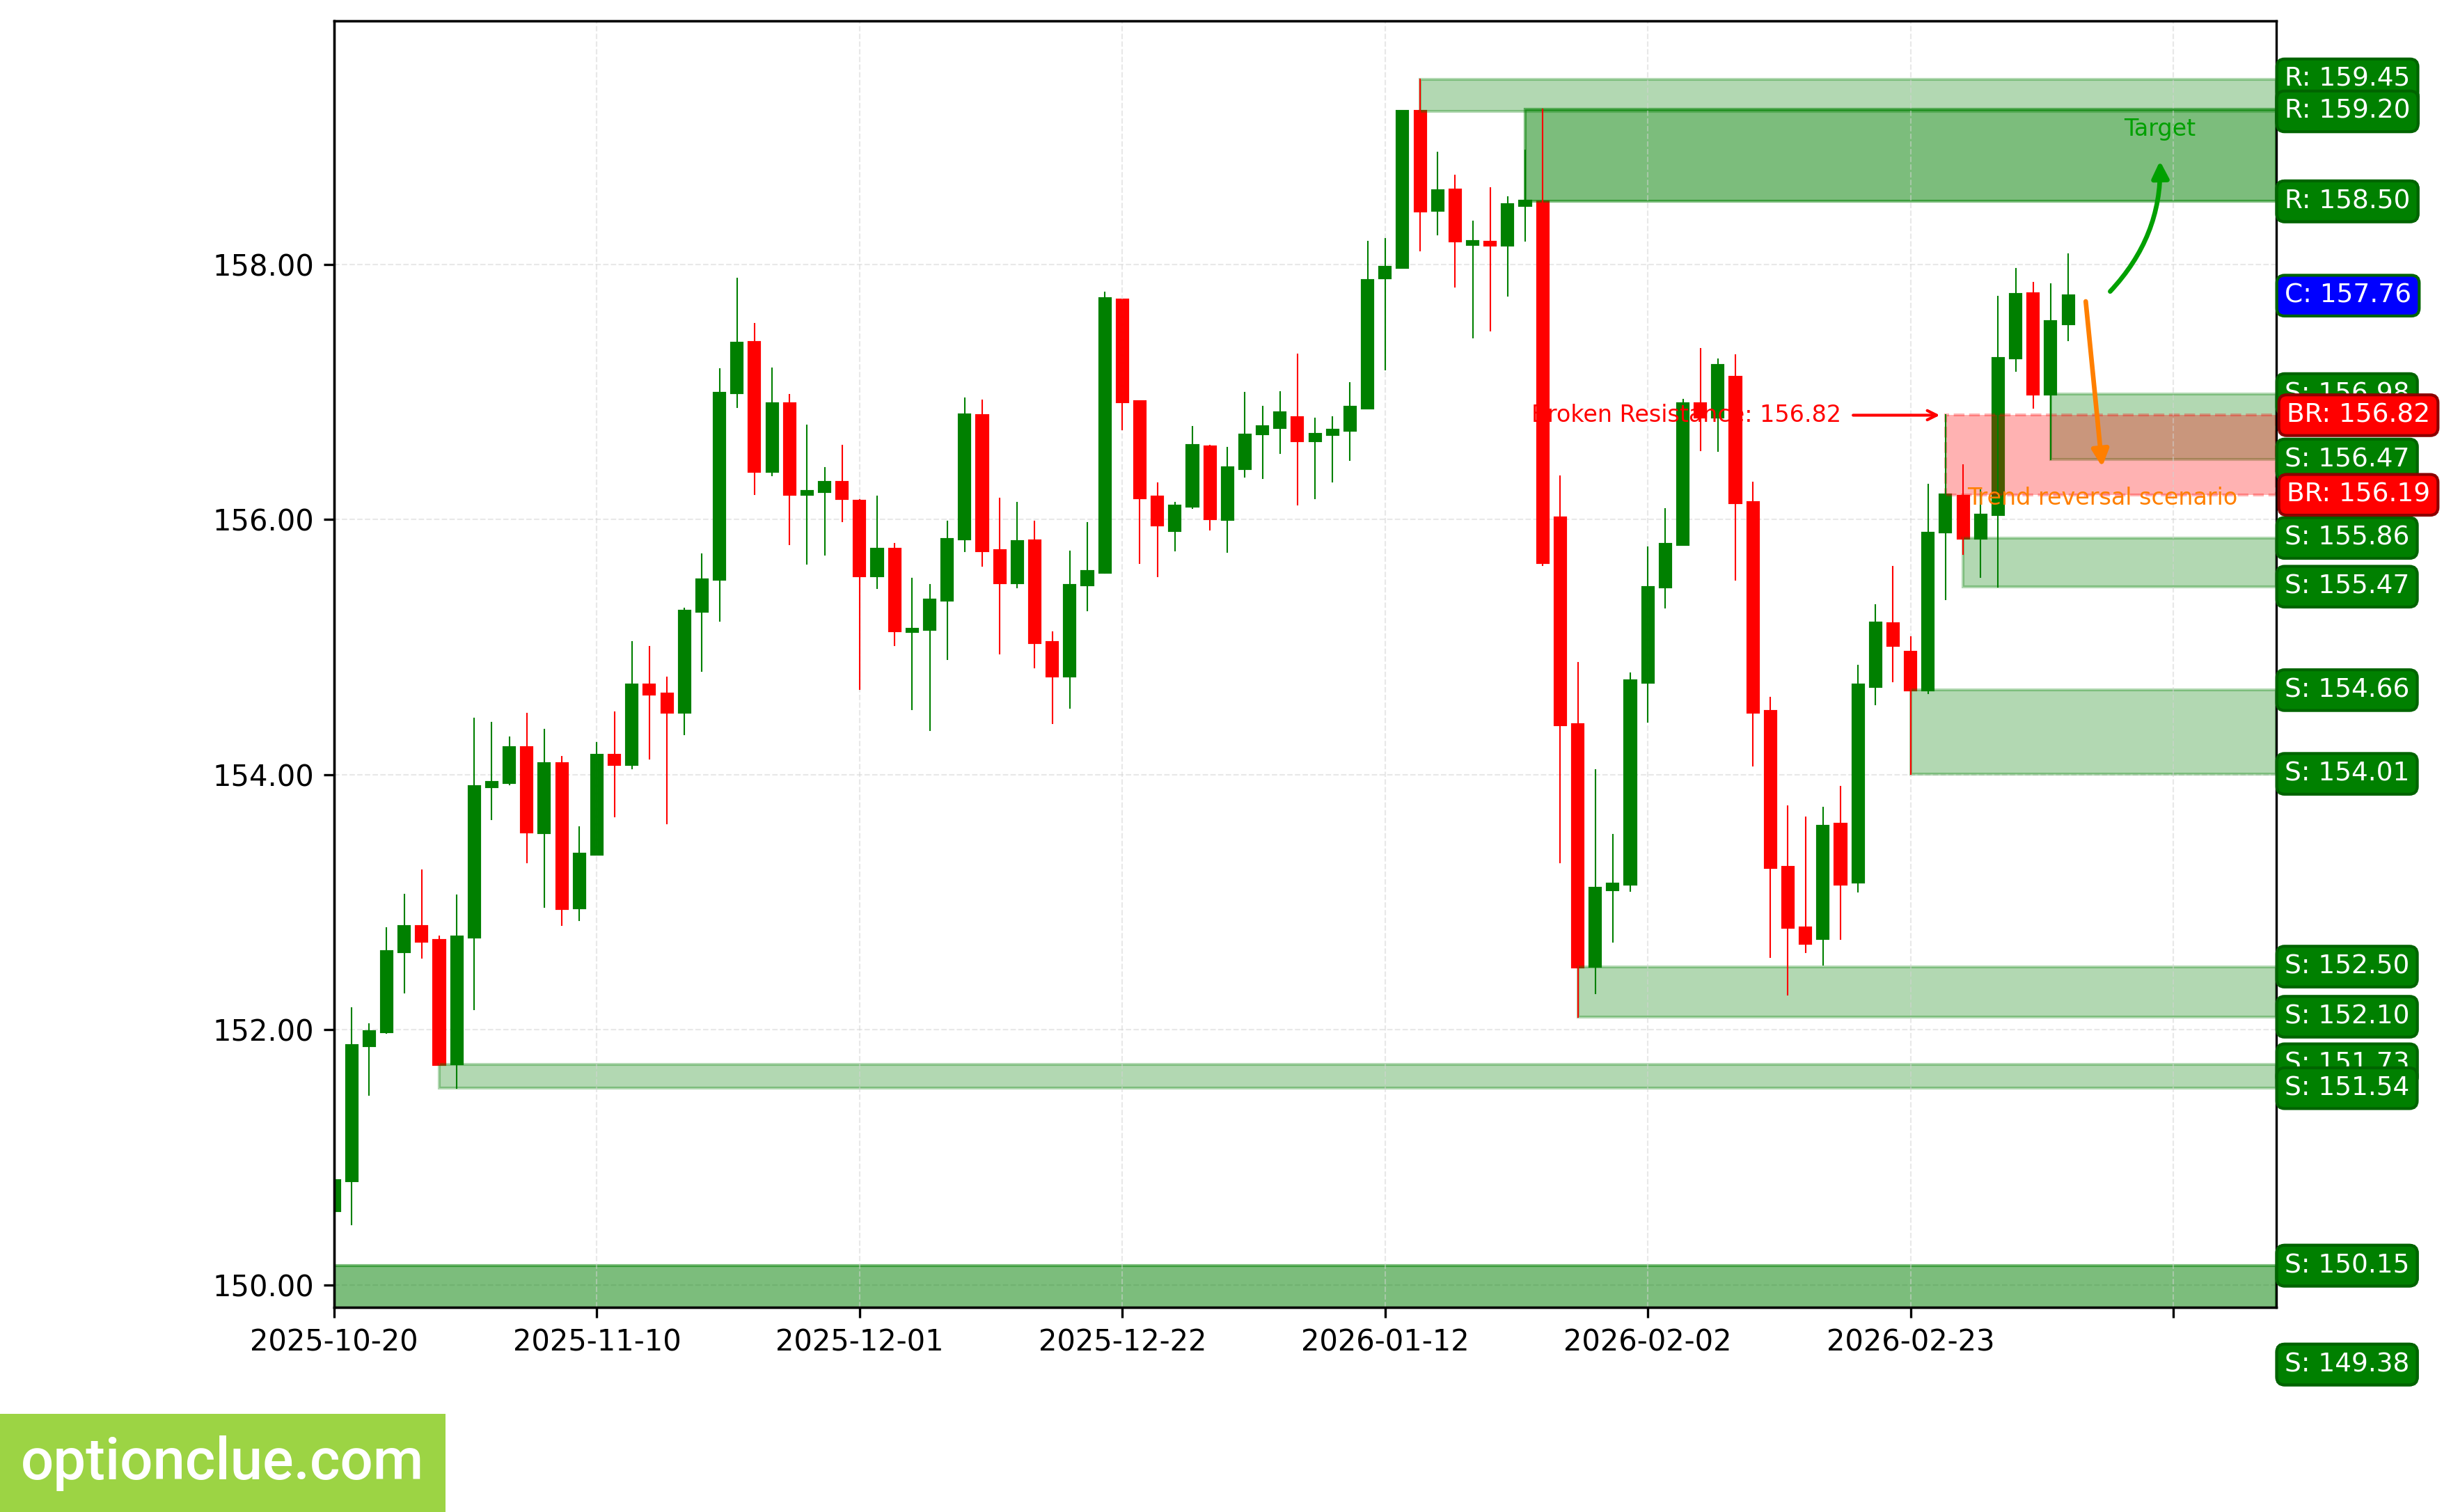
USDJPY. Technical analysis. D1.
Canadian Dollar (USDCAD)
The bearish trend continues, an impulse wave is developing after the breakout. The last broken level is support (1.3622 — 1.3642). The breakout occurred on the last closed candlestick.
The intermediate target for the downward movement is the support level with boundaries 1.3501 — 1.3550.
If the new correction completes near the resistance level (1.3695 — 1.3714), the potential profit/risk ratio may be approximately 1.7:1. If the next correction completes near the last broken level (1.3622 — 1.3642), the potential profit/risk ratio may be small (approximately 0.5:1).
Short positions will remain relevant, as long as the market remains below the nearest resistance level with boundaries 1.3695 — 1.3714. If the market successfully closes above this nearest resistance, the trend will change to the opposite (bullish).
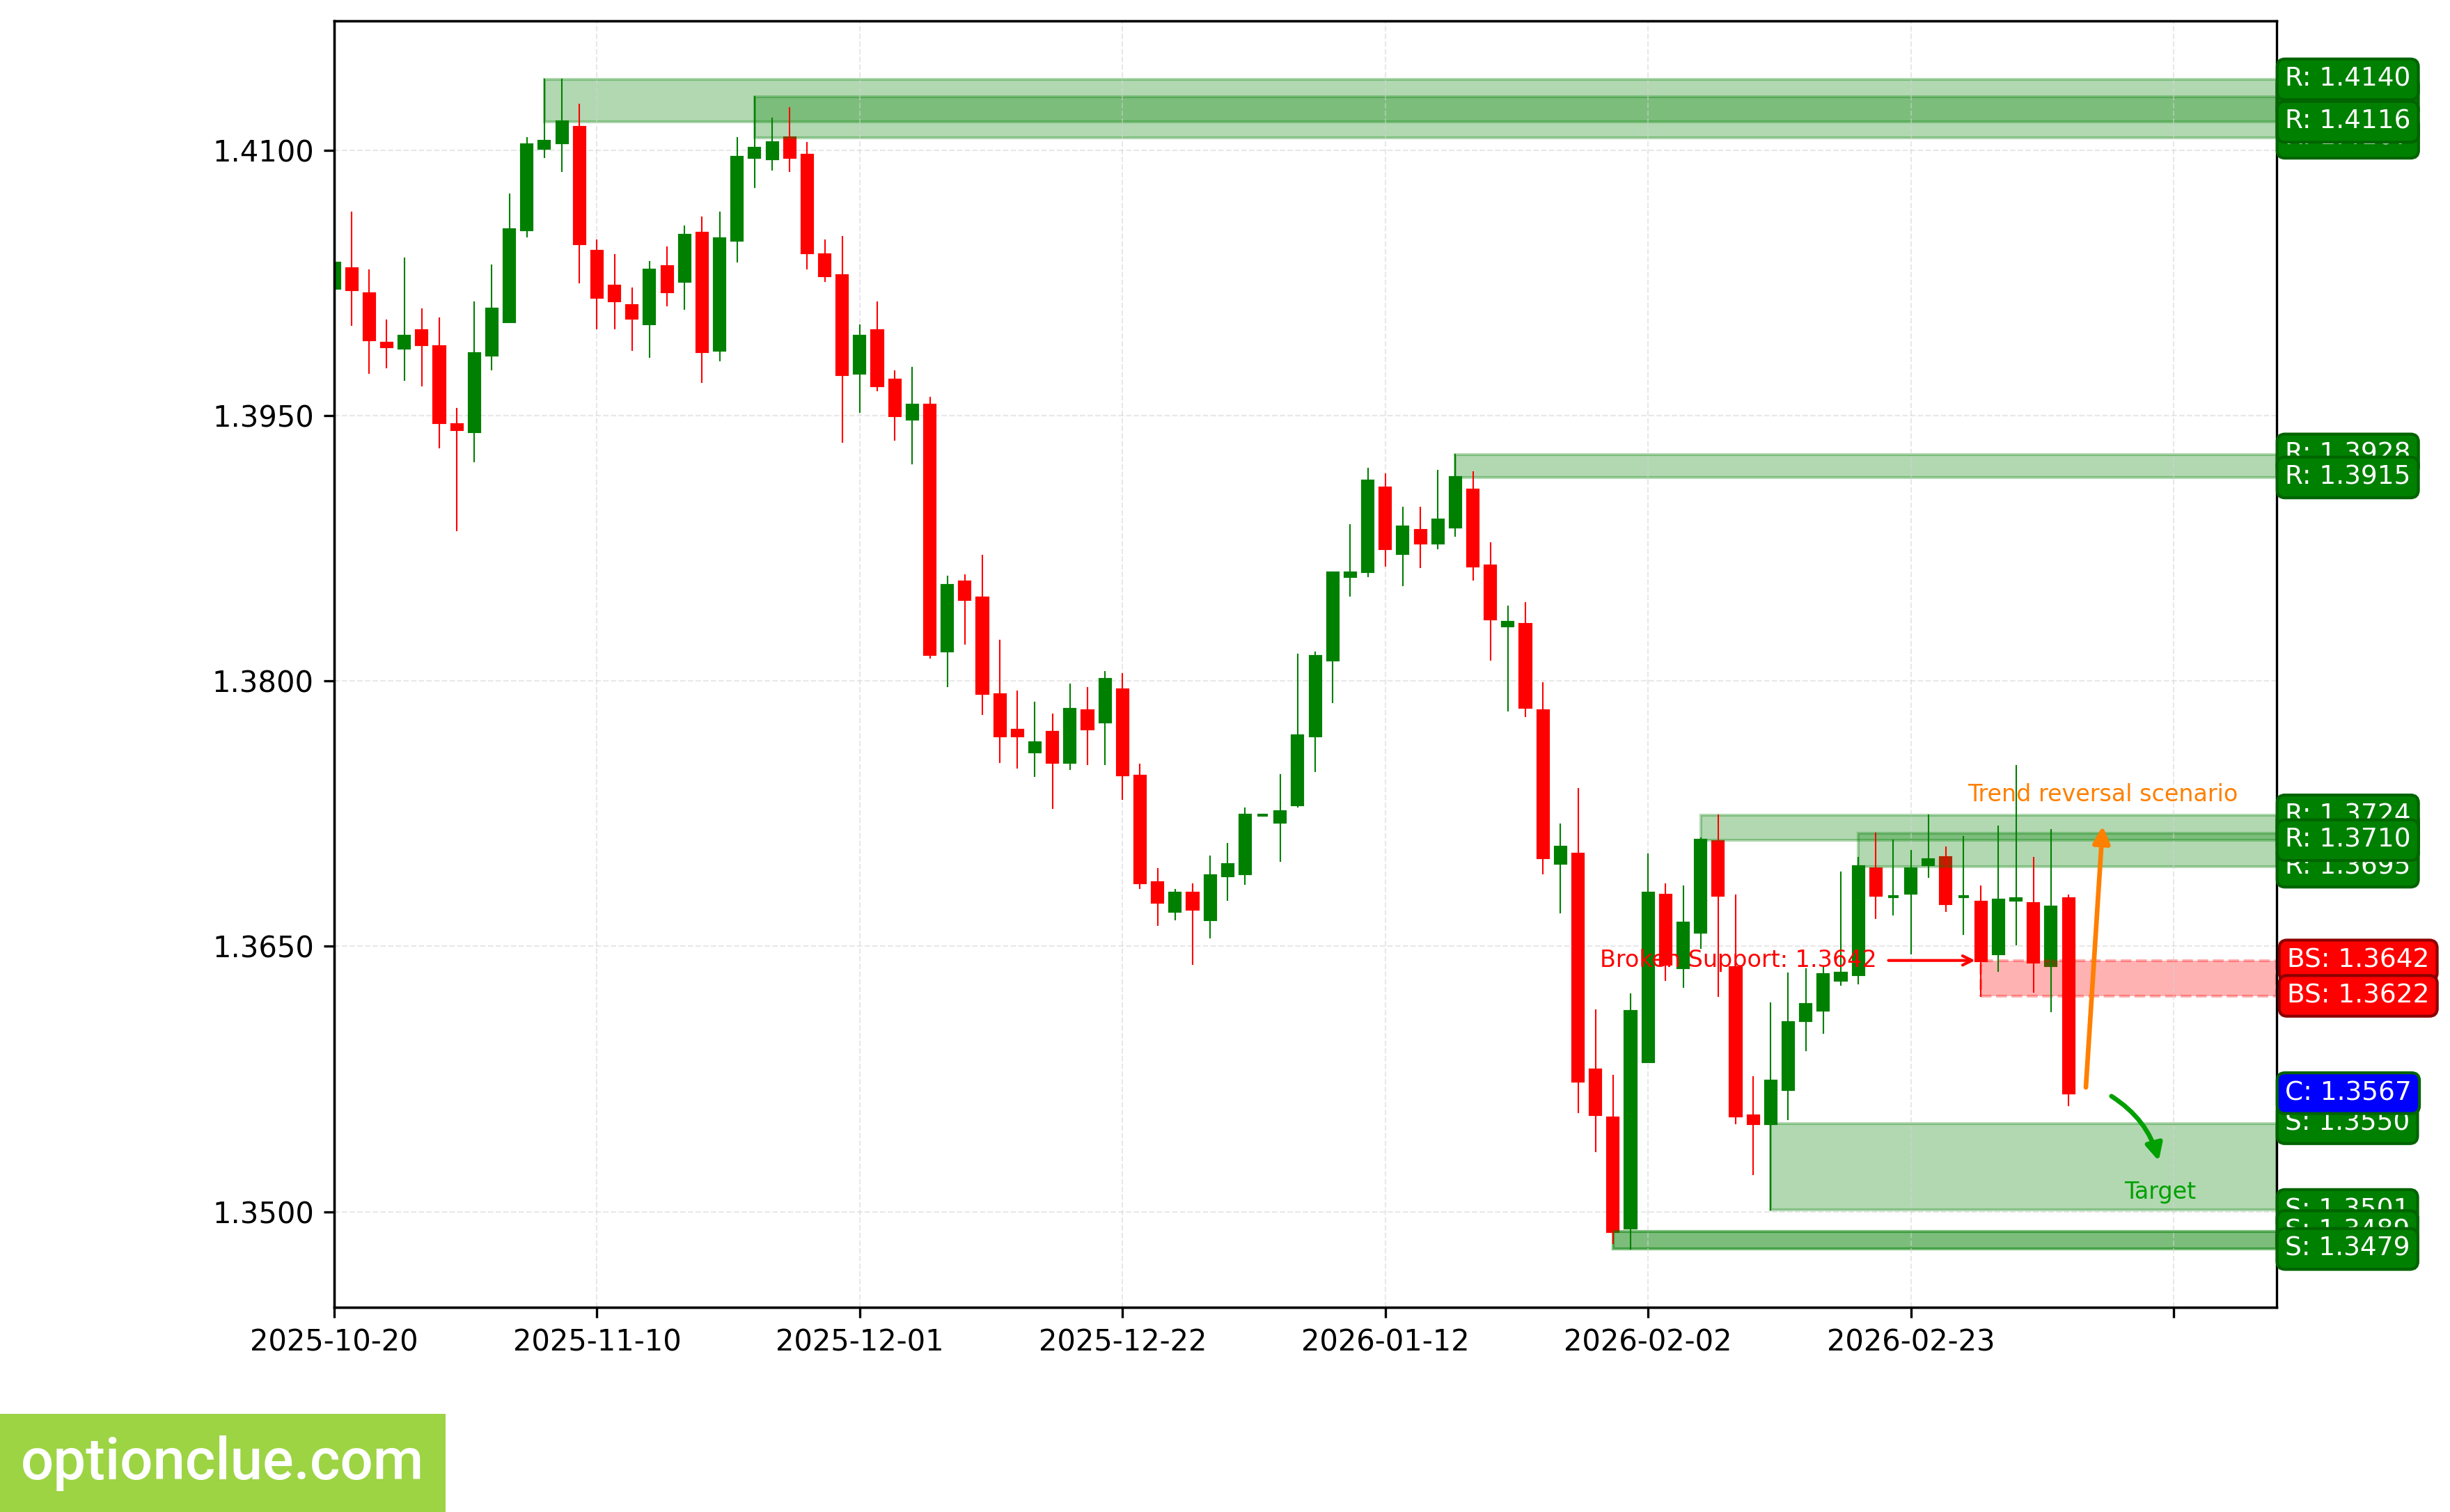
USDCAD. Technical analysis. D1.
Australian Dollar (AUDUSD)
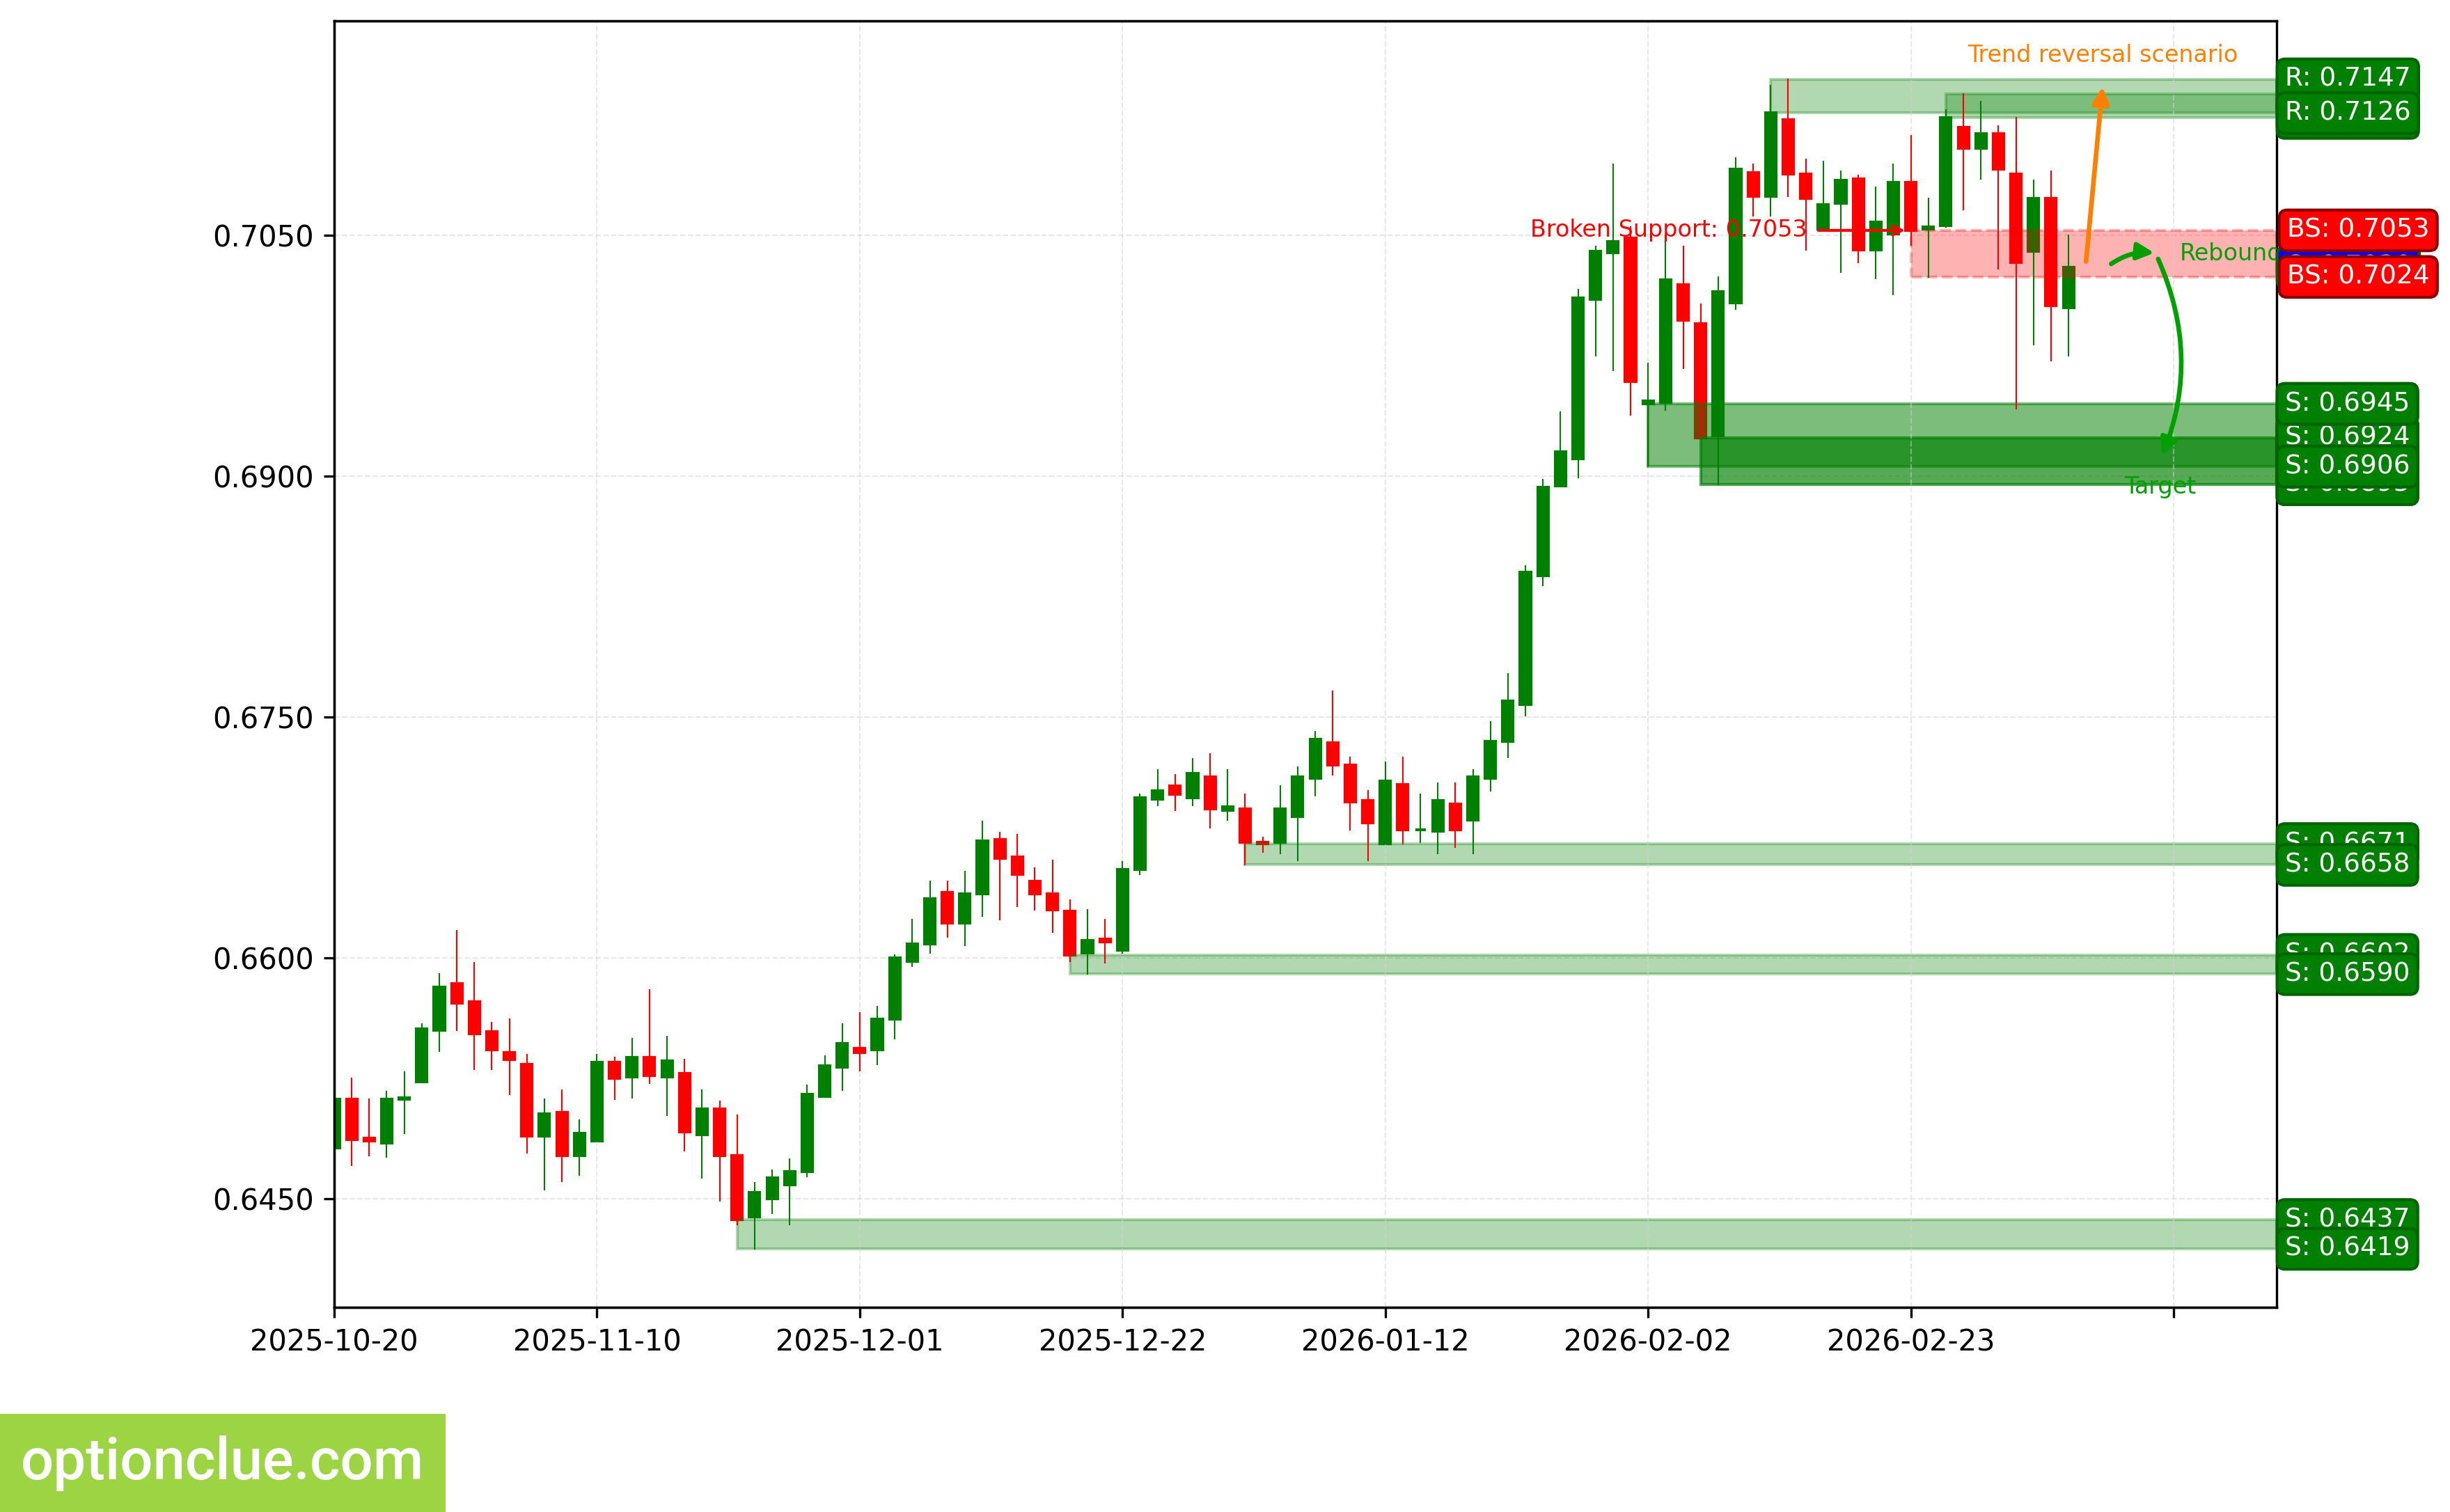
The trend has changed to bearish, when the support level (0.7024 — 0.7053) was broken out 2 candlesticks ago, and price returned to this last broken level. A corrective wave is developing. An entry point for selling on rebound may form after the current correction completes.
The intermediate target for the downward movement is the support level with boundaries 0.6895 — 0.6924. In case of successful trend development, a further target will be at the support level with boundaries 0.6658 — 0.6671.
The potential profit/risk ratio from current prices when setting targets and fixing risks at daily timeframe levels may be small (approximately 0.5:1). When using a further target — approximately 1.8:1. If the correction completes near the resistance level (0.7123 — 0.7138), the potential profit/risk ratio may be approximately 2:1. When selecting a further target — more than 5:1.
Short positions will remain relevant, as long as the market remains below the nearest resistance level with boundaries 0.7123 — 0.7138. If the market successfully closes above this nearest resistance, the trend will change to the opposite (bullish).
AUDUSD. Technical analysis. D1.
Bitcoin (BTC)
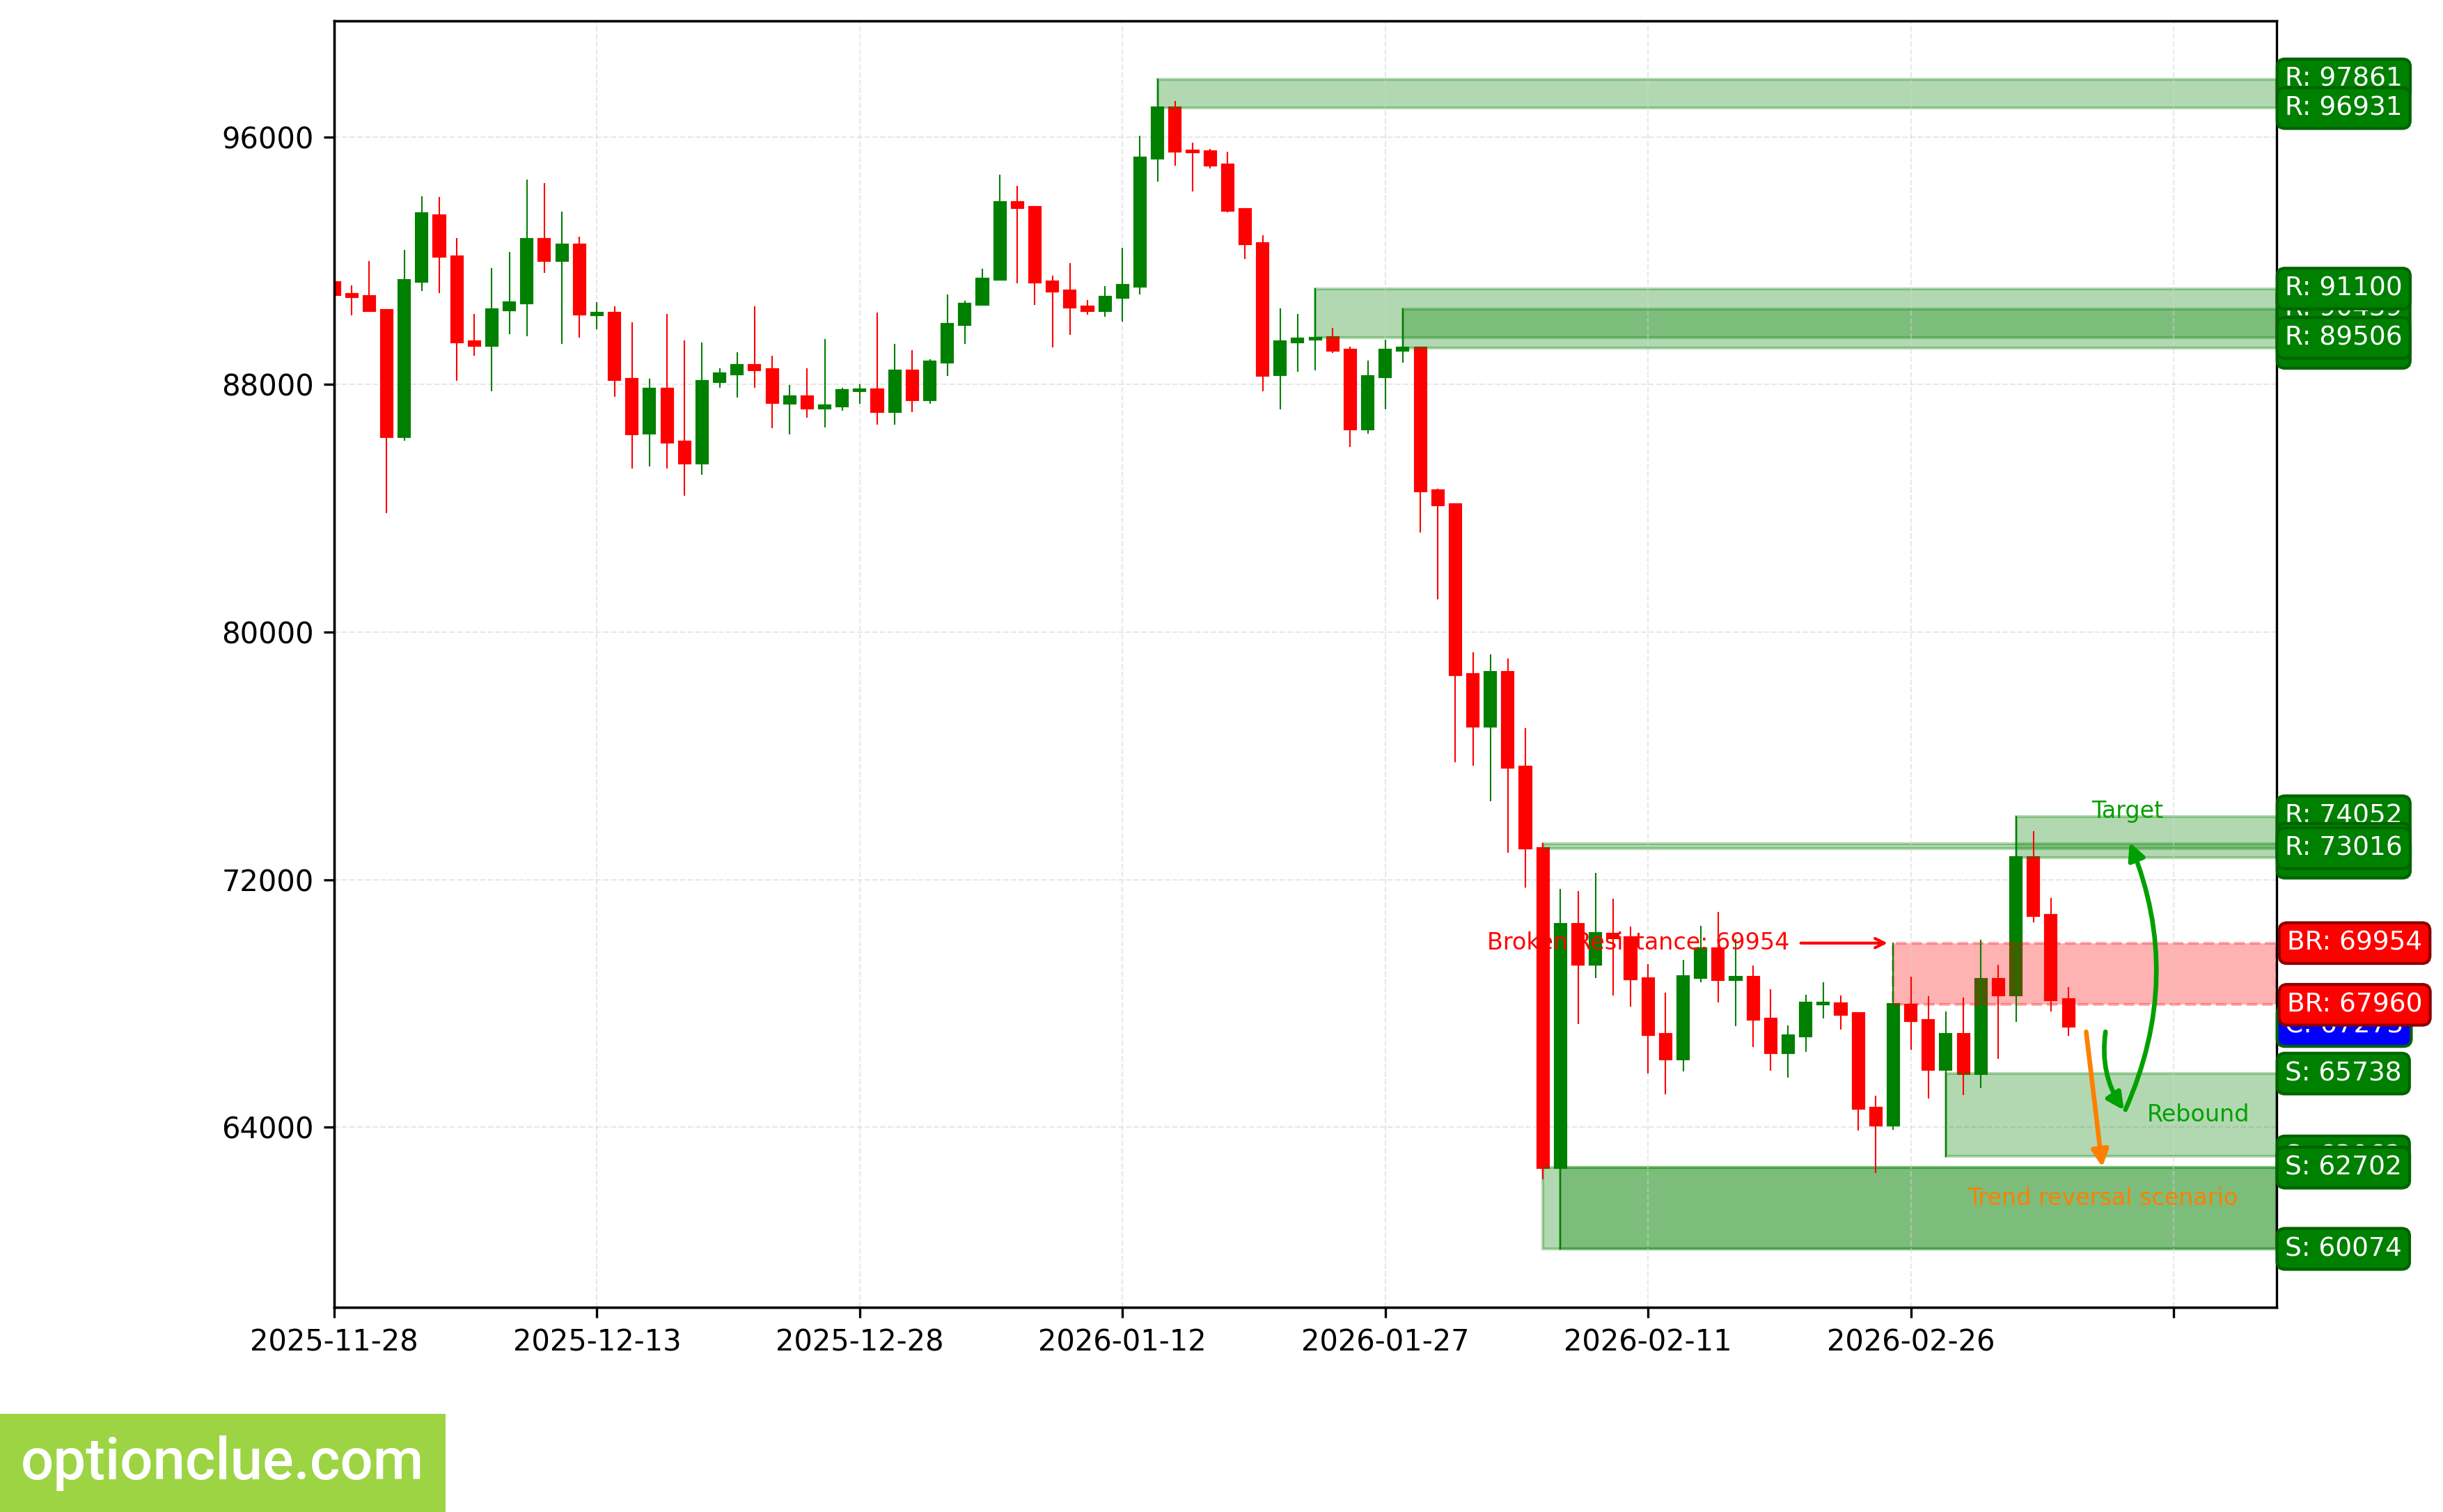
The trend has changed to bullish, when the resistance level (67960 — 69954) was broken out last week. The breakout occurred 4 candlesticks ago. A corrective wave is developing. An entry point for buying on rebound may form after the current correction completes.
The intermediate target for the upward movement is the resistance level with boundaries 72713 — 74052. In case of successful trend development, a further target will be at the resistance level with boundaries 89185 — 90439.
The potential profit/risk ratio from current prices when setting targets and fixing risks at daily timeframe levels may be small (approximately 0.7:1). When using a further target — around 2.8:1. If the correction completes near the support level (63062 — 65738), the potential profit/risk ratio may be approximately 1.7:1. When selecting a further target — more than 5:1. If the correction completes near the last broken level (67960 — 69954), the potential profit/risk ratio may be small (about 0.4:1). For a further target — approximately 2.1:1.
Long positions will remain relevant, as long as the market is above the nearest support level with boundaries 63062 — 65738. If the market successfully closes below this support, the trend will change to the opposite (bearish).
BTC. Technical analysis. D1.
Ether (ETH)
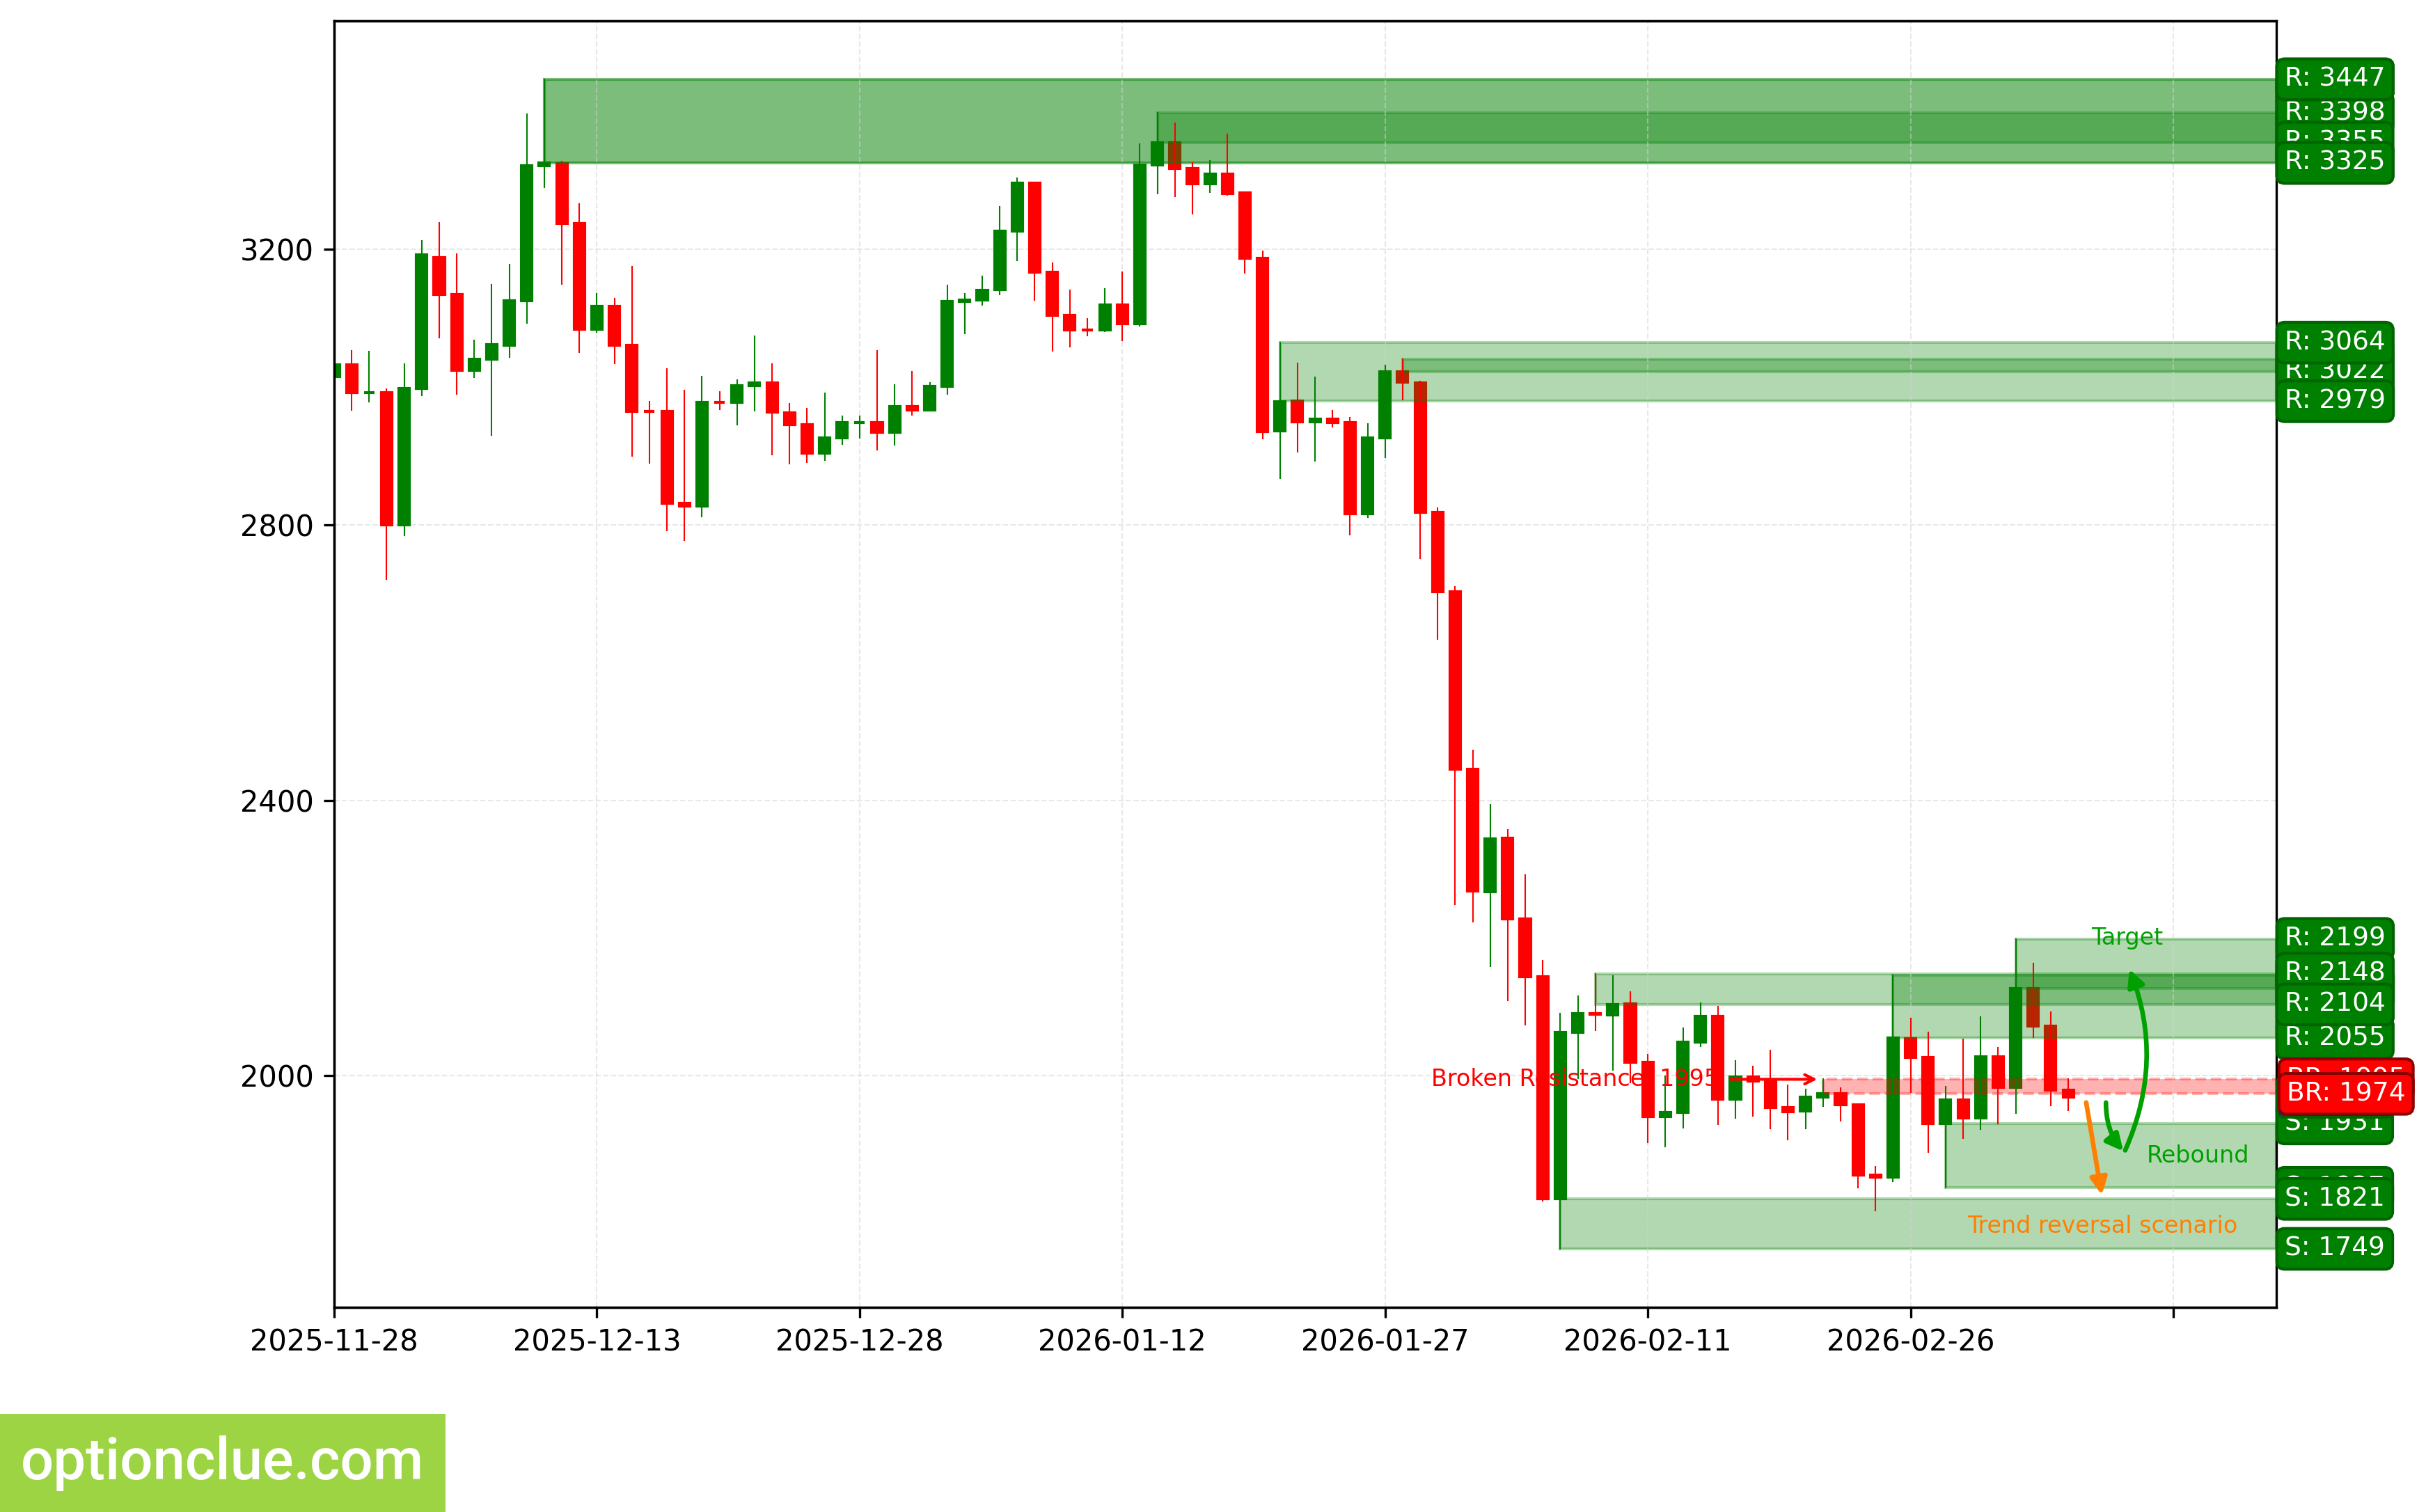
The bullish trend continues, a corrective wave is developing. An entry point for buying on rebound may form after the current correction completes. The last broken level is resistance (1974 — 1995). The breakout occurred 11 candlesticks ago.
The intermediate target for the upward movement is the resistance level with boundaries 2127 — 2199. In case of successful trend development, a further target will be at the resistance level with boundaries 3022 — 3041.
If the correction completes near the support level (1837 — 1931), the potential profit/risk ratio may be approximately 1.3:1. When using a further target — around 6:1.
Long positions will remain relevant, as long as the market is above the nearest support level with boundaries 1837 — 1931. If the market successfully closes below this nearest support, the trend will change to the opposite (bearish).
ETH. Technical analysis. D1.
Apple Inc (AAPL)
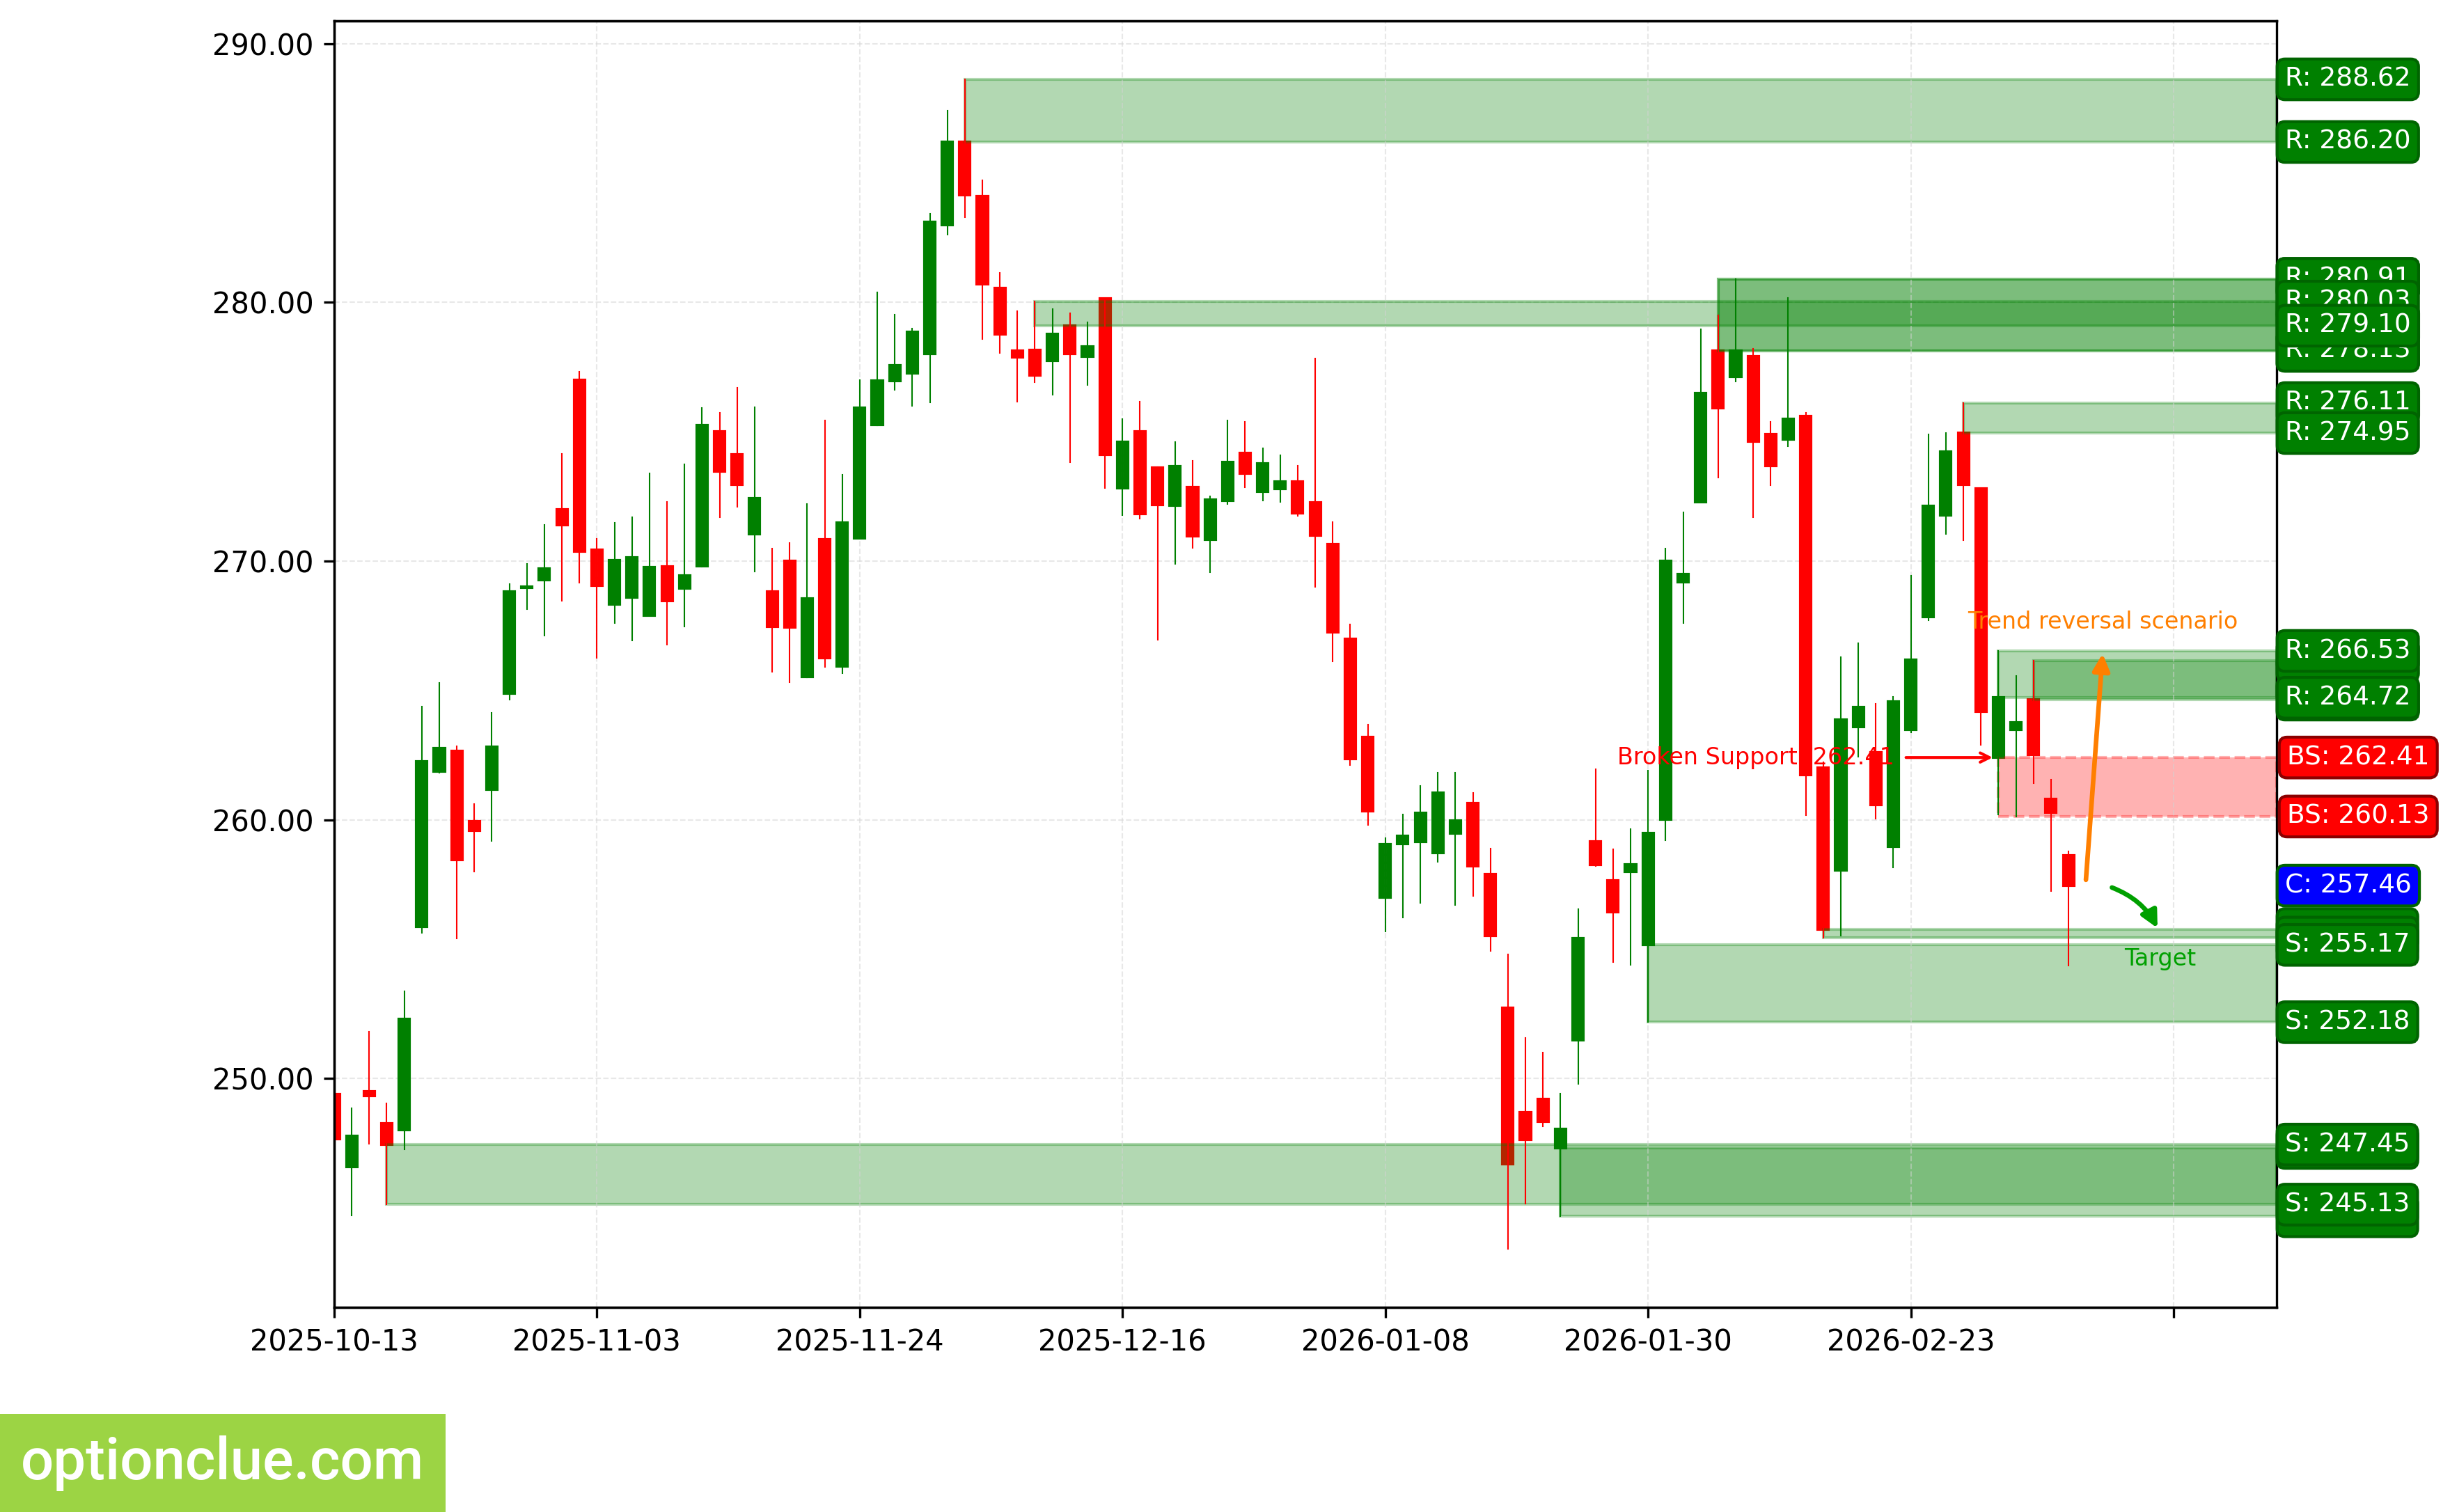
The trend has changed to bearish, when the support level (260.13 — 262.41) was broken out. The breakout occurred on the last closed candlestick. An impulse wave is developing.
The intermediate target for the downward movement is the support level with boundaries 255.45 — 255.78. In case of successful trend development, a further target will be at the support level with boundaries 244.68 — 247.32.
If the new correction completes near the resistance level (264.65 — 266.15), the potential profit/risk ratio may be approximately 1.3:1. When using a further target — around 2.5:1. If the next correction completes near the last broken level (260.13 — 262.41), the potential profit/risk ratio may be small (approximately 0.5:1). When selecting a further target — approximately 1.2:1.
Short positions will remain relevant, as long as the market remains below the nearest resistance level with boundaries 264.65 — 266.15. If the market successfully closes above this nearest resistance, the trend will change to the opposite (bullish).
AAPL. Technical analysis. D1.
NVIDIA Corp (NVDA)
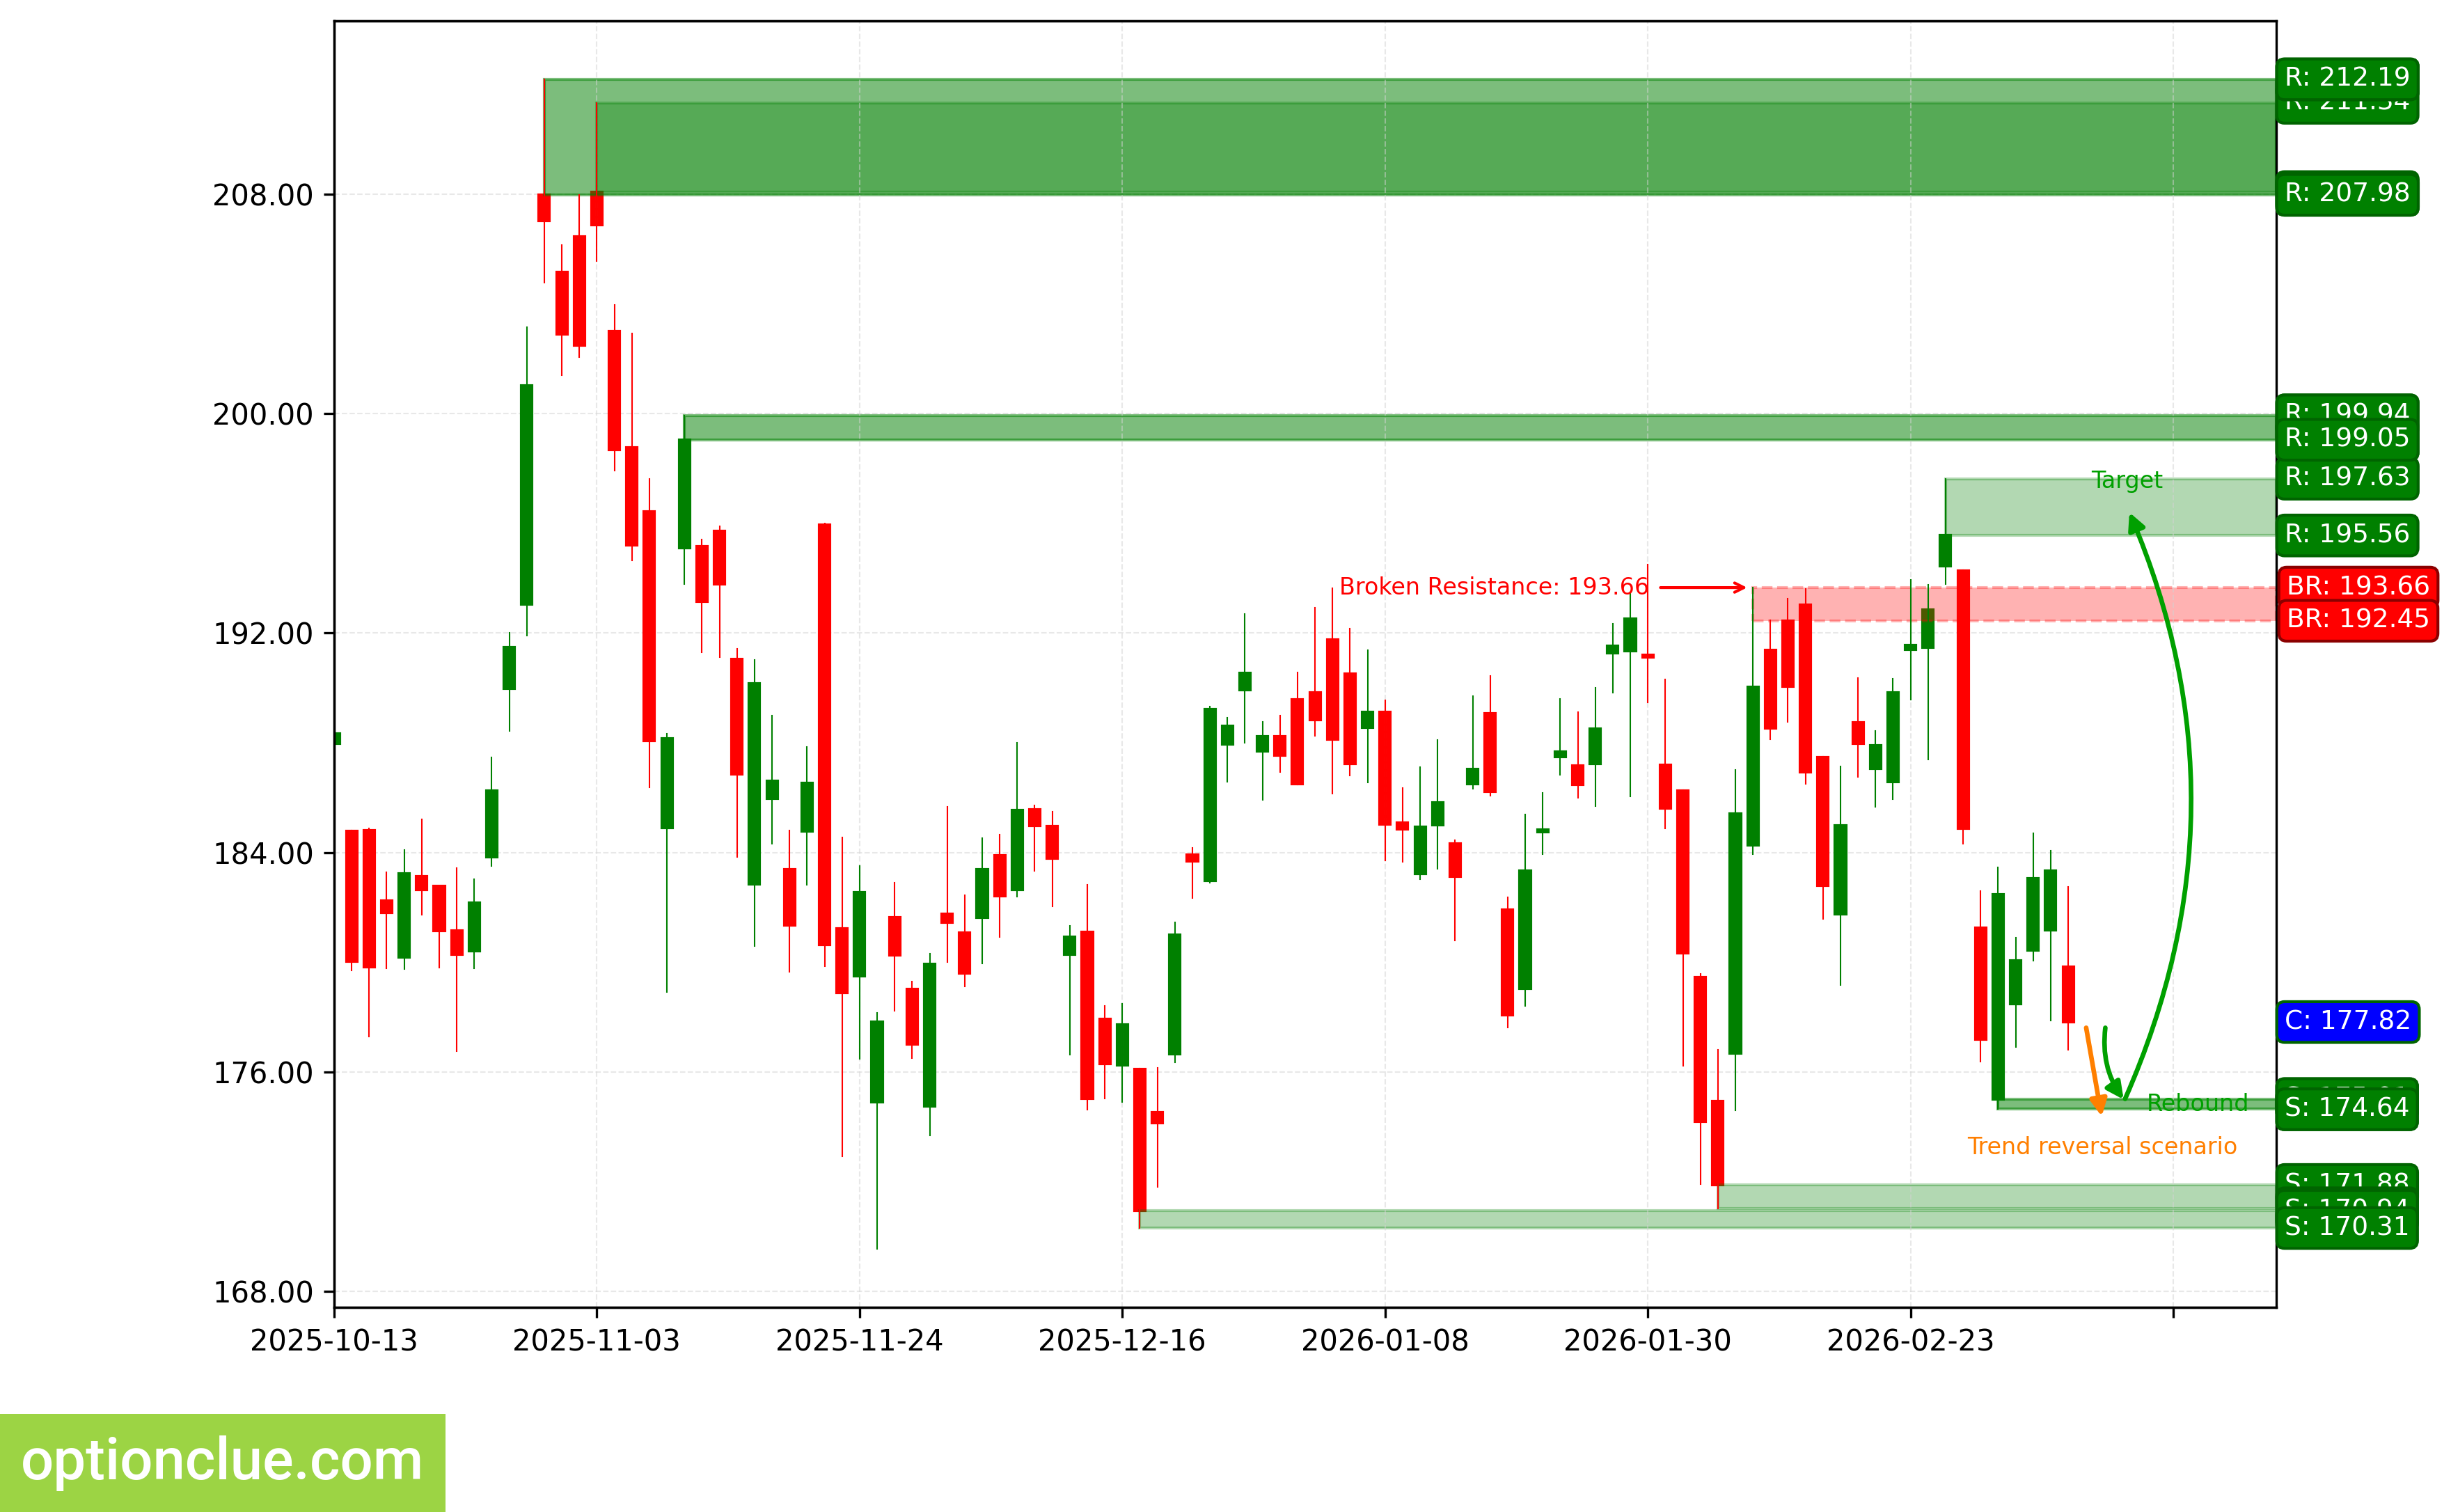
The bullish trend continues, the correction completed 5 candlesticks ago, an impulse wave is developing. The last broken level is resistance (192.45 — 193.66). The breakout occurred 8 candlesticks ago.
The intermediate target for the upward movement is the resistance level with boundaries 195.56 — 197.63. In case of successful trend development, a further target will be at the resistance level with boundaries 208.08 — 211.34.
The potential profit/risk ratio from current prices when setting targets and fixing risks at daily timeframe levels may be approximately 1.8:1. When using a further target — around 3:1.
Long positions will remain relevant, as long as the market is above the nearest support level with boundaries 174.64 — 175.01. If the market successfully closes below this support, the trend will change to the opposite (bearish).
NVDA. Technical analysis. D1.
Tesla Inc (TSLA)
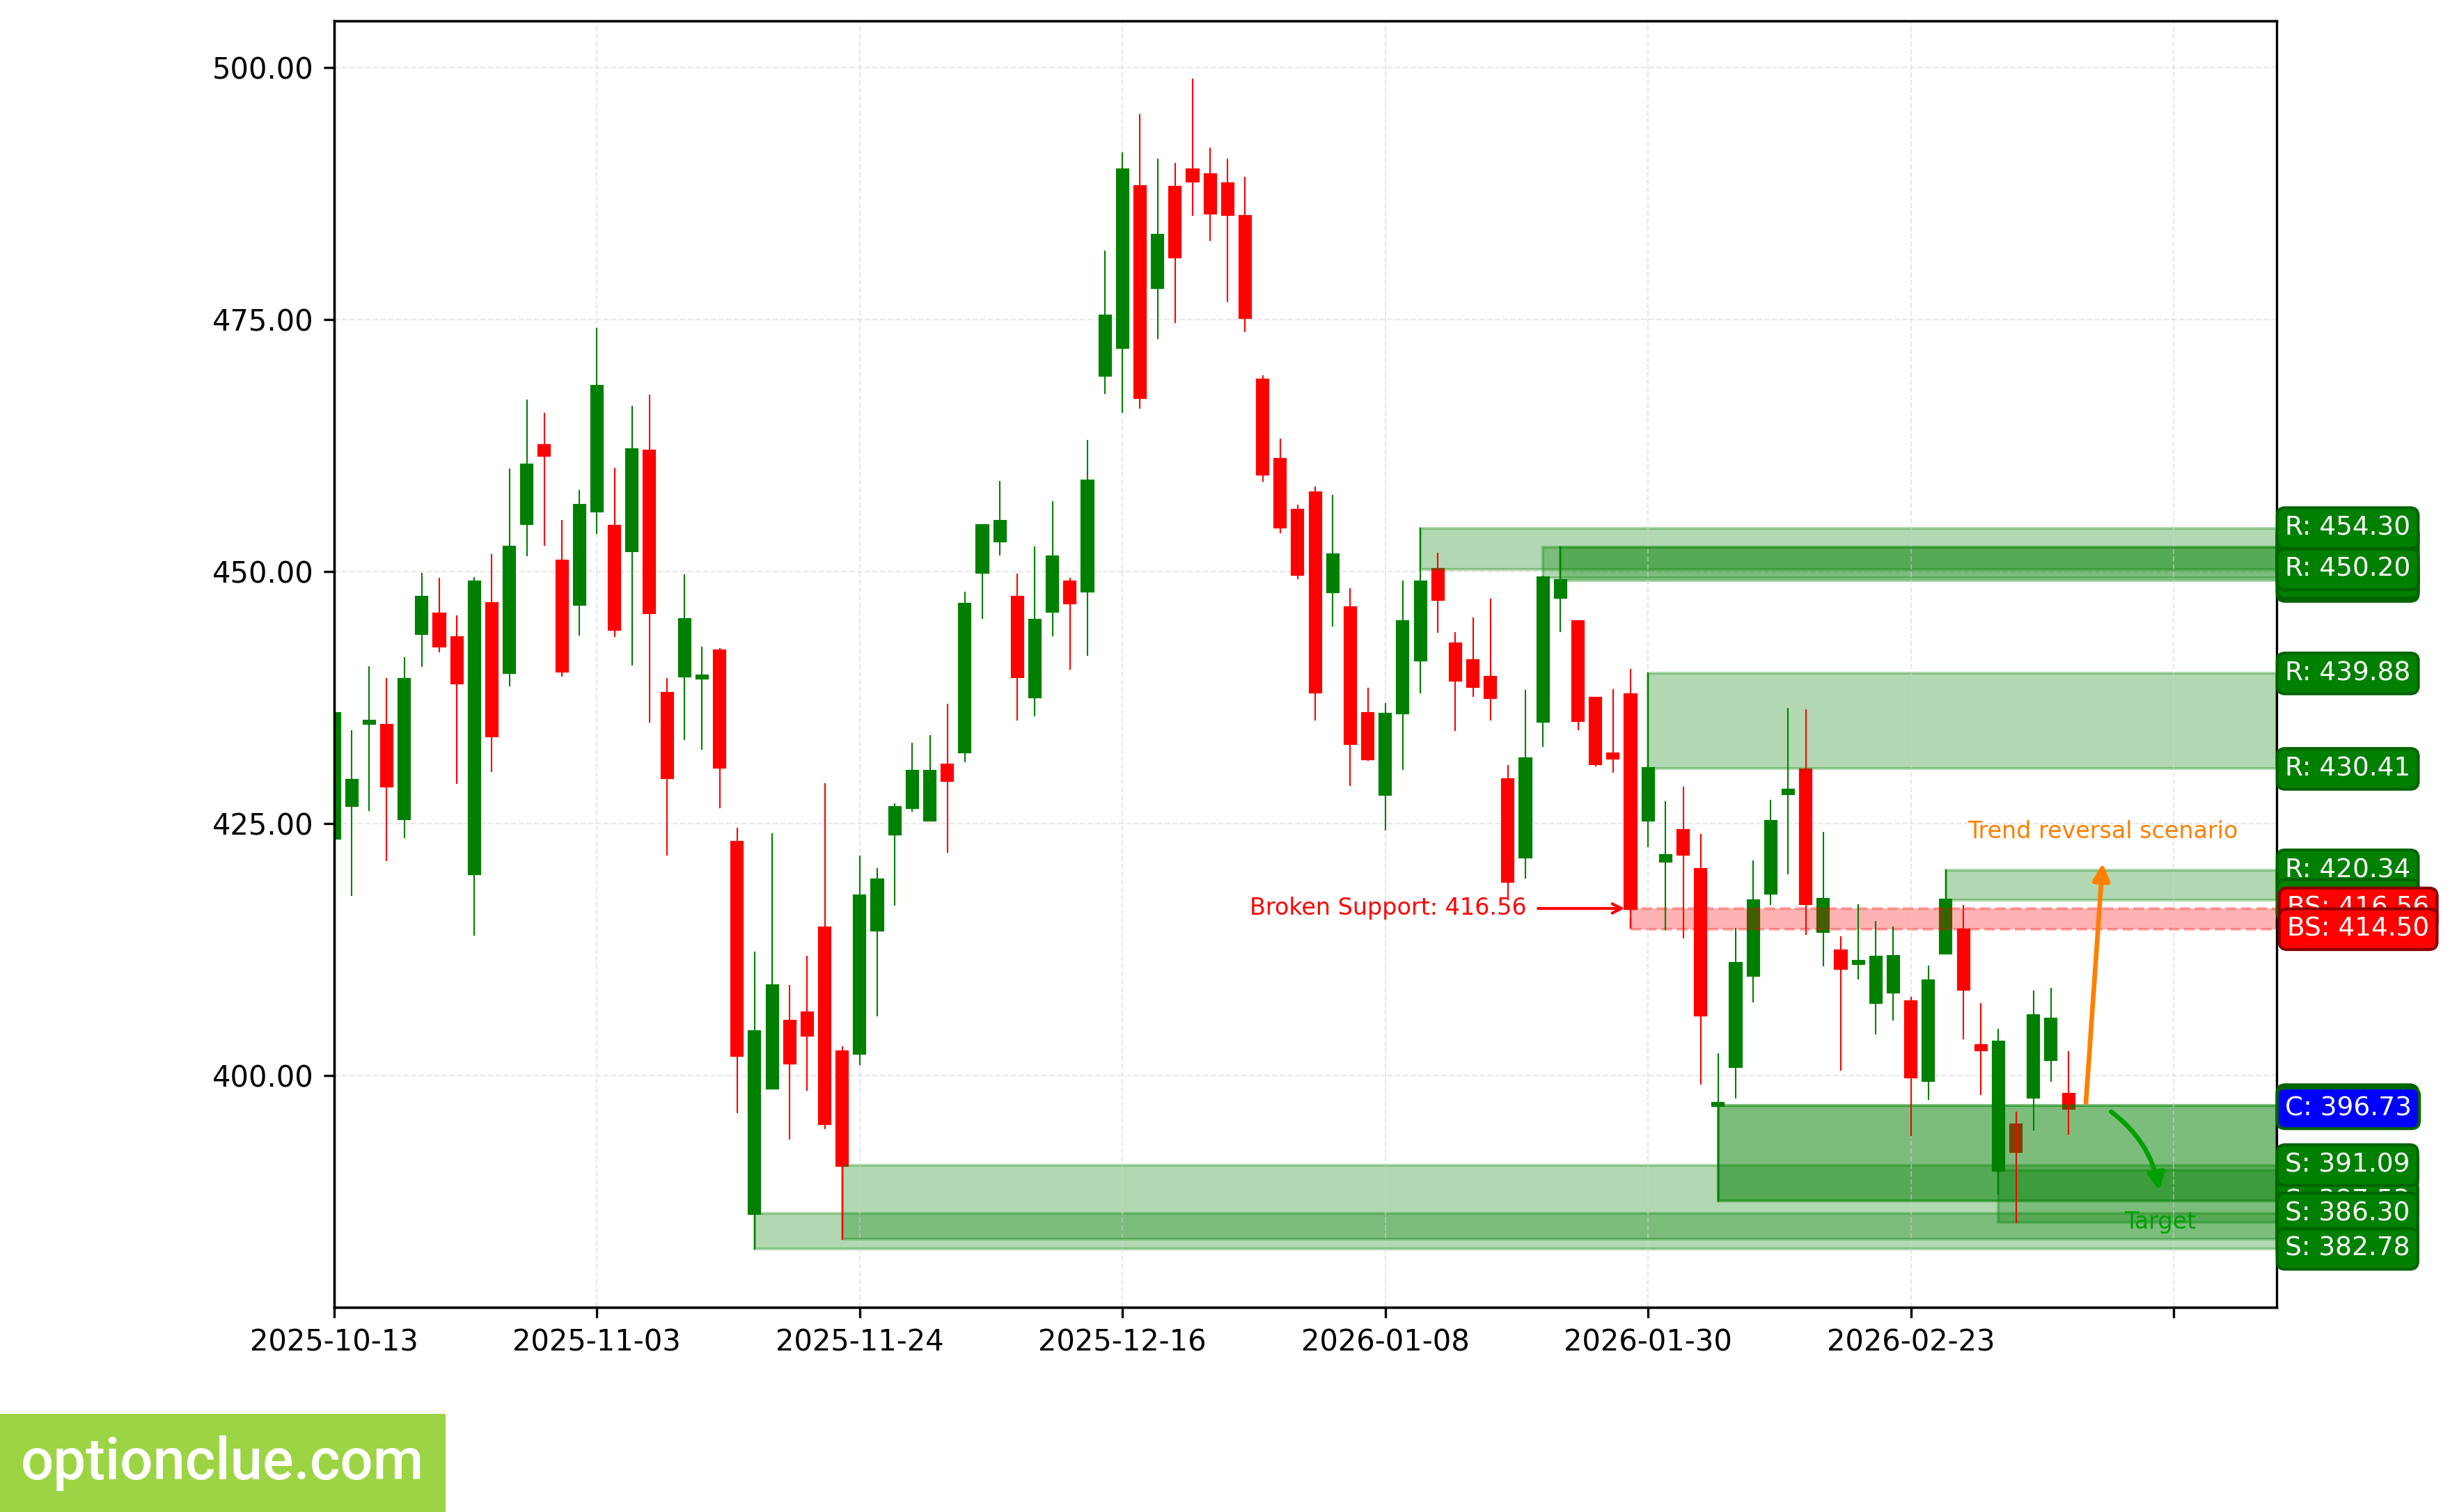
The bearish trend continues, a corrective wave is developing again. An entry point for selling on rebound may appear after the current correction completes. The last broken level is support (414.50 — 416.56). The breakout occurred 22 candlesticks ago.
The intermediate target for the downward movement is the support level with boundaries 385.39 — 390.60. In case of successful trend development, a further target will be at the support level with boundaries 346.07 — 347.79.
If the new correction completes near the resistance level (417.40 — 420.34), the potential profit/risk ratio may be approximately 1.9:1. When using a further target — around 4.8:1. If the correction completes near the last broken level (414.50 — 416.56), the potential profit/risk ratio may be around 1.4:1. When selecting a further target — more than 3:1.
Short positions will remain relevant, as long as the market remains below the nearest resistance level with boundaries 417.40 — 420.34. If the market successfully closes above this nearest resistance, the trend will change to the opposite (bullish).
TSLA. Technical analysis. D1.
Summary
From the perspective of medium-term trading, financial instruments with correction nearing completion on Daily and/or potentially the most favorable profit-to-risk ratios include: GBPUSD, BTC, ETH. In the near future, they may deserve attention depending on the depth of market correction: EURUSD, USDCAD.
The remaining financial instruments on the trading list may also be of interest, but on these markets, Daily bounce signals will likely appear no earlier than in a week.