If you need to quickly understand what’s happening in the markets, this overview is for you. We highlight key levels and briefly review possible scenarios for event development.
Key Topics
- Euro (EURUSD)
- British Pound (GBPUSD)
- Japanese Yen (USDJPY)
- Canadian Dollar (USDCAD)
- Australian Dollar (AUDUSD)
- Bitcoin (BTC)
- Ether (ETH)
- Apple Inc (AAPL)
- NVIDIA Corp (NVDA)
- Tesla Inc (TSLA)
- Summary
Euro (EURUSD)
The trend has changed to bullish, when the resistance level (1.1630 — 1.1656) was broken. The breakout occurred 3 candlesticks ago, and the price has returned to this last broken level. A corrective wave is developing. An entry point for buying on rebound may form after the completion of the current correction.
The intermediate target for the upward movement is the resistance level with boundaries 1.1666 — 1.1682. In case of successful trend development, a further target will be at the resistance level with boundaries 1.1735 — 1.1779.
The potential profit/risk ratio from current prices when setting targets and fixing risks based on daily timeframe levels may be small 0.1:1. When assessing a further target — 0.4:1. If the correction completes in the area of the support level (1.1491 — 1.1513), the potential profit/risk ratio (based on risk zone/targets) may be approximately 2:1. When selecting a further target — 3:1.
Long positions will remain relevant, as long as the market is above the nearest support level with boundaries 1.1491 — 1.1513. If the market successfully settles below this support, the trend will change to the opposite (bearish).
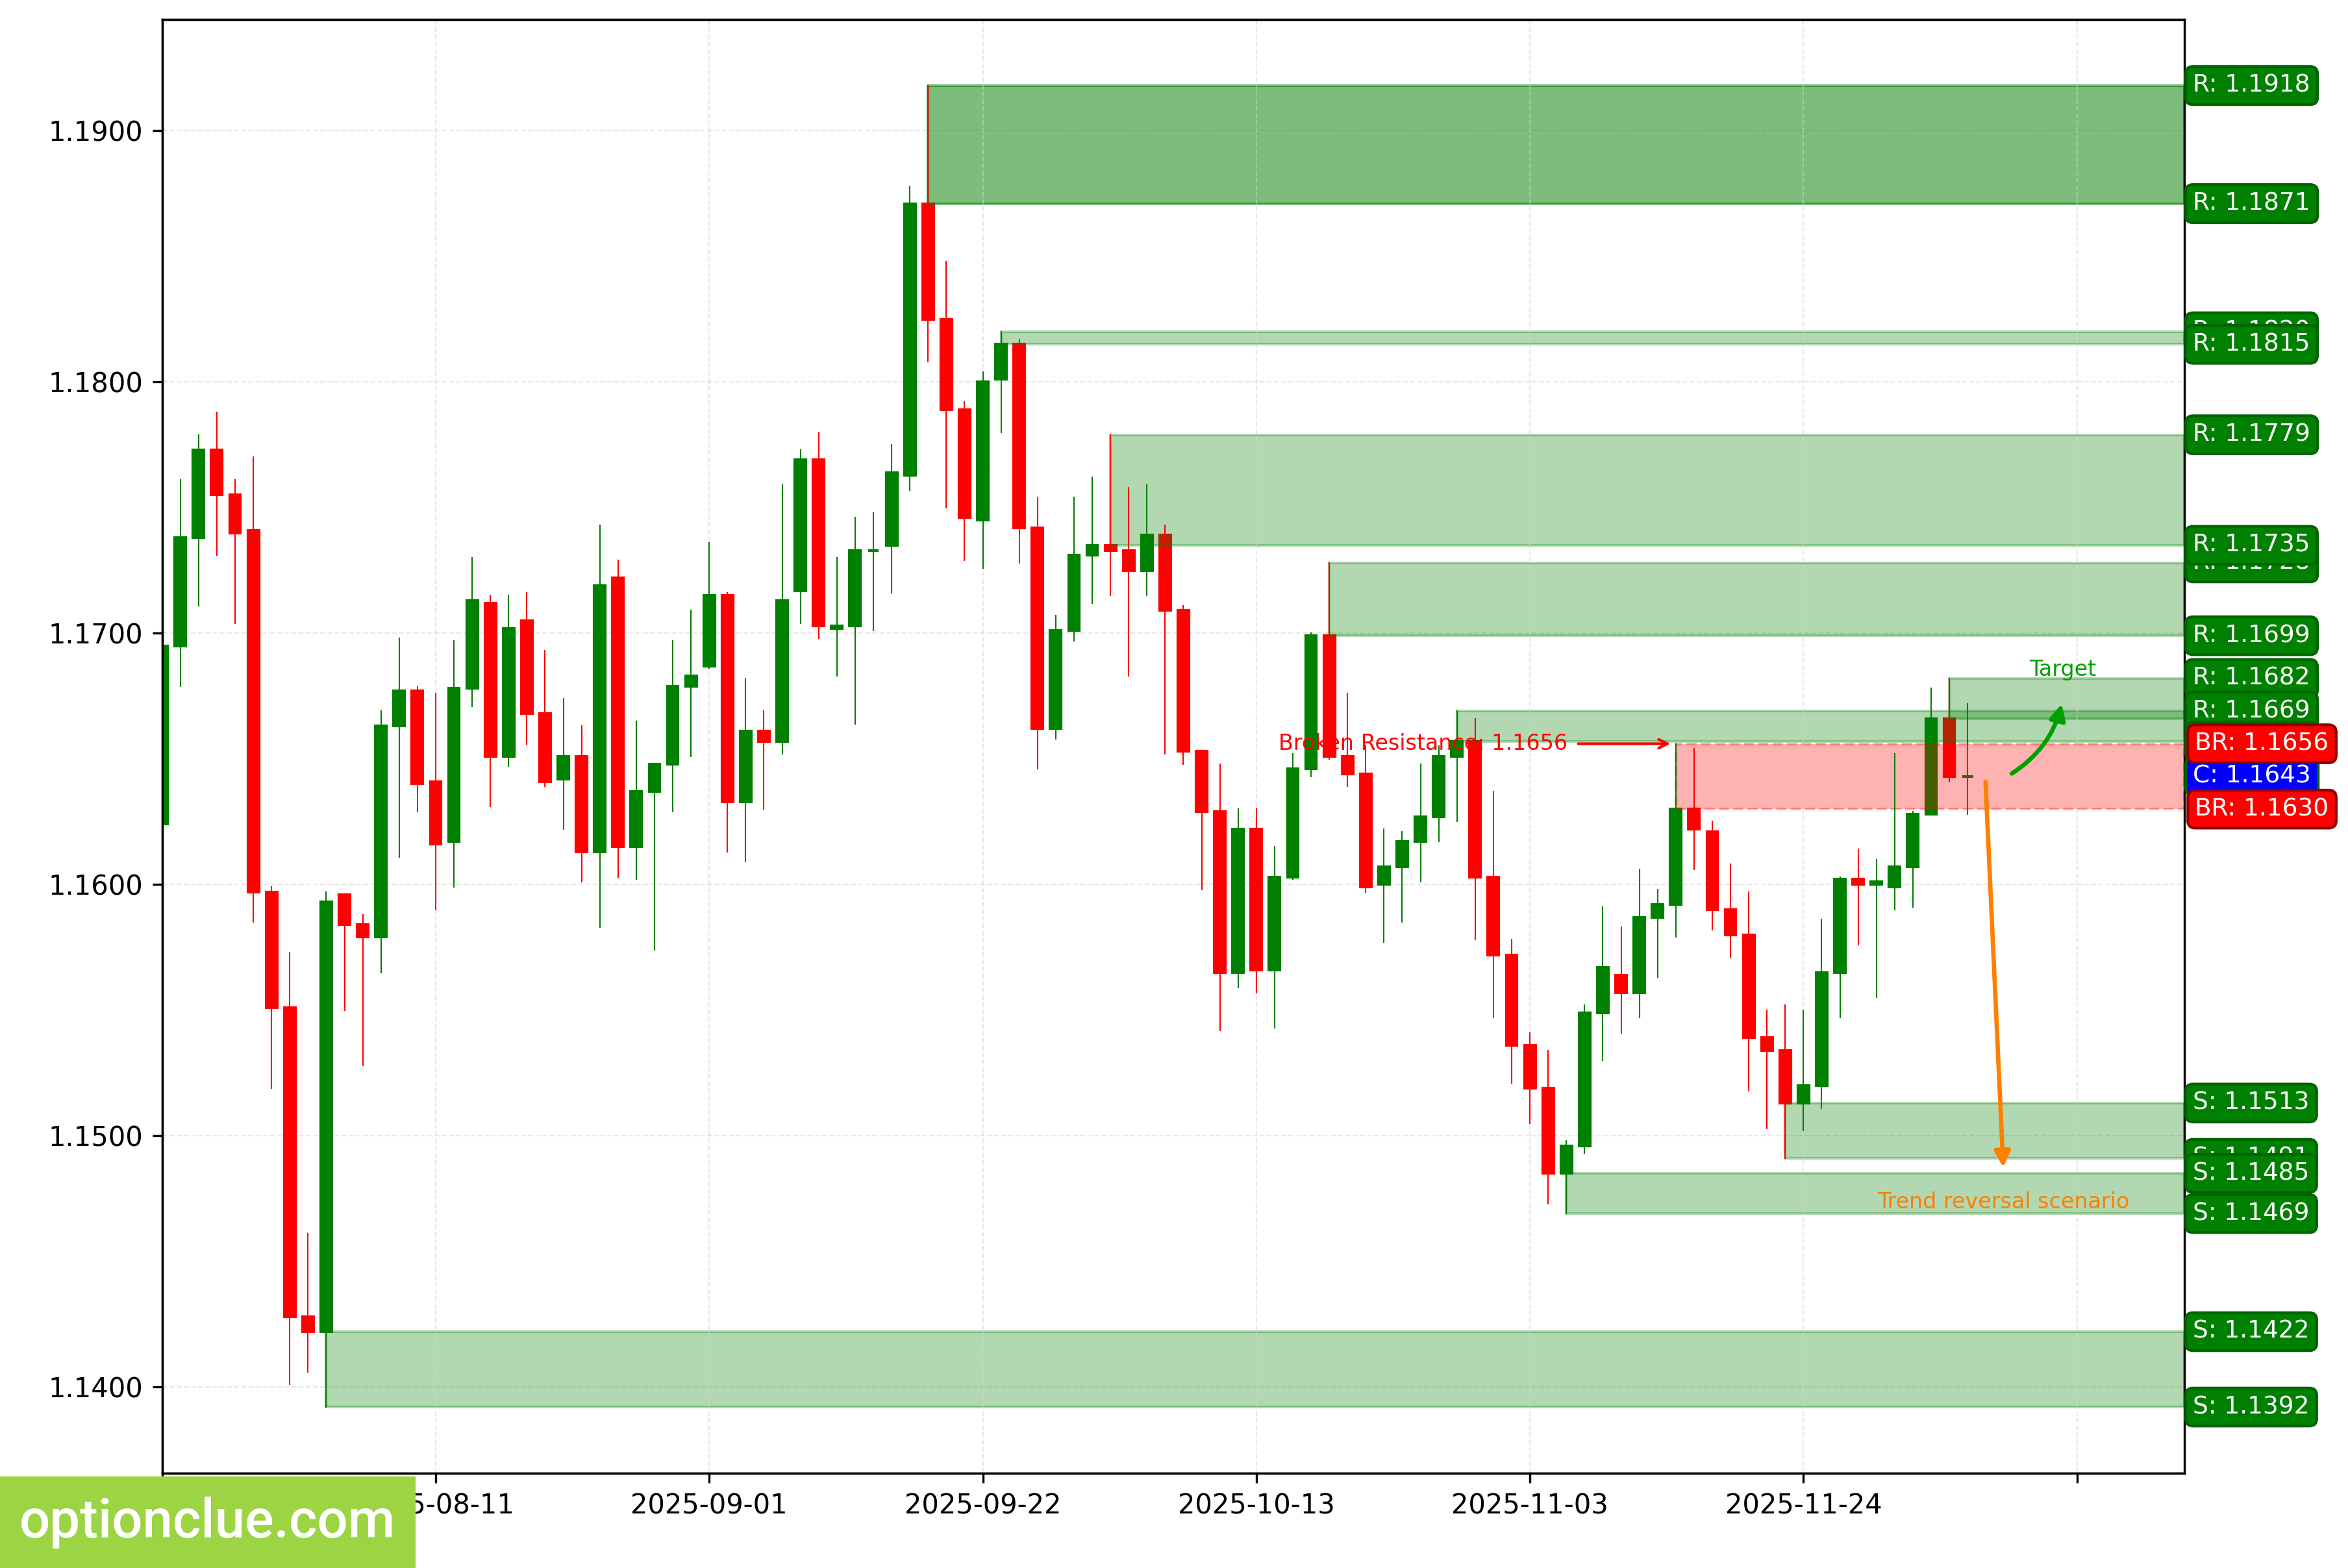
EURUSD. Technical analysis. D1.
British Pound (GBPUSD)
The bullish trend continues, 4 candlesticks ago the correction completed and an entry point for buying on rebound formed, an impulse wave is developing.
The intermediate target for the upward movement is the resistance level with boundaries 1.3444 — 1.3471. In case of successful trend development, a further target will be at the resistance level with boundaries 1.3524 — 1.3537.
The potential profit/risk ratio from current prices when setting targets and fixing risks based on daily timeframe levels may be small 0.5:1. When using a further target — approximately 1:1. If the next correction completes in the area of the support level (1.3176 — 1.3211), the potential profit/risk ratio (based on risk zone/targets) may be around 2:1. For a further target — 3:1.
Long positions will remain relevant, as long as the market is above the nearest support level with boundaries 1.3176 — 1.3211. If the market successfully settles below this nearest support, the trend will change to the opposite (bearish).
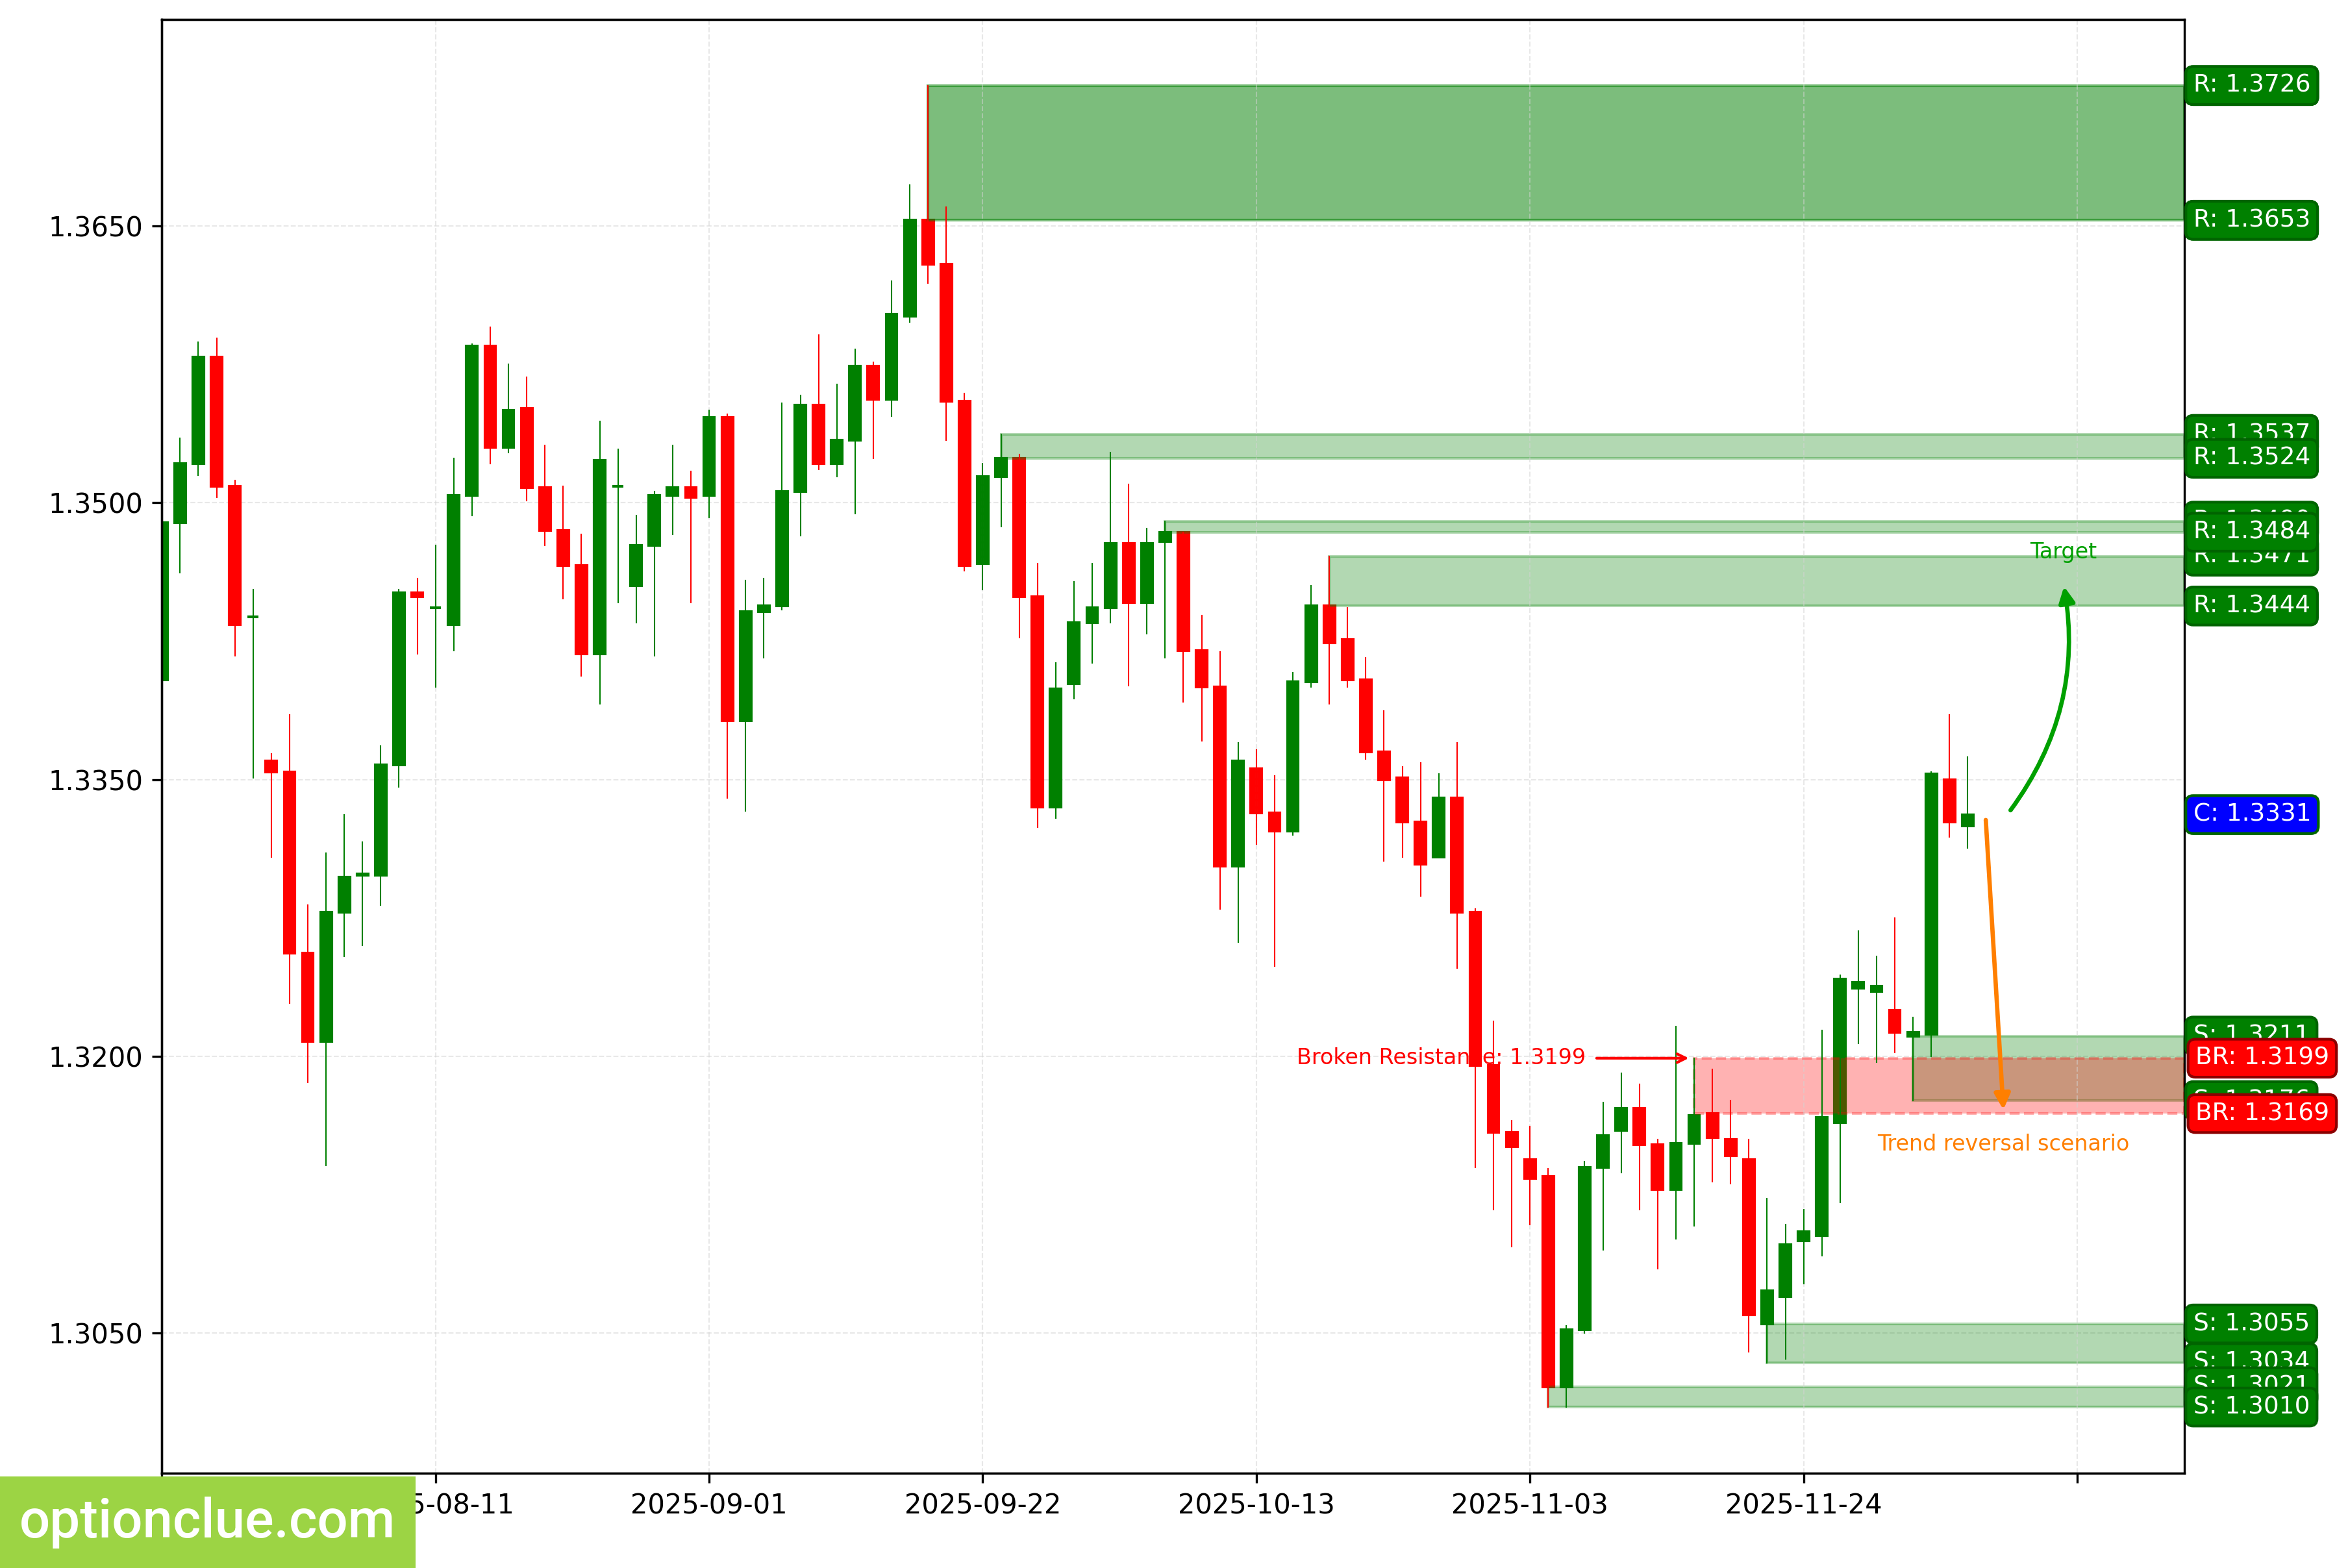
GBPUSD. Technical analysis. D1.
Japanese Yen (USDJPY)
The bearish trend continues, a corrective wave is developing. An entry point for selling on rebound may form after the completion of the current correction. The last broken level is support (155.65 — 156.20). The breakout occurred 3 candlesticks ago.
The intermediate target for the downward movement is the support level with boundaries 154.35 — 155.12. In case of successful trend development, a further target will be at the support level with boundaries 152.82 — 152.95.
The potential profit/risk ratio from current prices when setting targets and fixing risks based on daily timeframe levels may be small 0.1:1. When selecting a further target — 0.5:1. If the correction completes in the area of the last broken level (155.65 — 156.20), the potential profit/risk ratio may be insignificant (0.2:1).
Short positions will remain relevant, as long as the market remains below the nearest resistance level with boundaries 158.23 — 158.55. If the market successfully settles above this nearest resistance, the trend will change to the opposite (bullish).
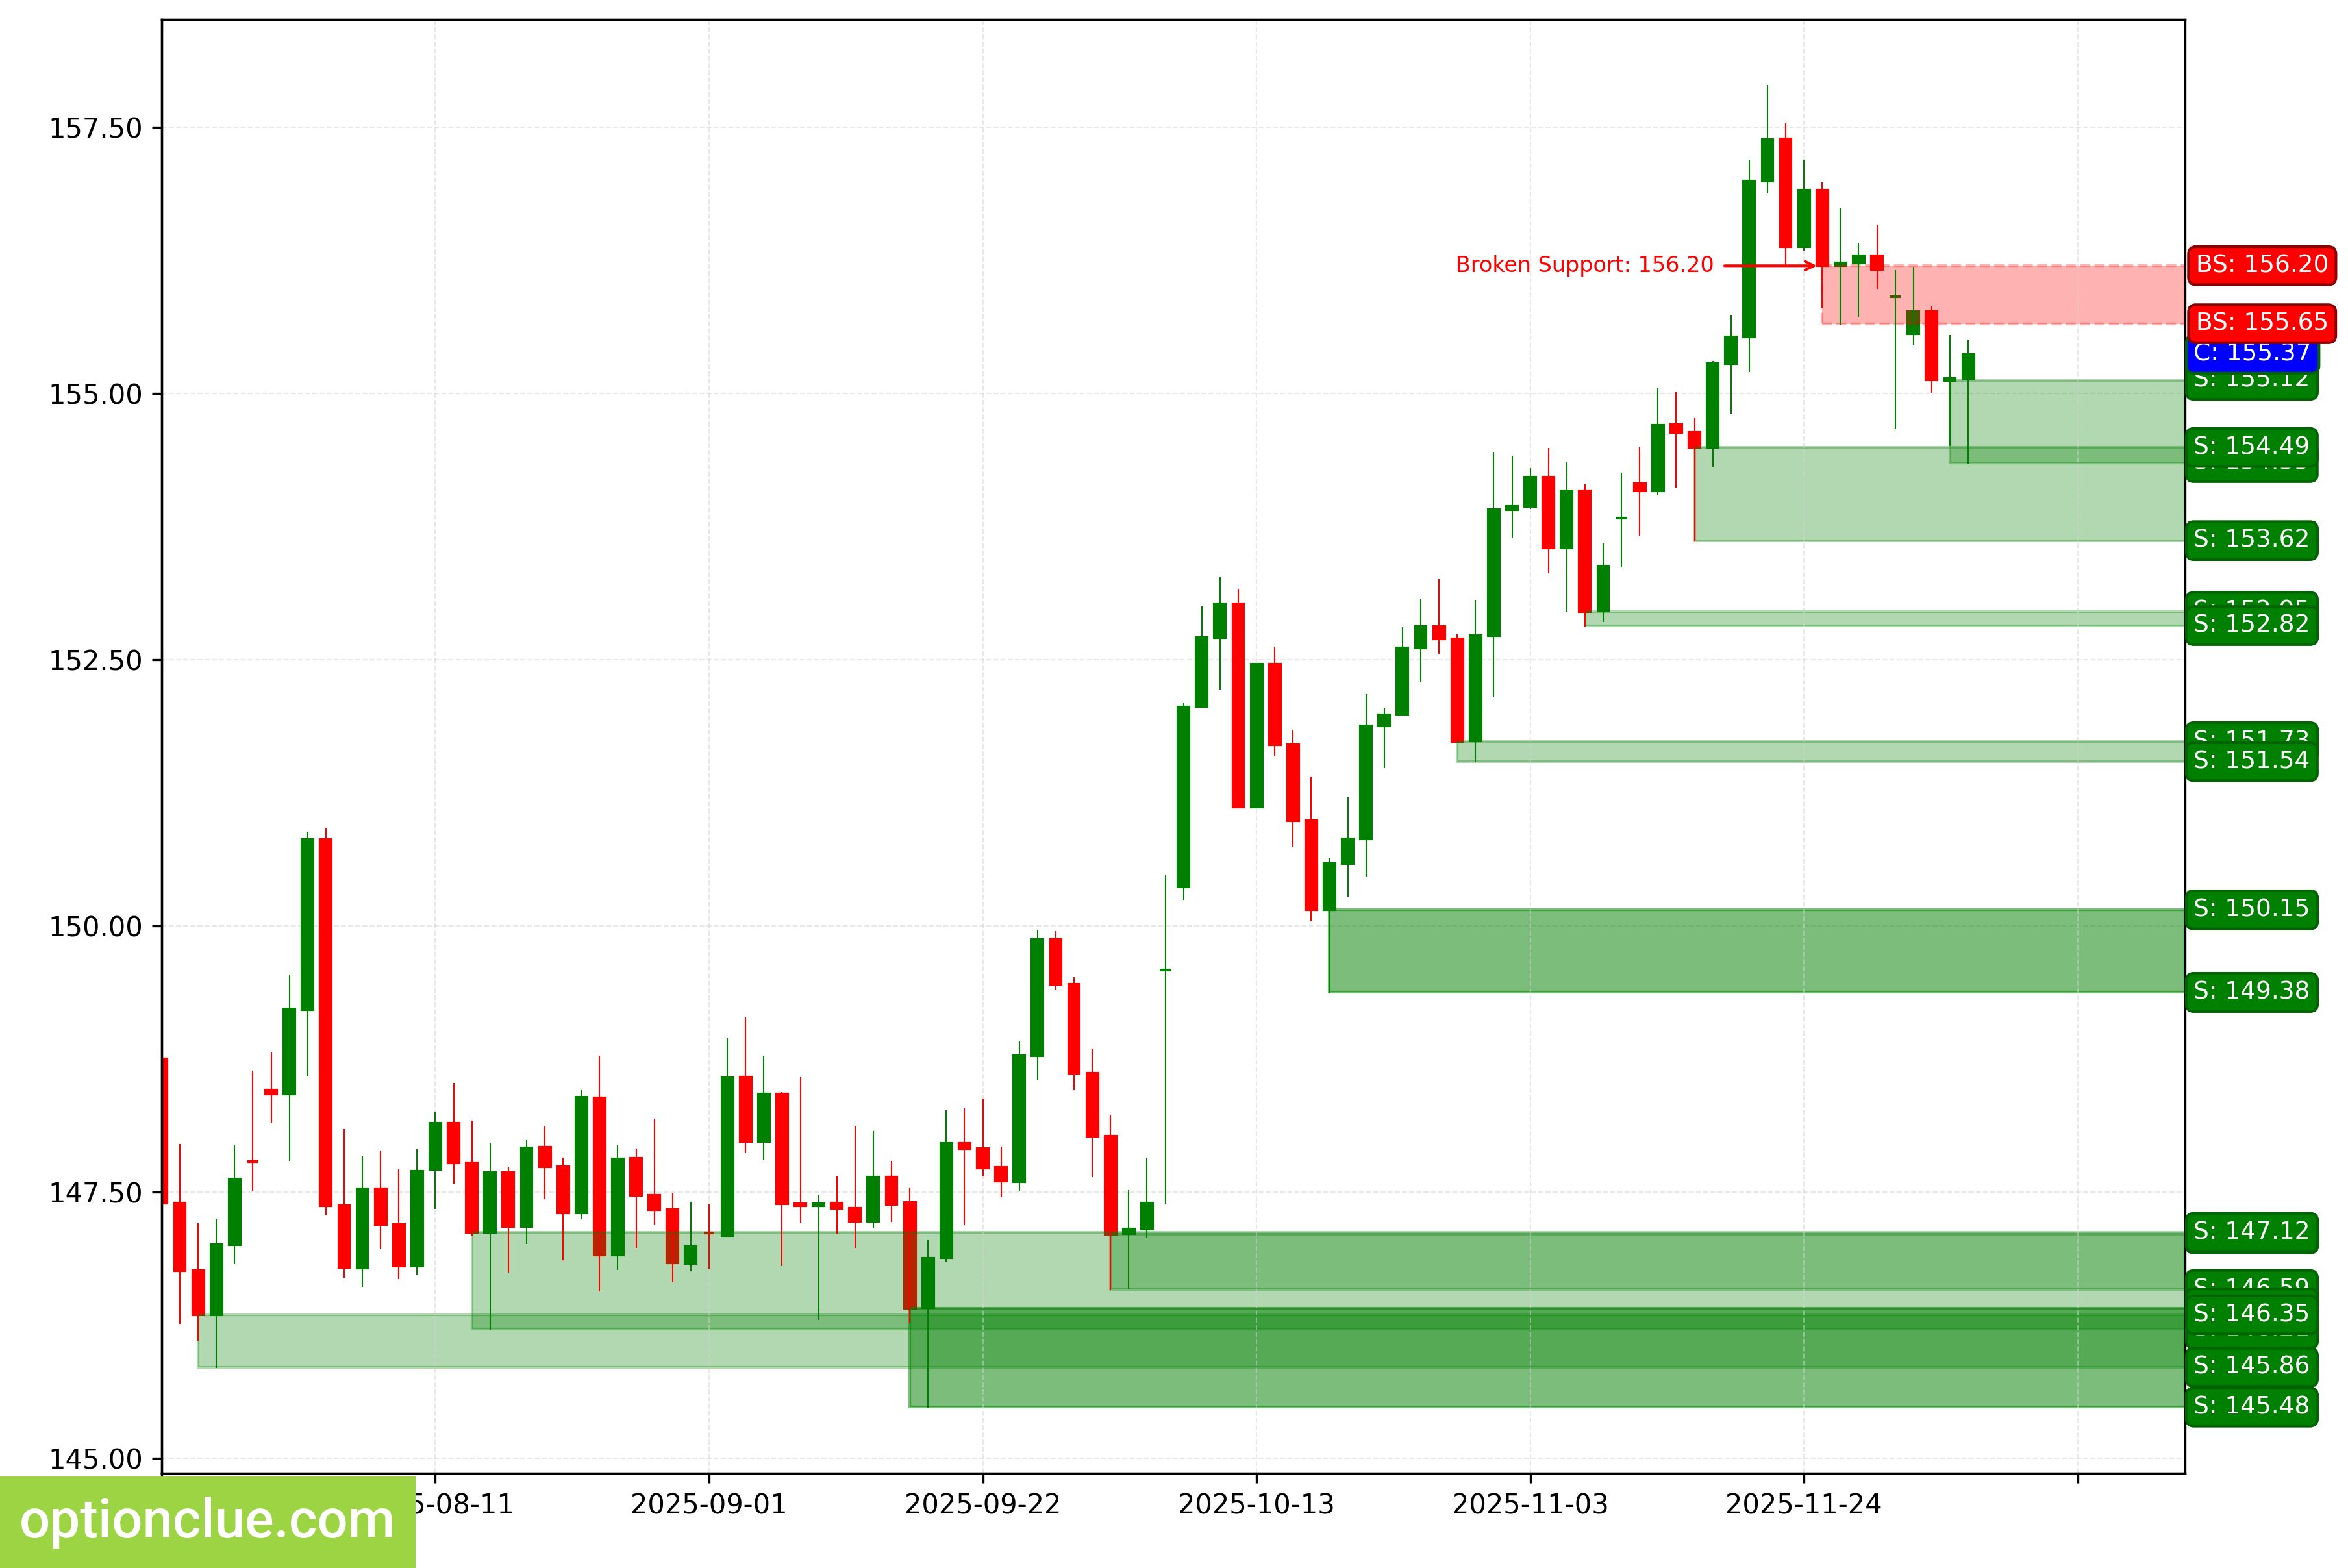
USDJPY. Technical analysis. D1.
Canadian Dollar (USDCAD)
The trend has changed to bearish, when the support level (1.3983 — 1.4002) was broken last week. The breakout occurred 6 candlesticks ago. An impulse wave is developing.
The intermediate target for the downward movement is the support level with boundaries 1.3723 — 1.3738. In case of successful trend development, a further target will be at the support level with boundaries 1.3573 — 1.3590.
The potential profit/risk ratio from current prices when setting targets and fixing risks based on daily timeframe levels may be small 0.2:1. When selecting a further target — 0.6:1. If a new correction completes in the area of the resistance level (1.4108 — 1.4124), the potential profit/risk ratio (based on risk zone/targets) may be 4:1. When assessing a further target — 6:1. If a correction occurs to the last broken level (1.3983 — 1.4002), the potential profit/risk ratio may be slightly more than 1:1.
Short positions will remain relevant, as long as the market remains below the nearest resistance level with boundaries 1.4108 — 1.4124. If the market successfully settles above this nearest resistance, the trend will change to the opposite (bullish).
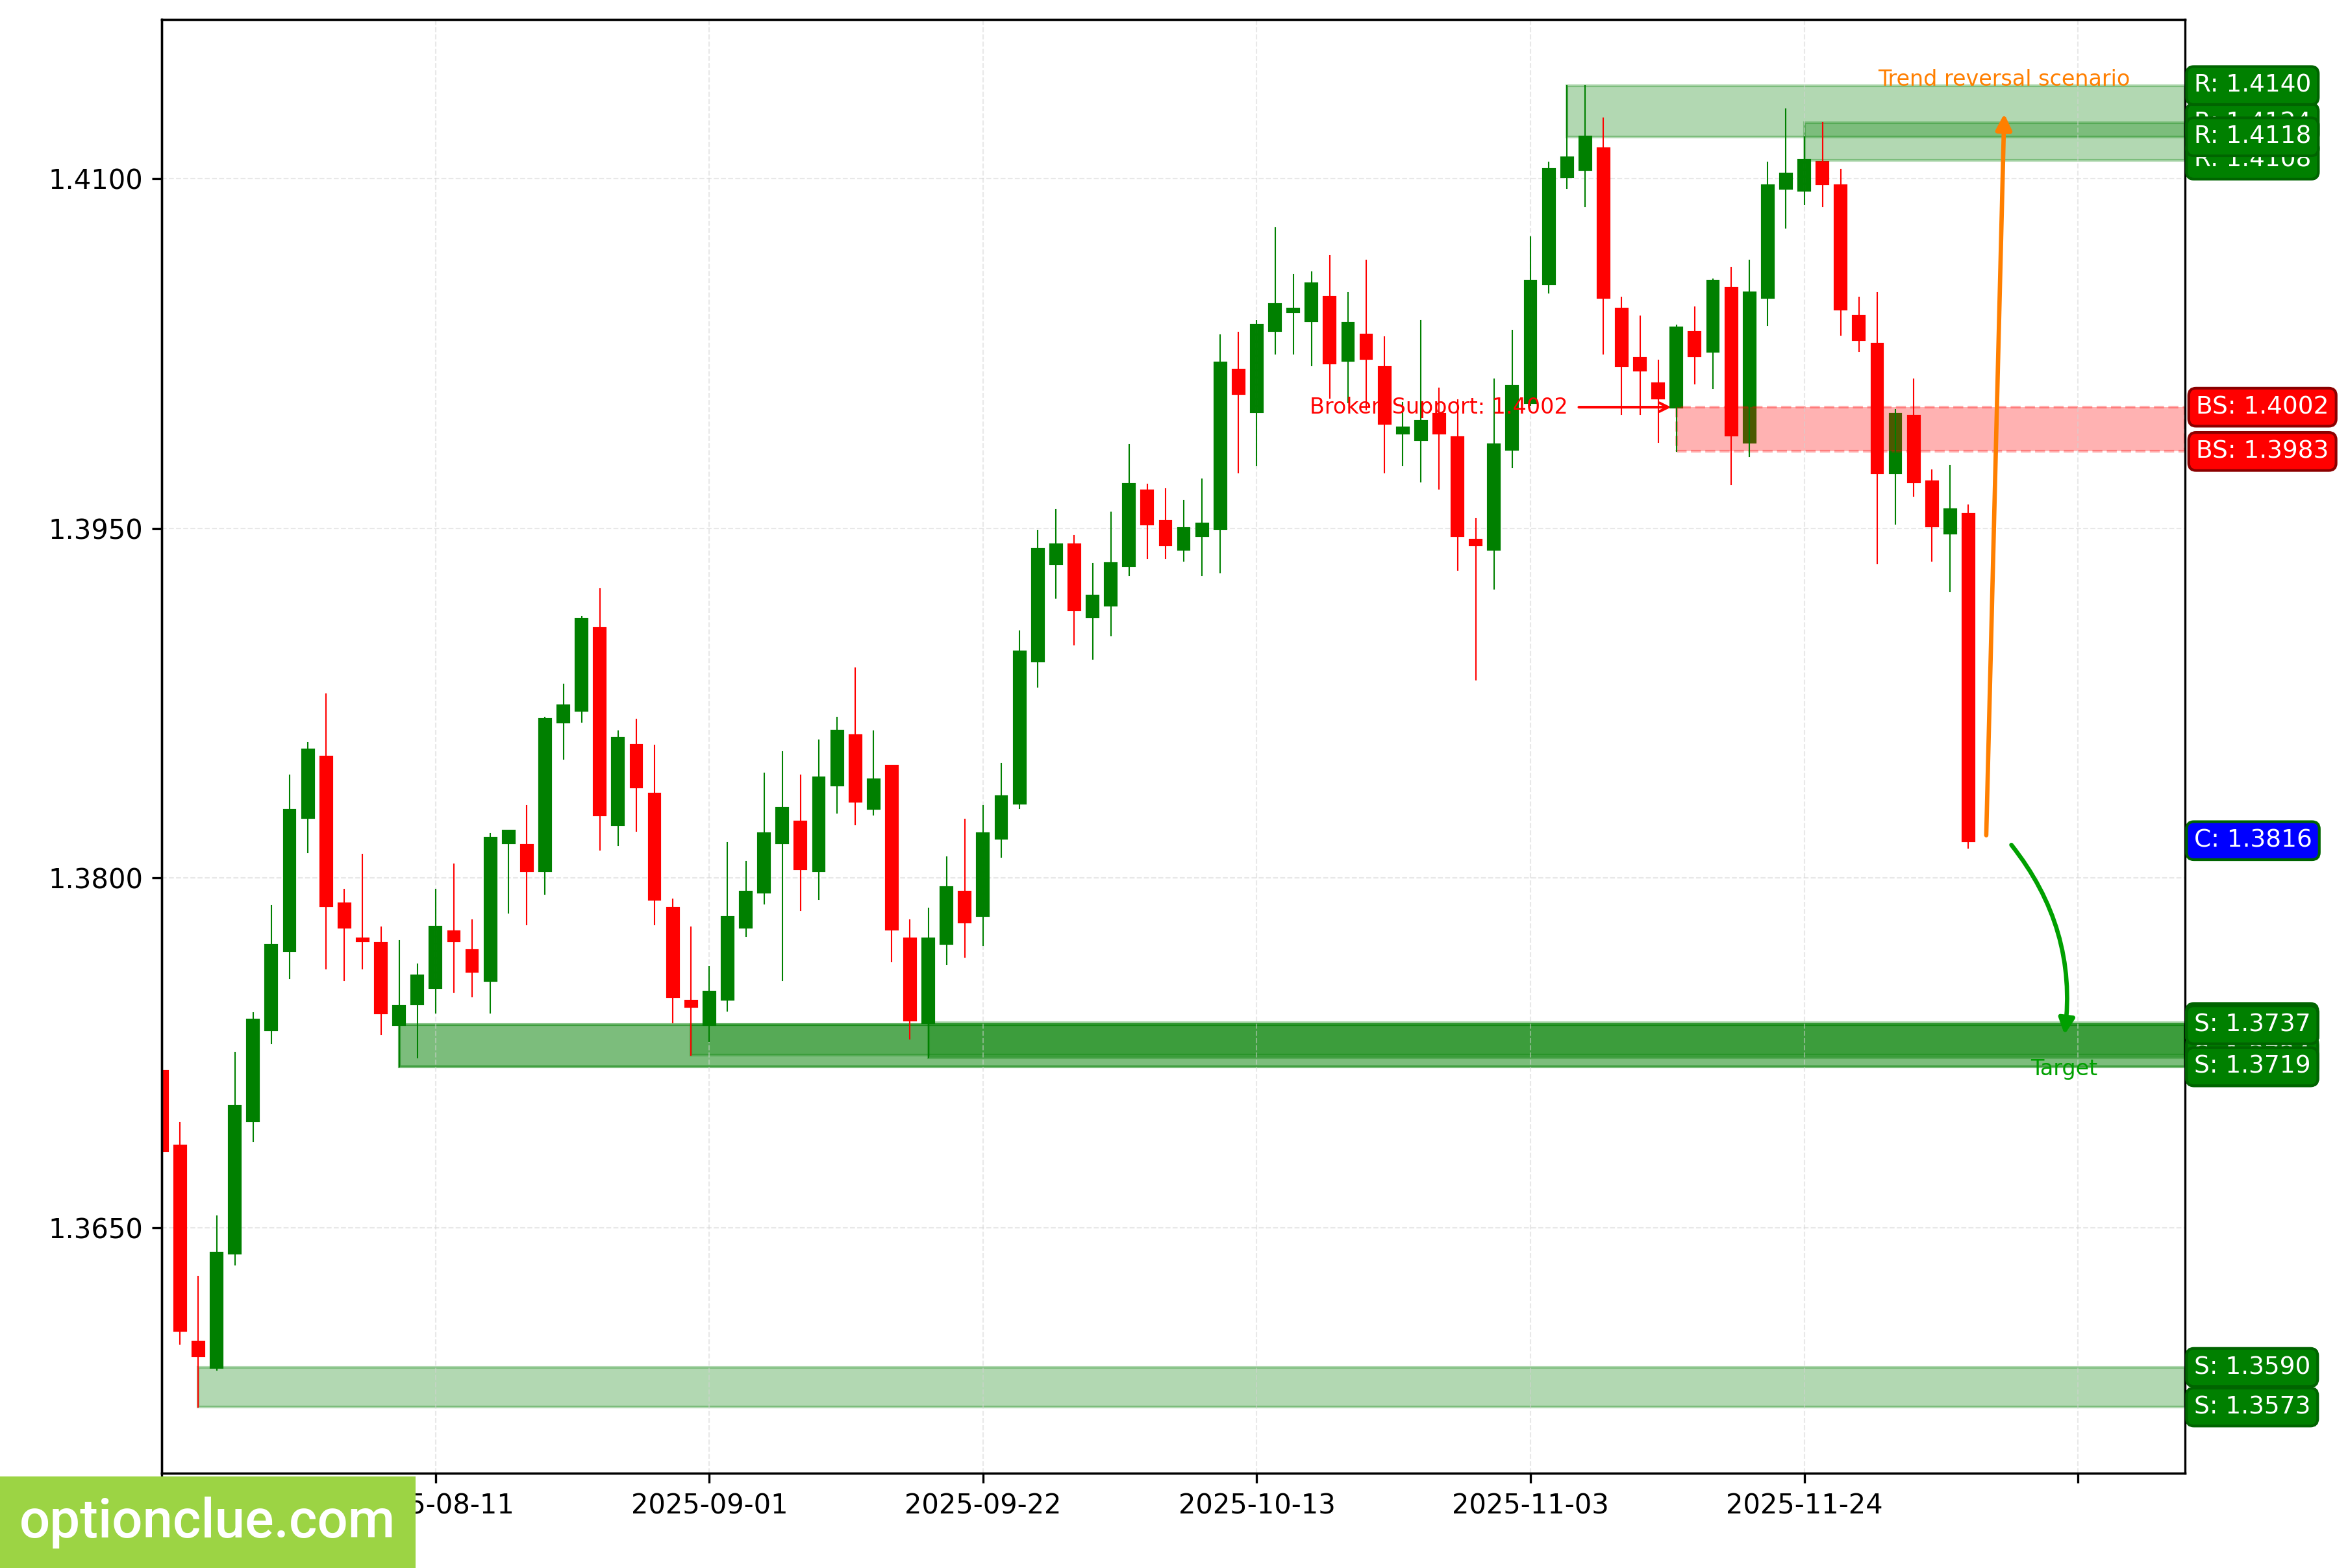
USDCAD. Technical analysis. D1.
Australian Dollar (AUDUSD)
The trend has changed to bullish, when the resistance level (0.6536 — 0.6580) was broken last week. The breakout occurred 3 candlesticks ago. An impulse wave is developing.
The intermediate target for the upward movement is the resistance level with boundaries 0.6689 — 0.6707. In case of successful trend development, a further target will be at the resistance level with boundaries 0.6915 — 0.6942.
The potential profit/risk ratio from current prices when setting targets and fixing risks based on daily timeframe levels may be small 0.2:1. When selecting a further target — more than 1:1. If the correction completes in the area of the last broken level (0.6536 — 0.6580), the potential profit/risk ratio may be insignificant (0.7:1). If a correction occurs to the support level (0.6419 — 0.6439), the potential profit/risk ratio may be 4:1.
Long positions will remain relevant, as long as the market is above the nearest support level with boundaries 0.6419 — 0.6439. If the market successfully settles below this nearest support, the trend will change to the opposite (bearish).
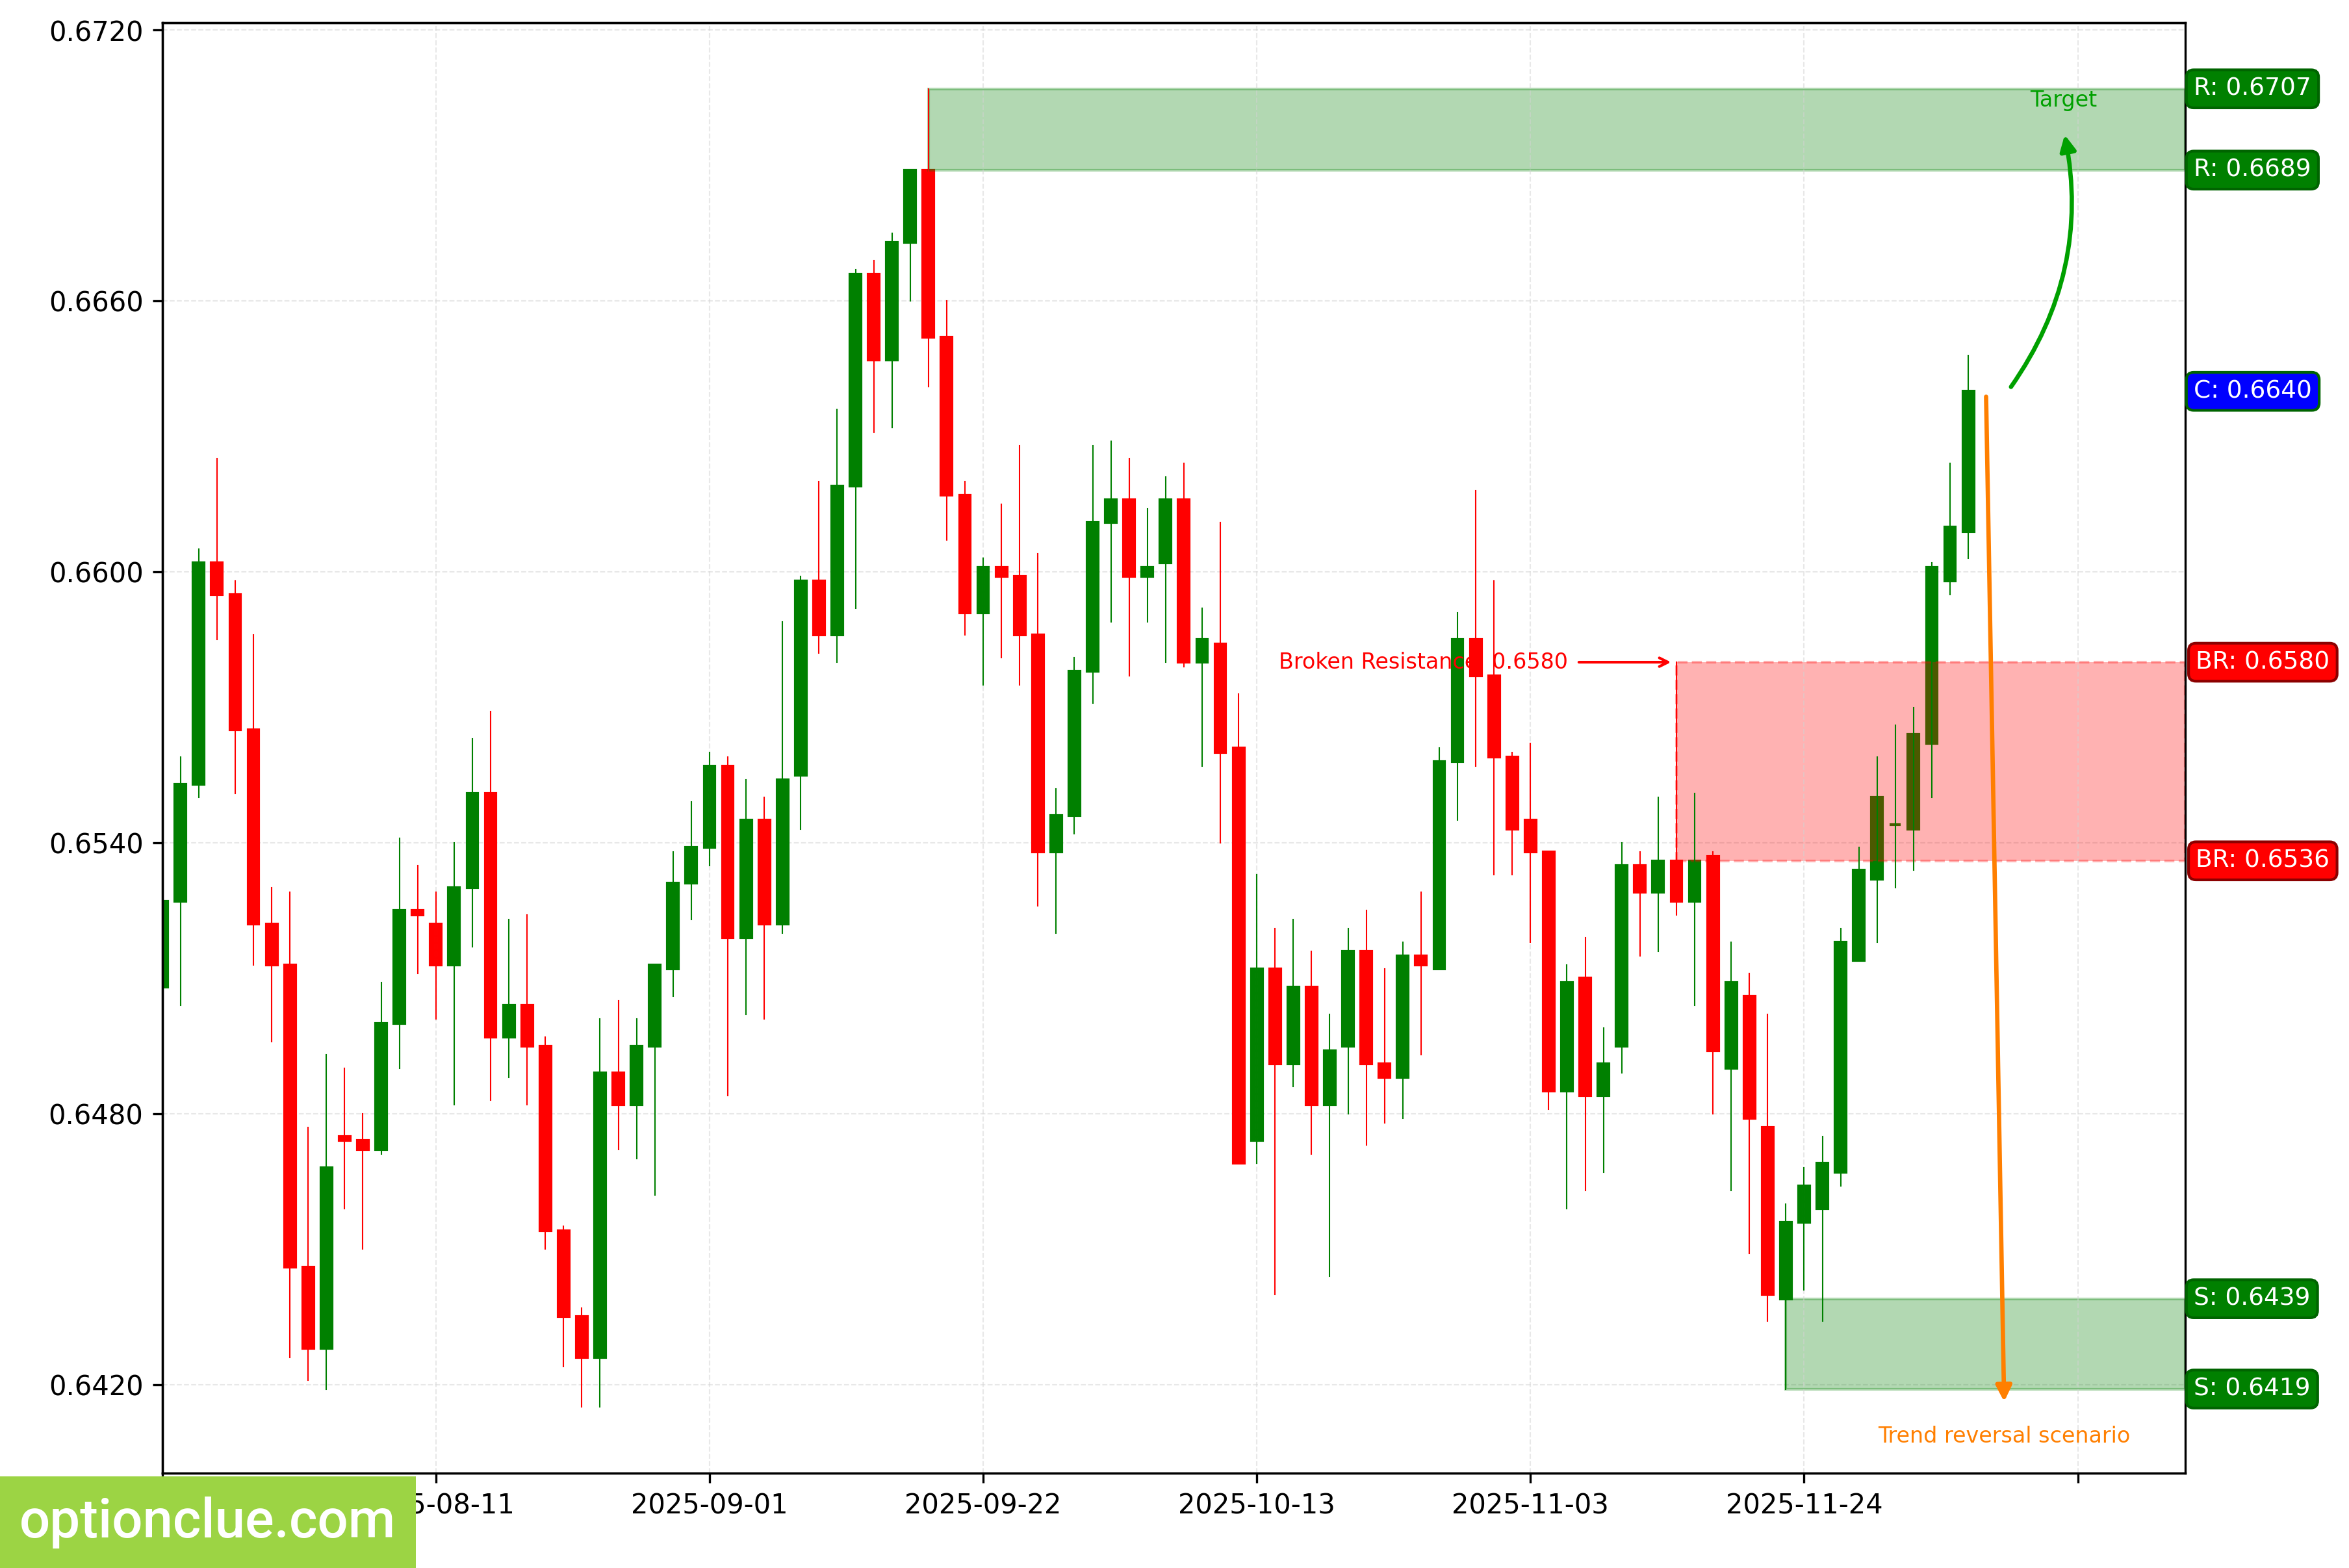
AUDUSD. Technical analysis. D1.
Bitcoin (BTC)
The trend has changed to bullish, when the resistance level (91285 — 92969) was broken. The breakout occurred 5 candlesticks ago. A corrective wave is developing. An entry point for buying on rebound may form after the completion of the current correction.
The intermediate target for the upward movement is the resistance level with boundaries 93528 — 94061. In case of successful trend development, a further target will be at the resistance level with boundaries 105997 — 107428.
If the next correction completes in the area of the support level (83862 — 86322), the potential profit/risk ratio (based on risk zone/targets) may be approximately 2:1. When selecting a further target — 4:1.
Long positions will remain relevant, as long as the market is above the nearest support level with boundaries 83862 — 86322. If the market successfully settles below this support, the trend will change to the opposite (bearish).
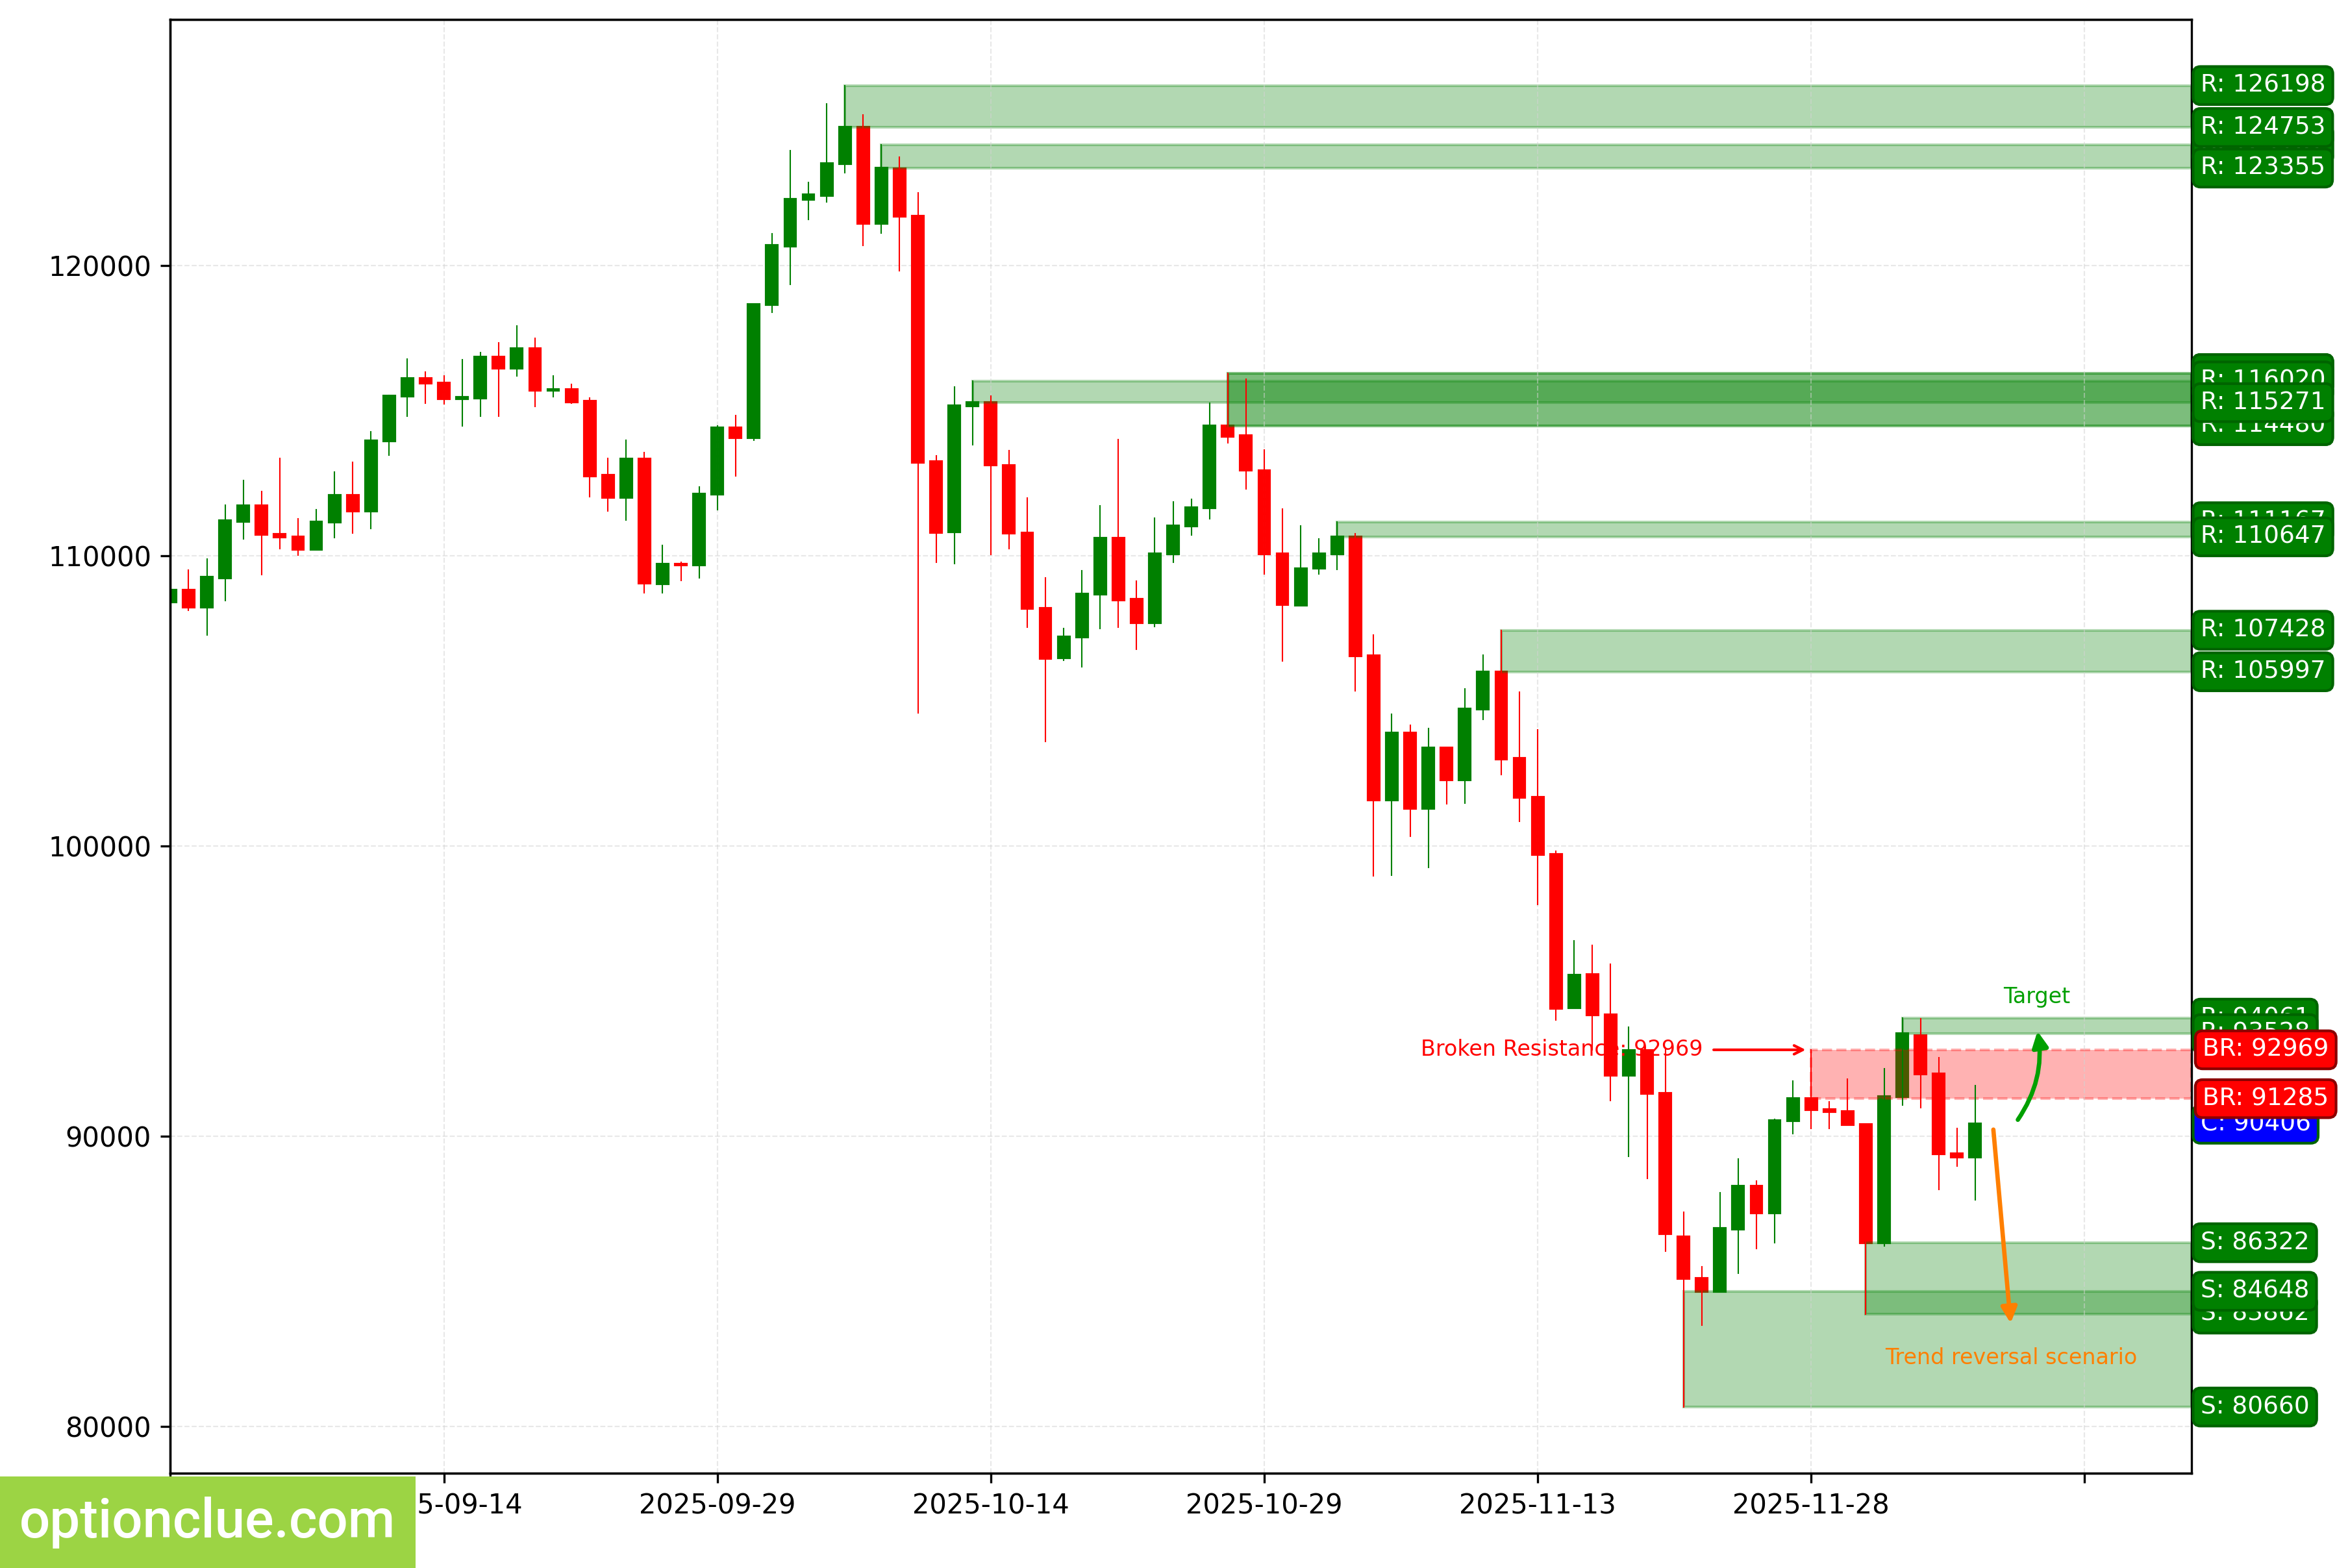
BTC. Technical analysis. D1.
Ether (ETH)
The trend has changed to bullish, when the resistance level (3032 — 3095) was broken last week. The breakout occurred 5 candlesticks ago, and the price has returned to this last broken level. 2 candlesticks ago, the correction likely completed and an entry point for buying on rebound formed, an impulse wave is developing.
The intermediate target for the upward movement is the resistance level with boundaries 3192 — 3239. In case of successful trend development, a further target will be at the resistance level with boundaries 3583 — 3656.
If a new correction completes in the area of the support level (2931 — 3024), the potential profit/risk ratio may be small (slightly more than 1:1).
Long positions will remain relevant, as long as the market is above the nearest support level with boundaries 2931 — 3024. If the market successfully settles below this nearest support, the trend will change to the opposite (bearish).
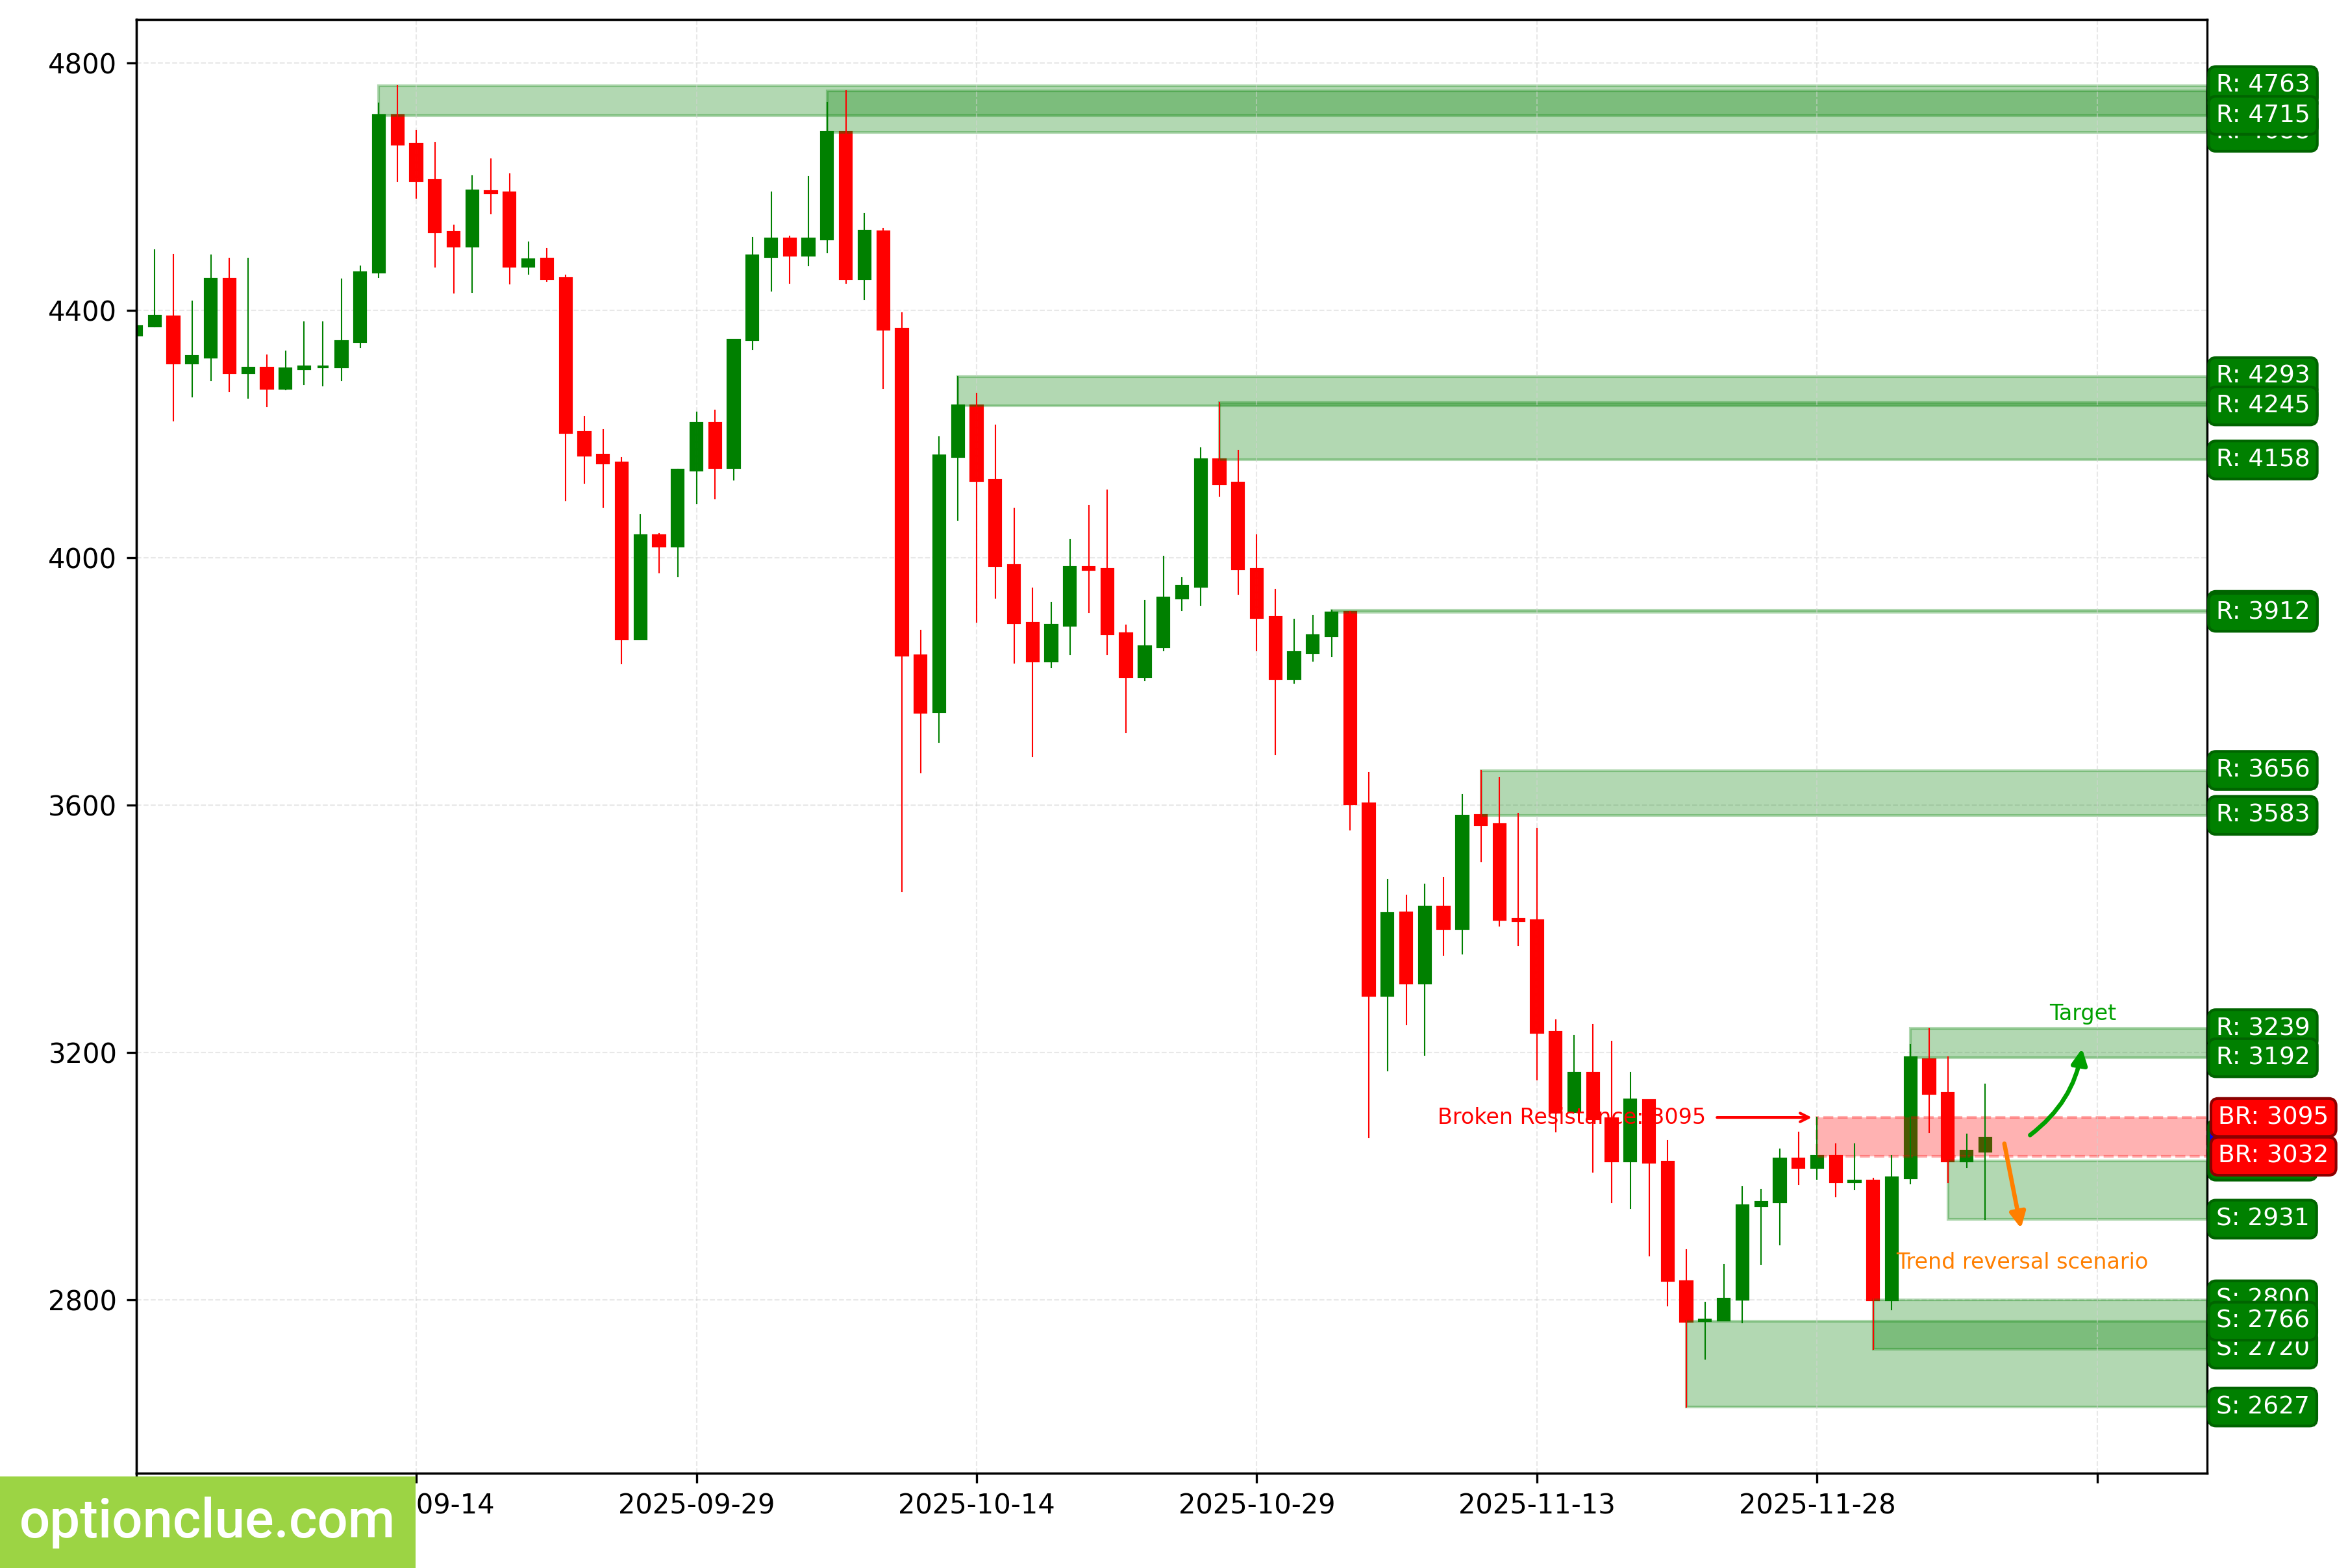
ETH. Technical analysis. D1.
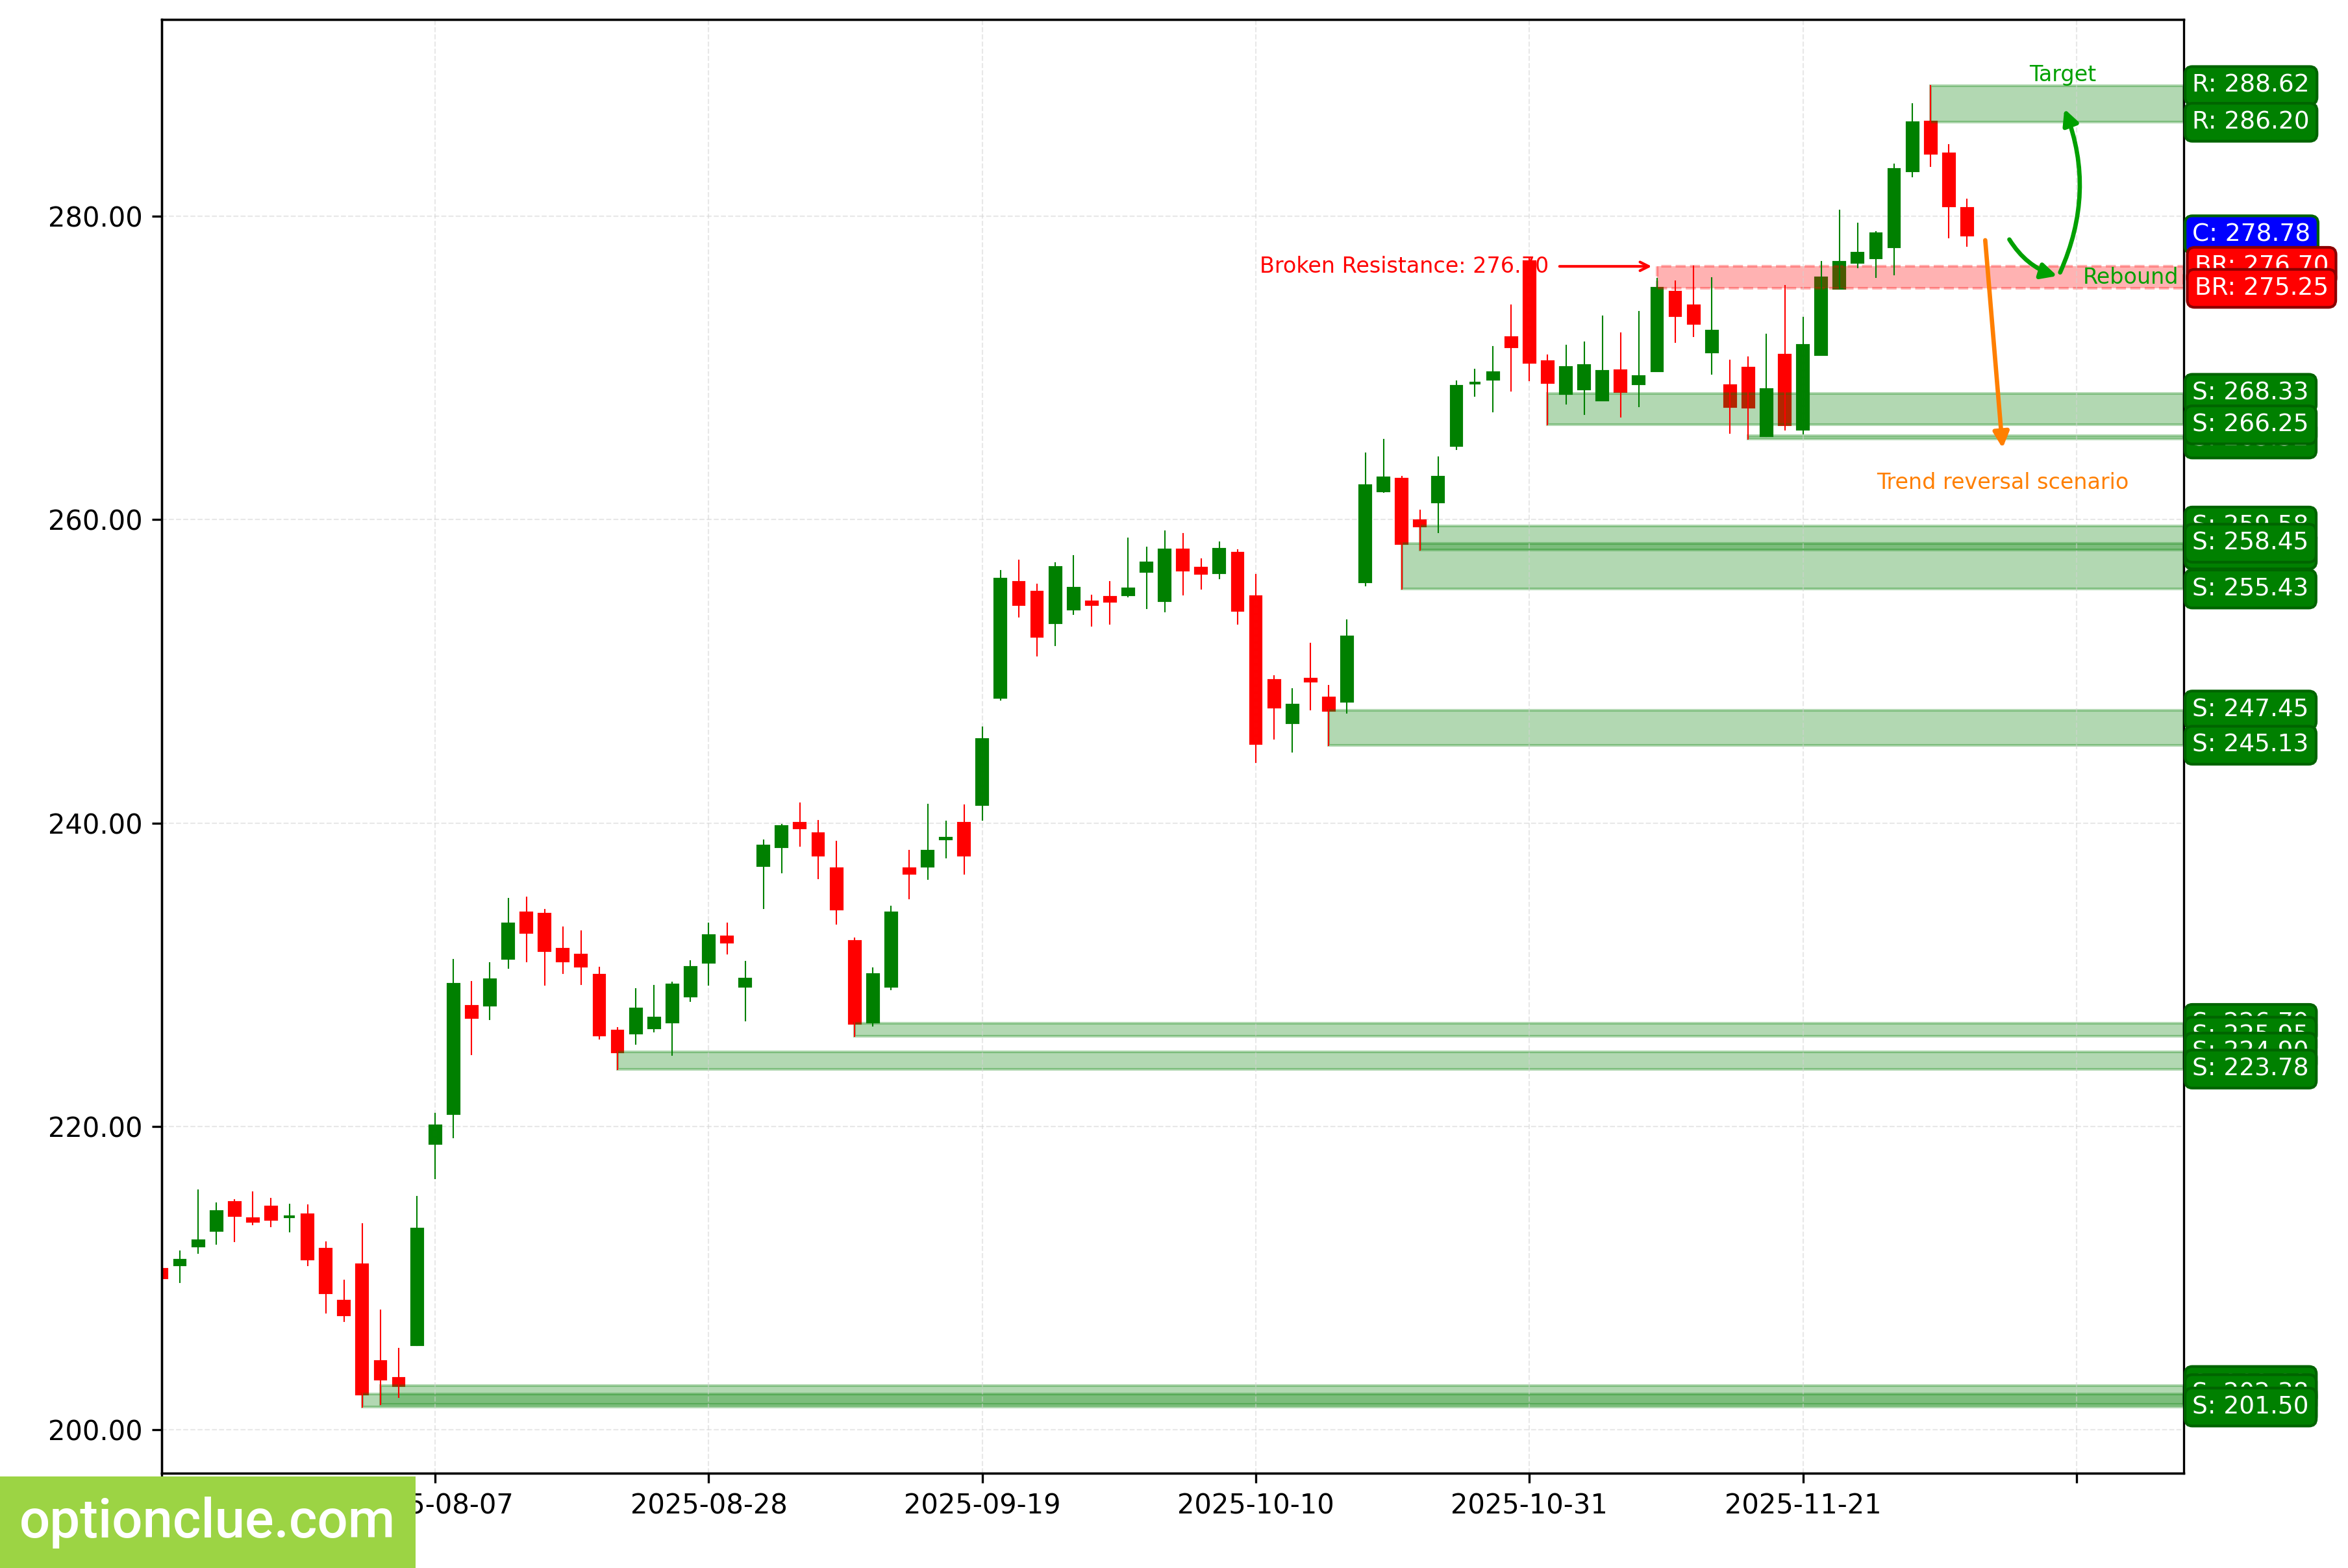
Apple Inc (AAPL)
The bullish trend continues, a corrective wave is developing. An entry point for buying on rebound may form after the completion of the current correction. The last broken level is resistance (275.25 — 276.70). The breakout occurred 8 candlesticks ago.
Upon resumption of the upward movement, the first target will be the resistance level with boundaries 286.20 — 288.62.
The potential profit/risk ratio from current prices when setting targets and fixing risks based on daily timeframe levels may be small 0.4:1. If the correction completes in the area of the last broken level (275.25 — 276.70), the potential profit/risk ratio may be insignificant (0.6:1). If a correction occurs to the support level (265.32 — 265.53), the potential profit/risk ratio may be 3:1.
Long positions will remain relevant, as long as the market is above the nearest support level with boundaries 265.32 — 265.53. If the market successfully settles below this nearest support, the trend will change to the opposite (bearish).
AAPL. Technical analysis. D1.
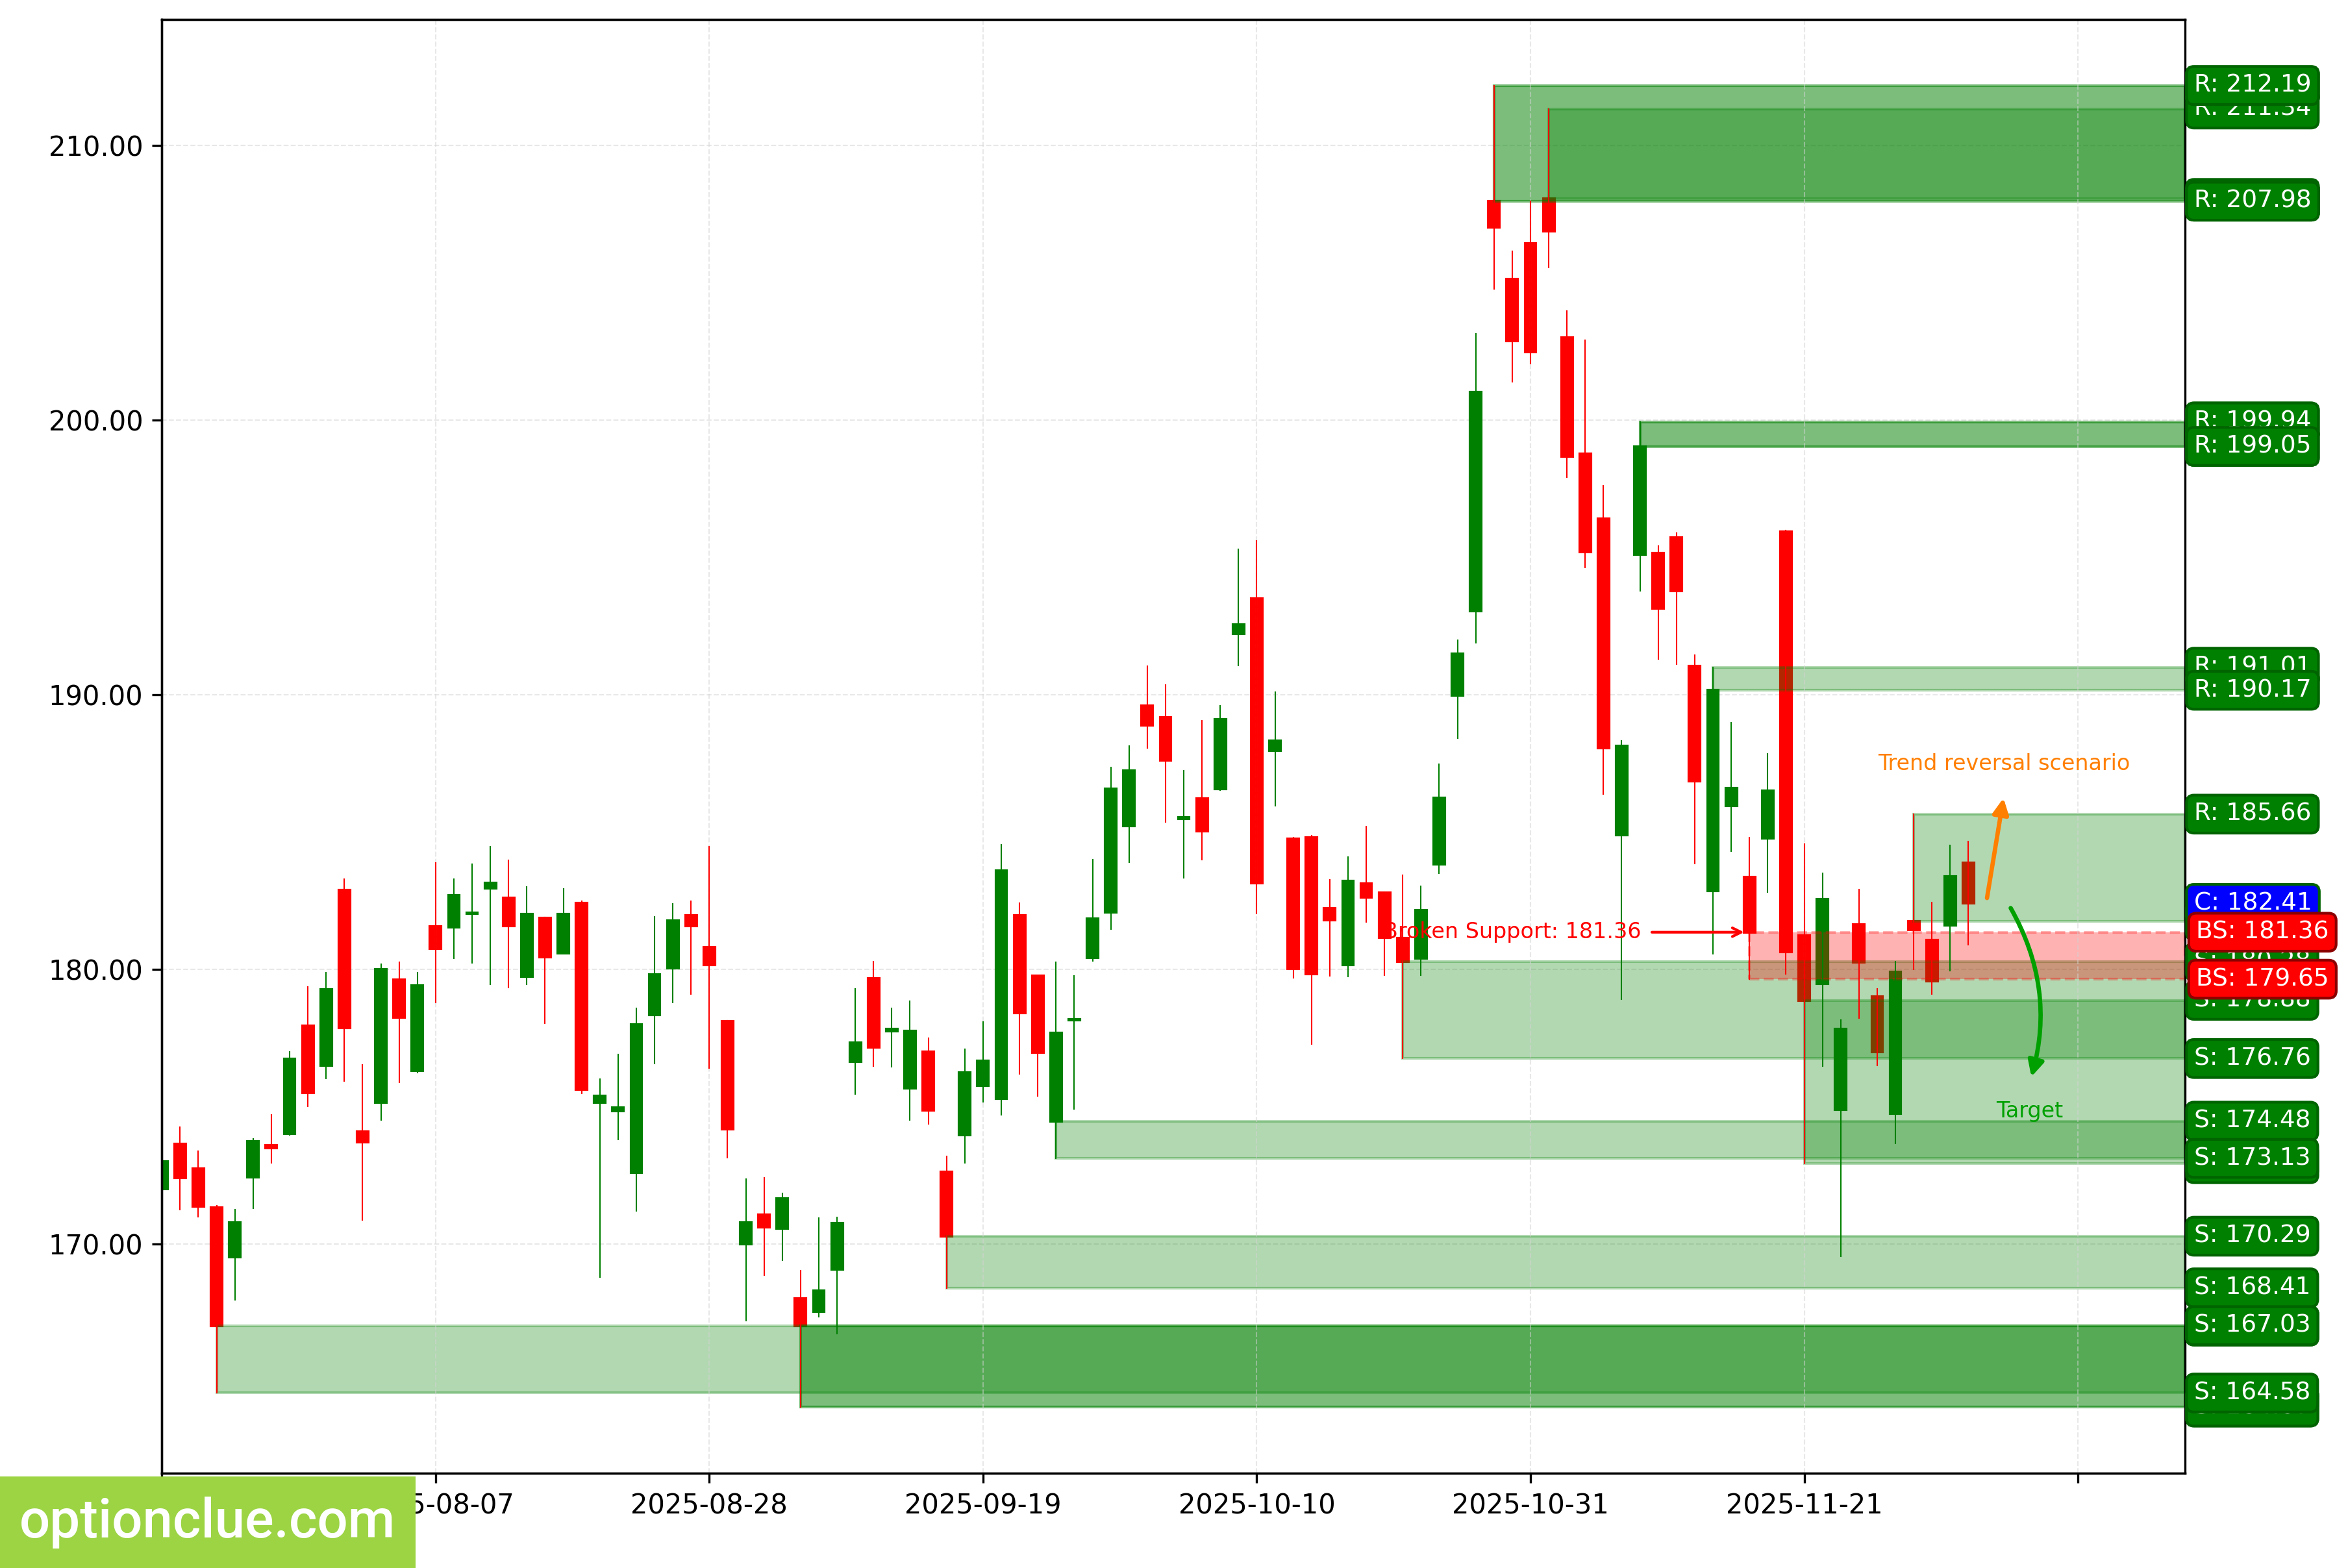
NVIDIA Corp (NVDA)
The bearish trend continues, a corrective wave is developing. An entry point for selling on rebound may form after the completion of the current correction. The last broken level is support (179.65 — 181.36). The breakout occurred 10 candlesticks ago.
The intermediate target for the downward movement is the support level with boundaries 172.93 — 178.88. In case of successful trend development, a further target will be at the support level with boundaries 164.07 — 167.02. . If the next correction completes in the area of the resistance level (181.76 — 185.66), the potential profit/risk ratio may be small (0.3:1). If a correction occurs to the last broken level (179.65 — 181.36), the potential profit/risk ratio may be insignificant 0.1:1.
Short positions will remain relevant, as long as the market remains below the nearest resistance level with boundaries 181.76 — 185.66. If the market successfully settles above this nearest resistance, the trend will change to the opposite (bullish).
NVDA. Technical analysis. D1.
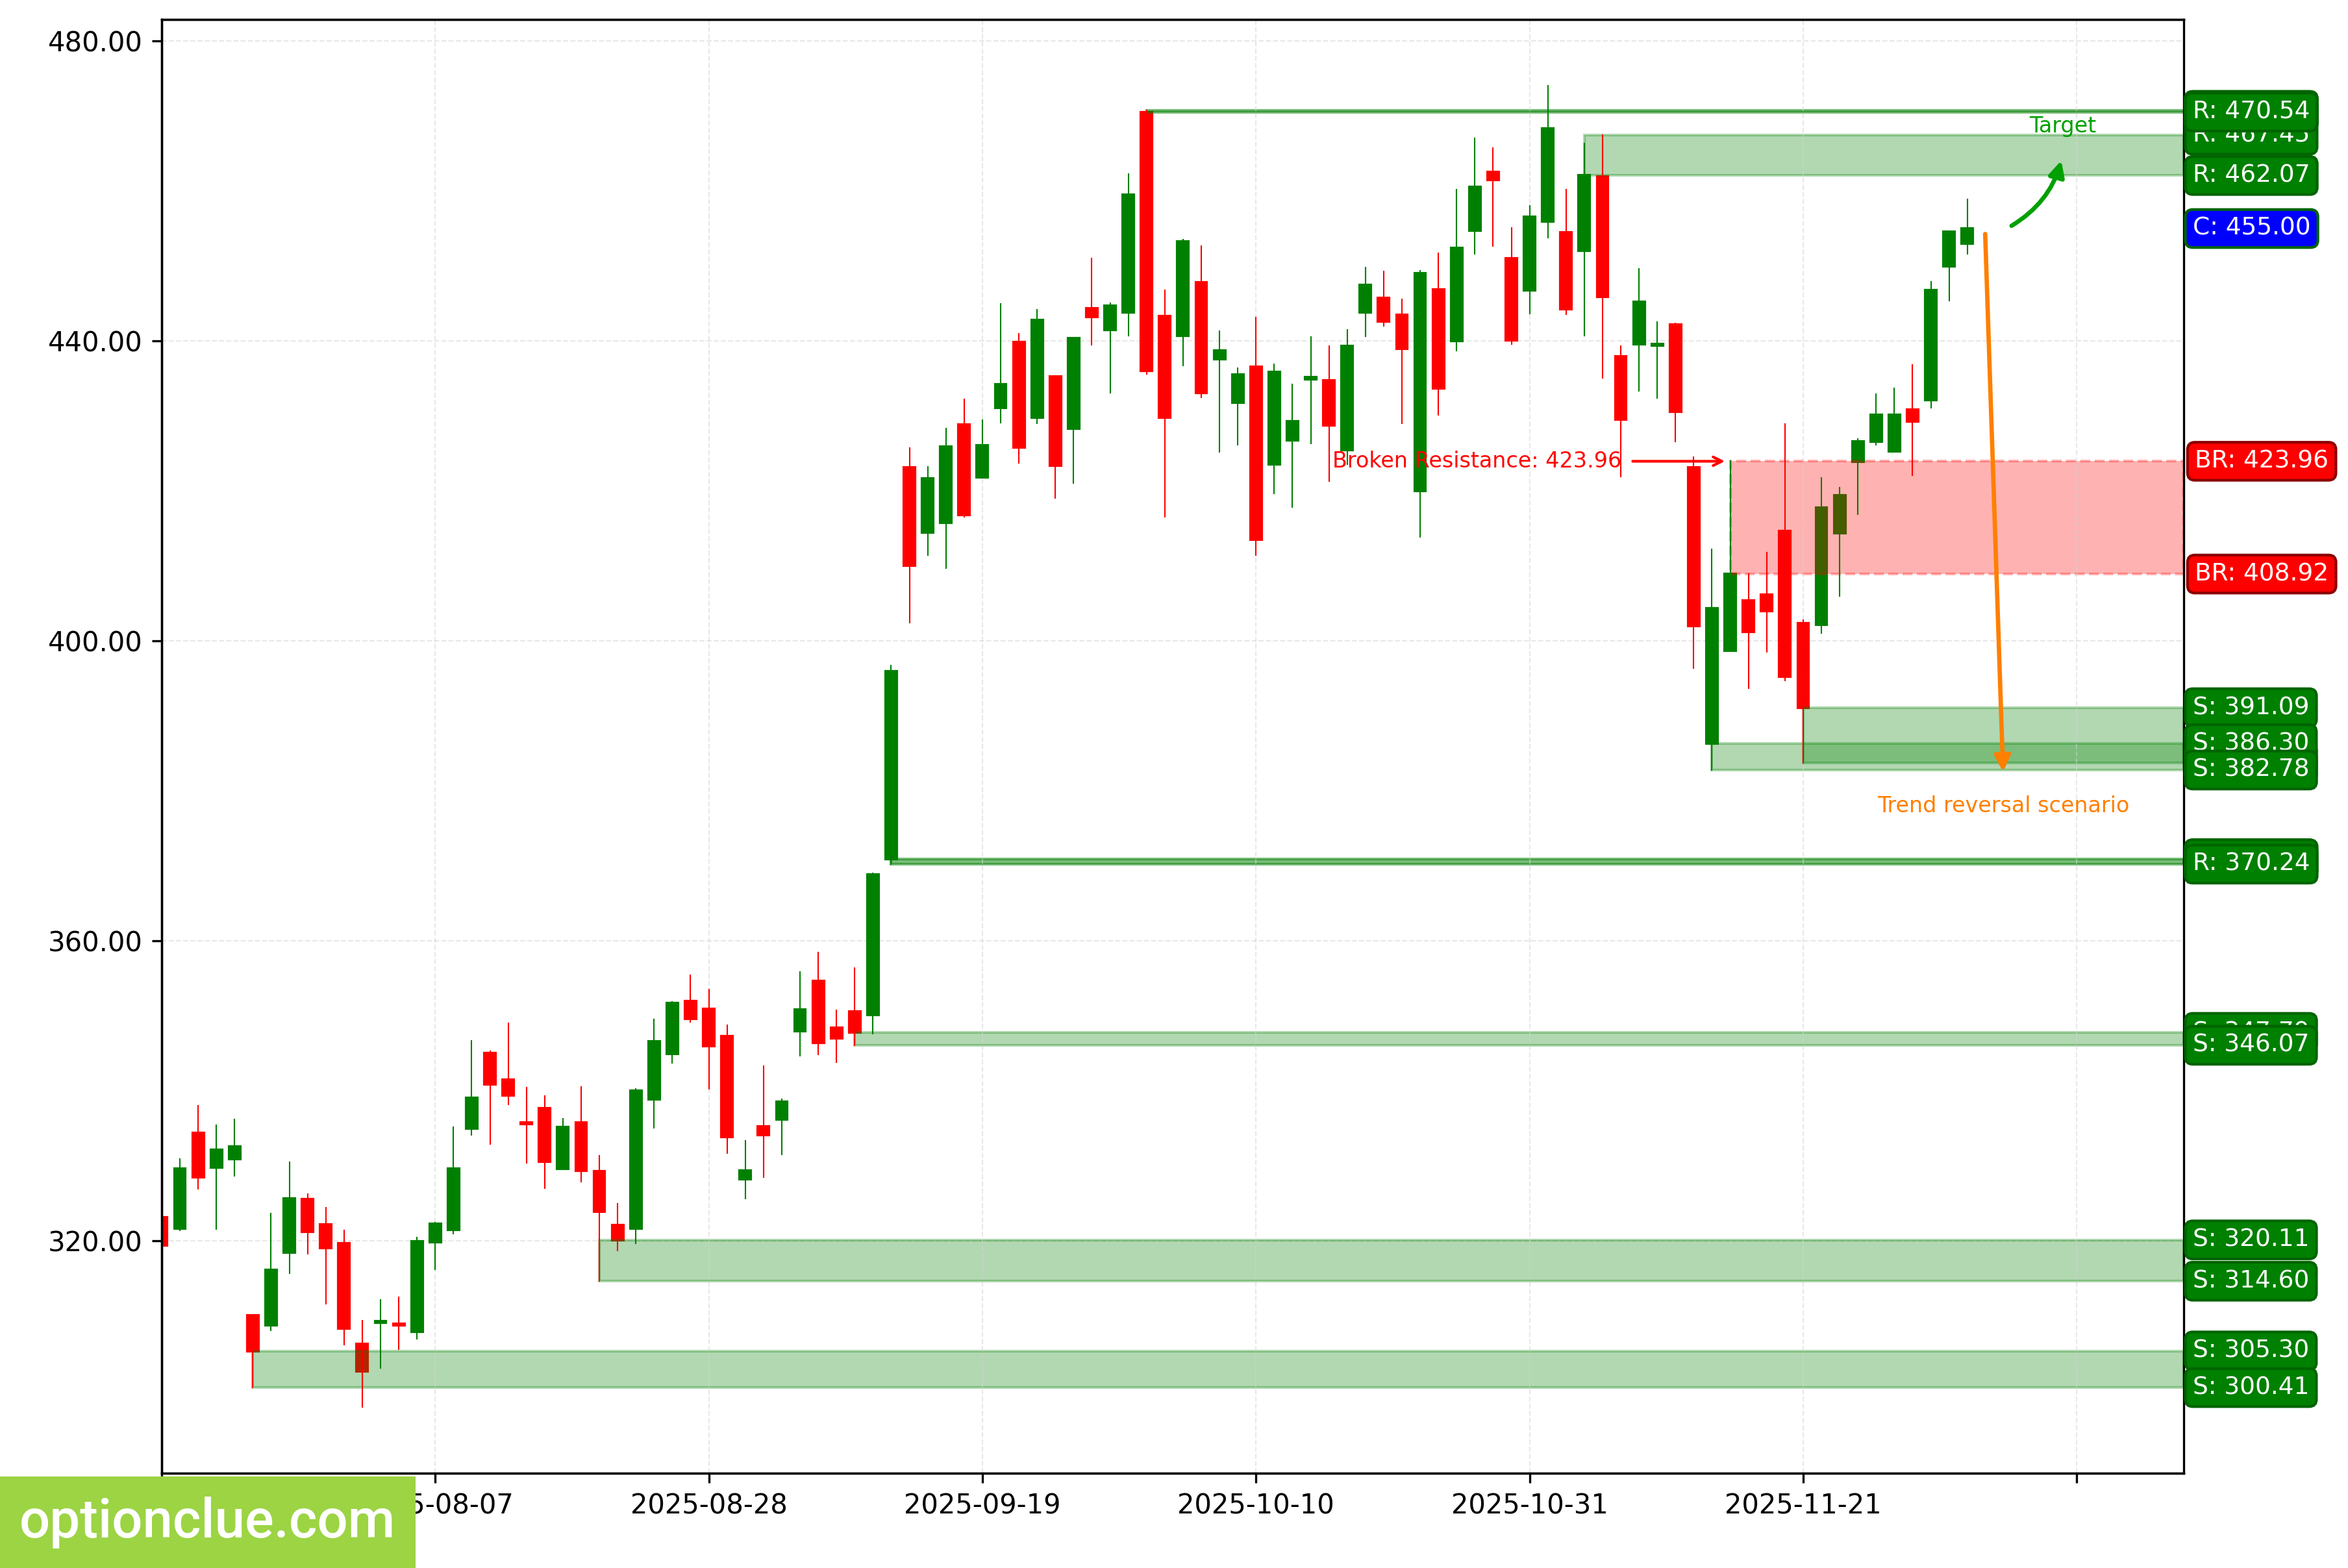
Tesla Inc (TSLA)
The bullish trend continues, 3 candlesticks ago the correction completed and an entry point for buying on rebound formed, an impulse wave is developing. The last broken level is resistance (408.92 — 423.96). The breakout occurred 7 candlesticks ago.
The intermediate target for the upward movement is the resistance level with boundaries 462.07 — 467.45. In case of successful trend development, a further target may be at the level 468.37.
The potential profit/risk ratio from current prices when setting targets and fixing risks based on daily timeframe levels may be small 0.1:1. If the next correction completes in the area of the last broken level (408.92 — 423.96), the potential profit/risk ratio may be insignificant (around 1:1). If a correction occurs to the support level (383.76 — 391.09), the potential profit/risk ratio may be 4:1.
Long positions will remain relevant, as long as the market is above the nearest support level with boundaries 383.76 — 391.09. If the market successfully settles below this nearest support, the trend will change to the opposite (bearish).
TSLA. Technical analysis. D1.
Summary
From the perspective of medium-term trading, financial instruments with a correction close to completion on the Daily and/or potentially the most promising profit-to-risk ratio can be named: GBPUSD, EURUSD, NVDA, AAPL, ETH, BTC.
The other financial instruments on the trading list may also be interesting, but on these markets, rebound signals on the Daily are likely to appear no earlier than in a week.