
This is a weekly market review based on technical analysis. We highlight strong horizontal levels and consider possible scenarios for event development.
Key Topics
- Euro (EURUSD)
- British Pound (GBPUSD)
- Japanese Yen (USDJPY)
- Canadian Dollar (USDCAD)
- Australian Dollar (AUDUSD)
- Bitcoin (BTC)
- Ether (ETH)
- Apple Inc (AAPL)
- NVIDIA Corp (NVDA)
- Tesla Inc (TSLA)
- Summary
Euro (EURUSD)
Bullish trend continues, a corrective wave is developing again. An entry point for buying on rebound may form after the current correction completes. The last broken level is resistance (1.1668 — 1.1699). The breakout occurred 14 candlesticks ago.
Intermediate target for the upward movement is the resistance level with boundaries 1.2023 — 1.2081.
If the correction completes near the support level (1.1574 — 1.1604), the potential profit/risk ratio may be more than 3:1. If the correction completes near the last broken level (1.1668 — 1.1699), the potential profit/risk ratio may be around 1.5:1.
Long positions will remain relevant as long as the market is above the nearest support level with boundaries 1.1574 — 1.1604. If the market successfully settles below this support, the trend will reverse to the opposite (bearish).
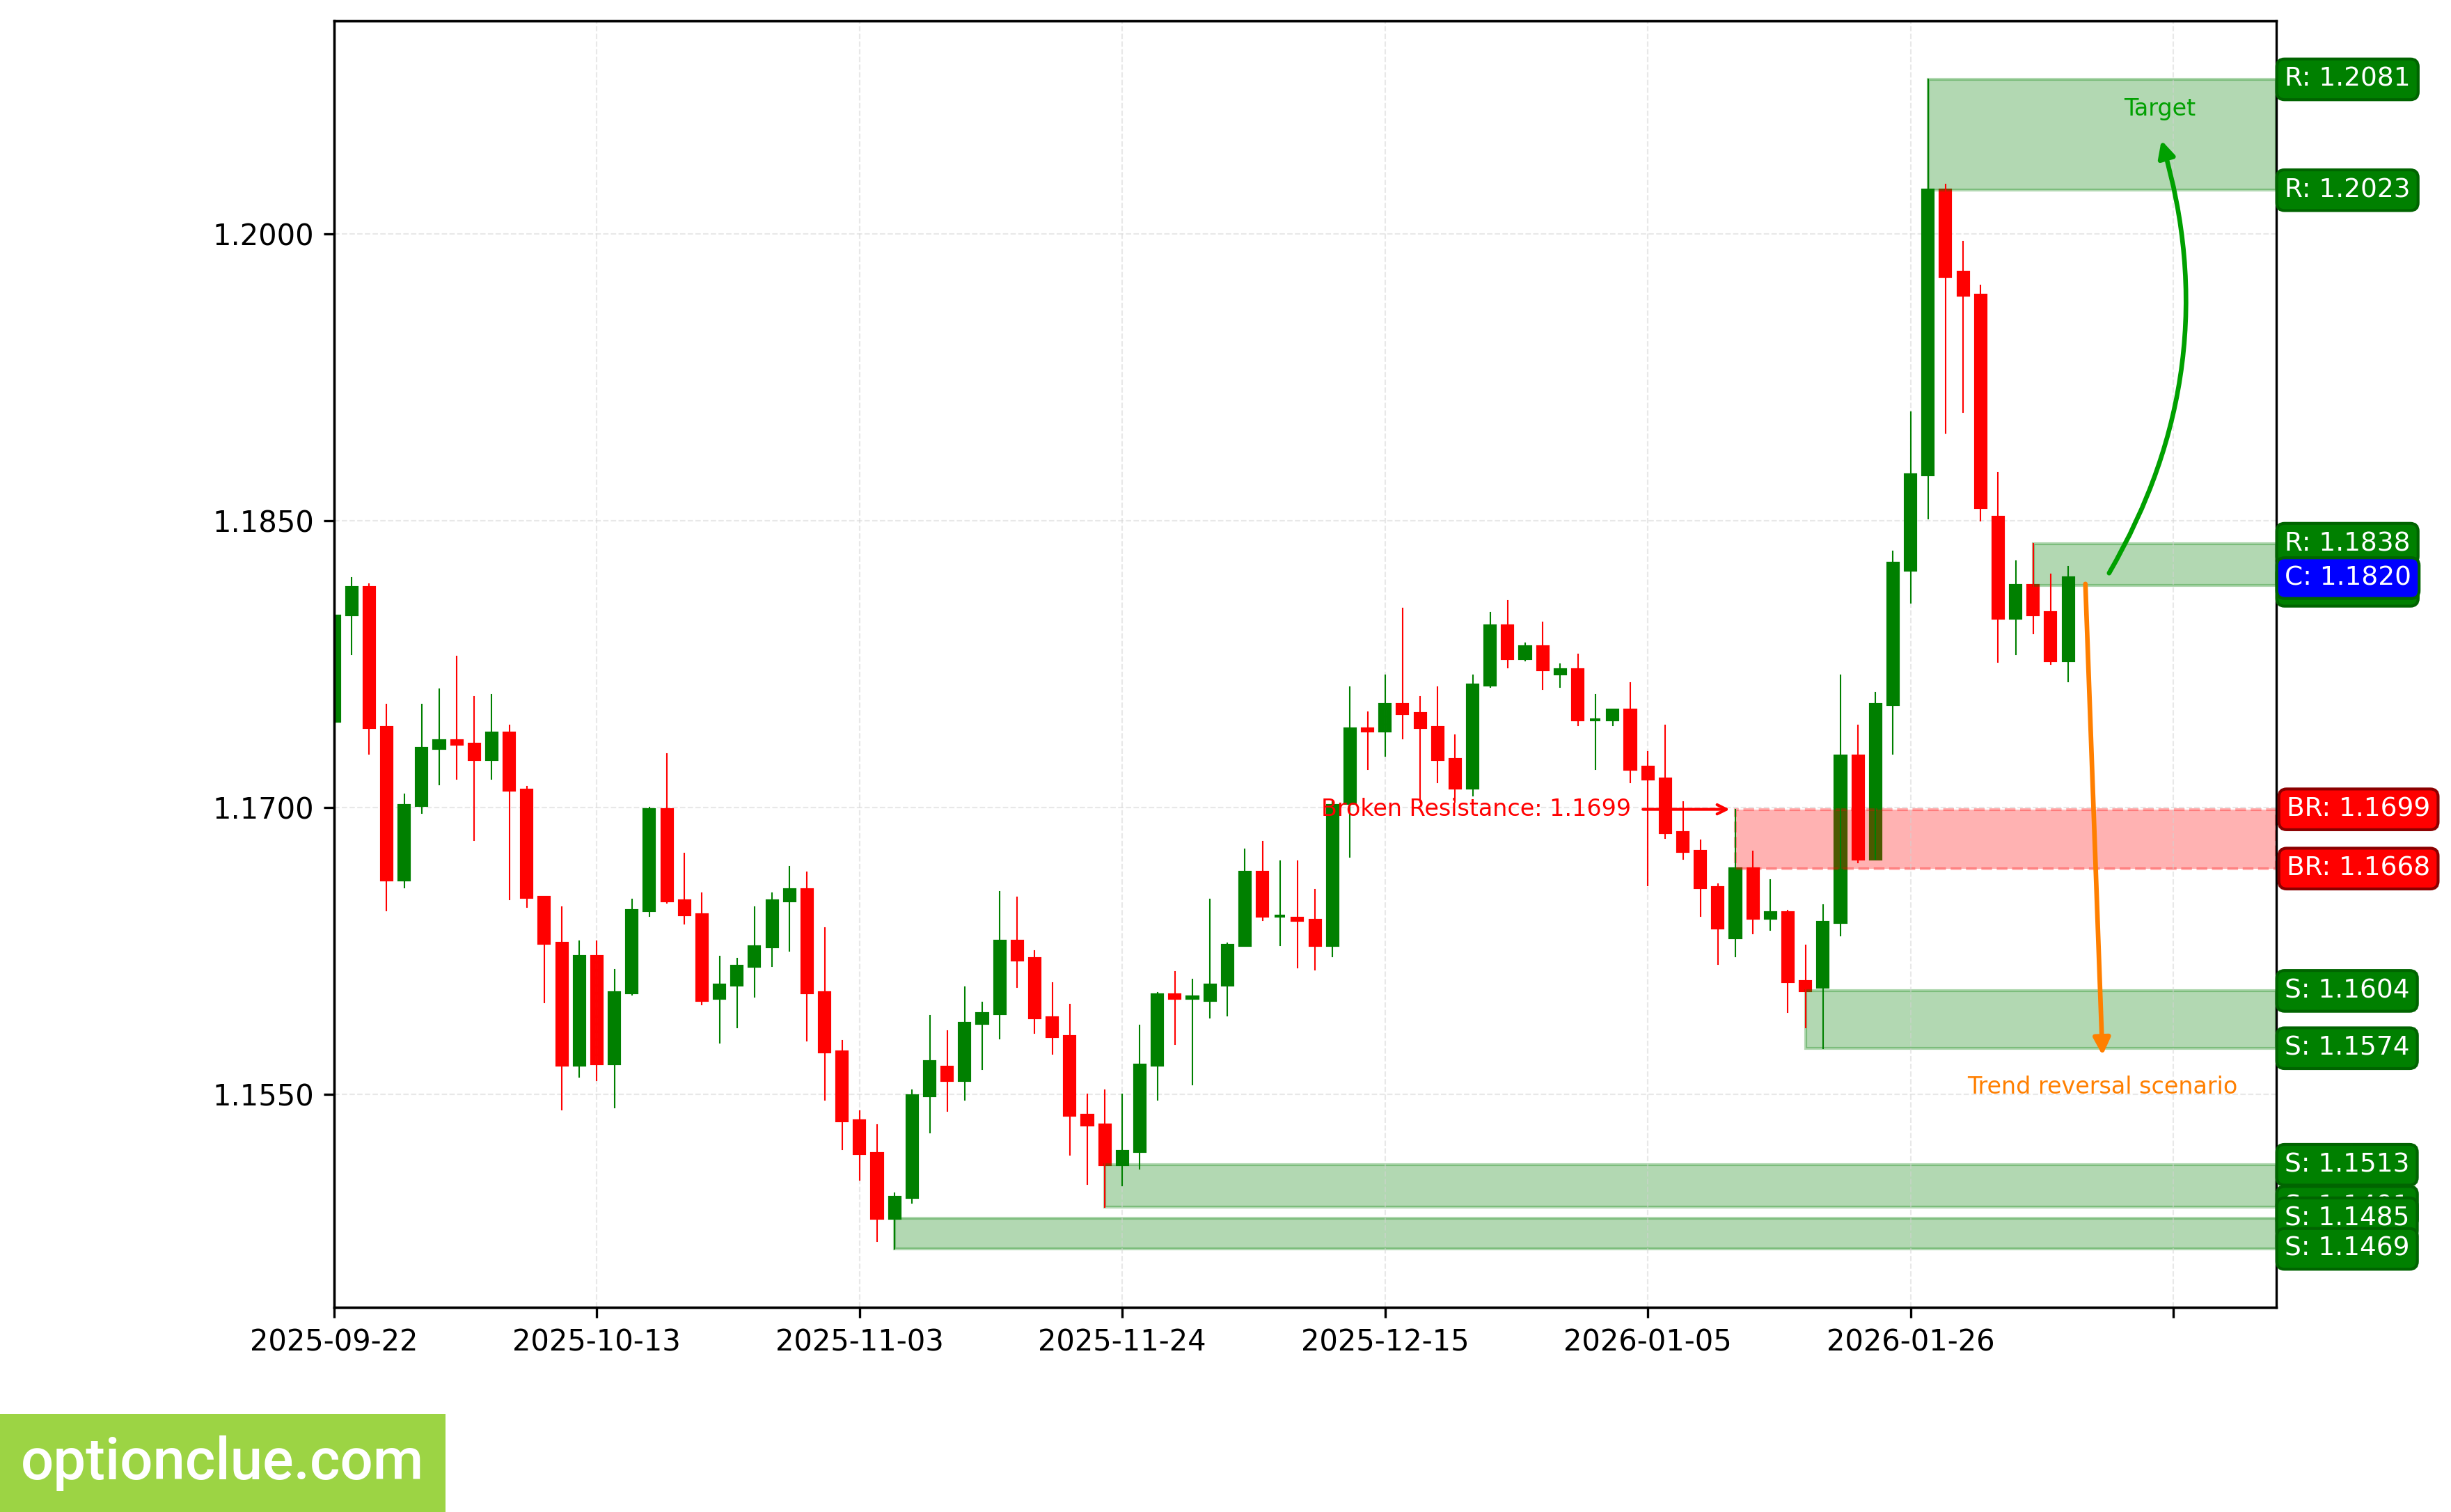
EURUSD. Technical analysis. D1.
British Pound (GBPUSD)
Trend has reversed to bearish, when the support level (1.3623 — 1.3673) was broken 2 candlesticks ago. A corrective wave is developing. An entry point for selling on rebound may form after the current correction completes.
Intermediate target for the downward movement is the support level with boundaries 1.3333 — 1.3372. In case of successful trend development, a further target will be at the support level with boundaries 1.3180 — 1.3209.
Potential profit/risk ratio from current prices when setting targets and fixing risks based on daily timeframe levels may be small (approximately 0.6:1). When using the further target — approximately 1.1:1. If the correction completes near the resistance level (1.3827 — 1.3868), the potential profit/risk ratio may be around 3.3:1. For the further target — around 4.5:1. If the correction completes near the last broken level (1.3623 — 1.3673), the potential profit/risk ratio may be small (around 0.8:1). When selecting the further target — approximately 1.3:1.
Short positions will remain relevant as long as the market remains below the nearest resistance level with boundaries 1.3827 — 1.3868. If the market successfully settles above this nearest resistance, the trend will reverse to the opposite (bullish).
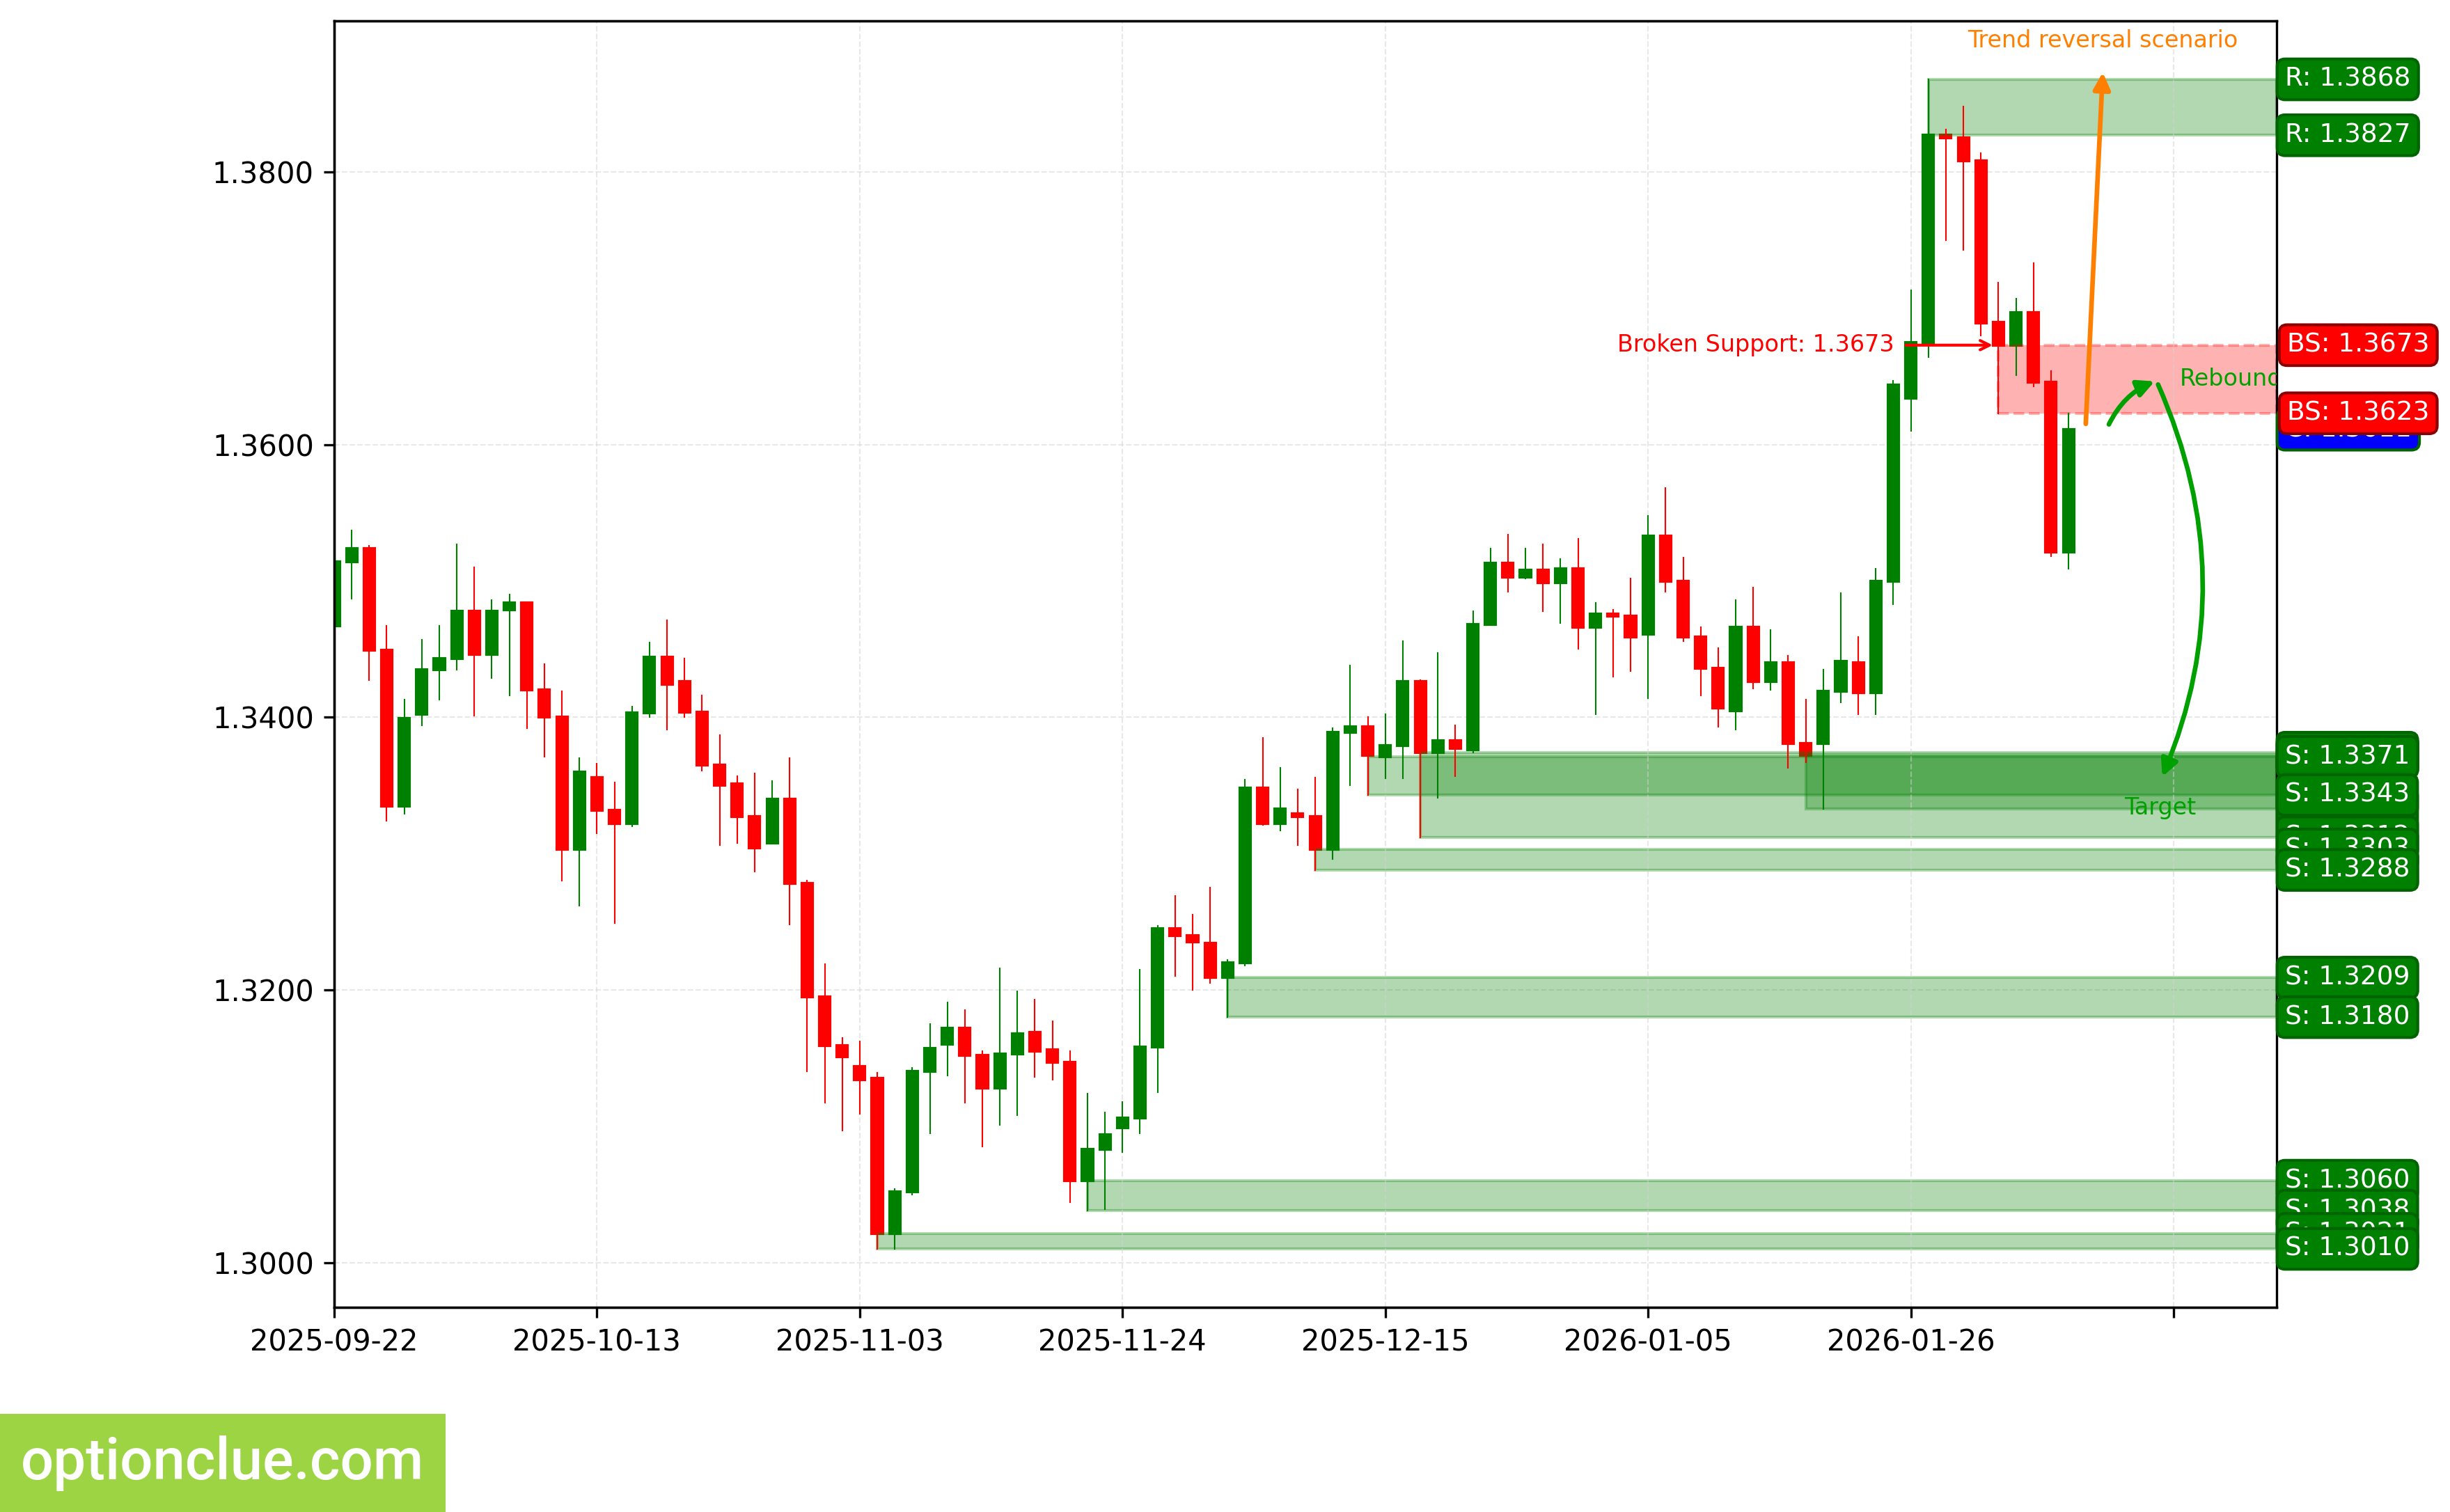
GBPUSD. Technical analysis. D1.
Japanese Yen (USDJPY)
Bearish trend continues, a corrective wave is developing. An entry point for selling on rebound may form after the current correction completes. The last broken level is support (157.98 — 157.98). The breakout occurred 11 candlesticks ago.
Intermediate target for the downward movement is the support level with boundaries 152.10 — 152.50. In case of successful trend development, a further target will be at the support level with boundaries 149.38 — 150.15.
Potential profit/risk ratio from current prices when setting targets and fixing risks based on daily timeframe levels may be approximately 1.3:1. When using the further target — around 1.9:1. If the correction completes near the resistance level (158.50 — 159.22), the potential profit/risk ratio may be approximately 3:1. When selecting the further target — more than 4:1. If the correction completes near the last broken level (157.98 — 157.98), the potential profit/risk ratio may be approximately 2:1. When assessing the further target — around 3:1.
Short positions will remain relevant as long as the market remains below the nearest resistance level with boundaries 158.50 — 159.22. If the market successfully settles above this nearest resistance, the trend will reverse to the opposite (bullish).
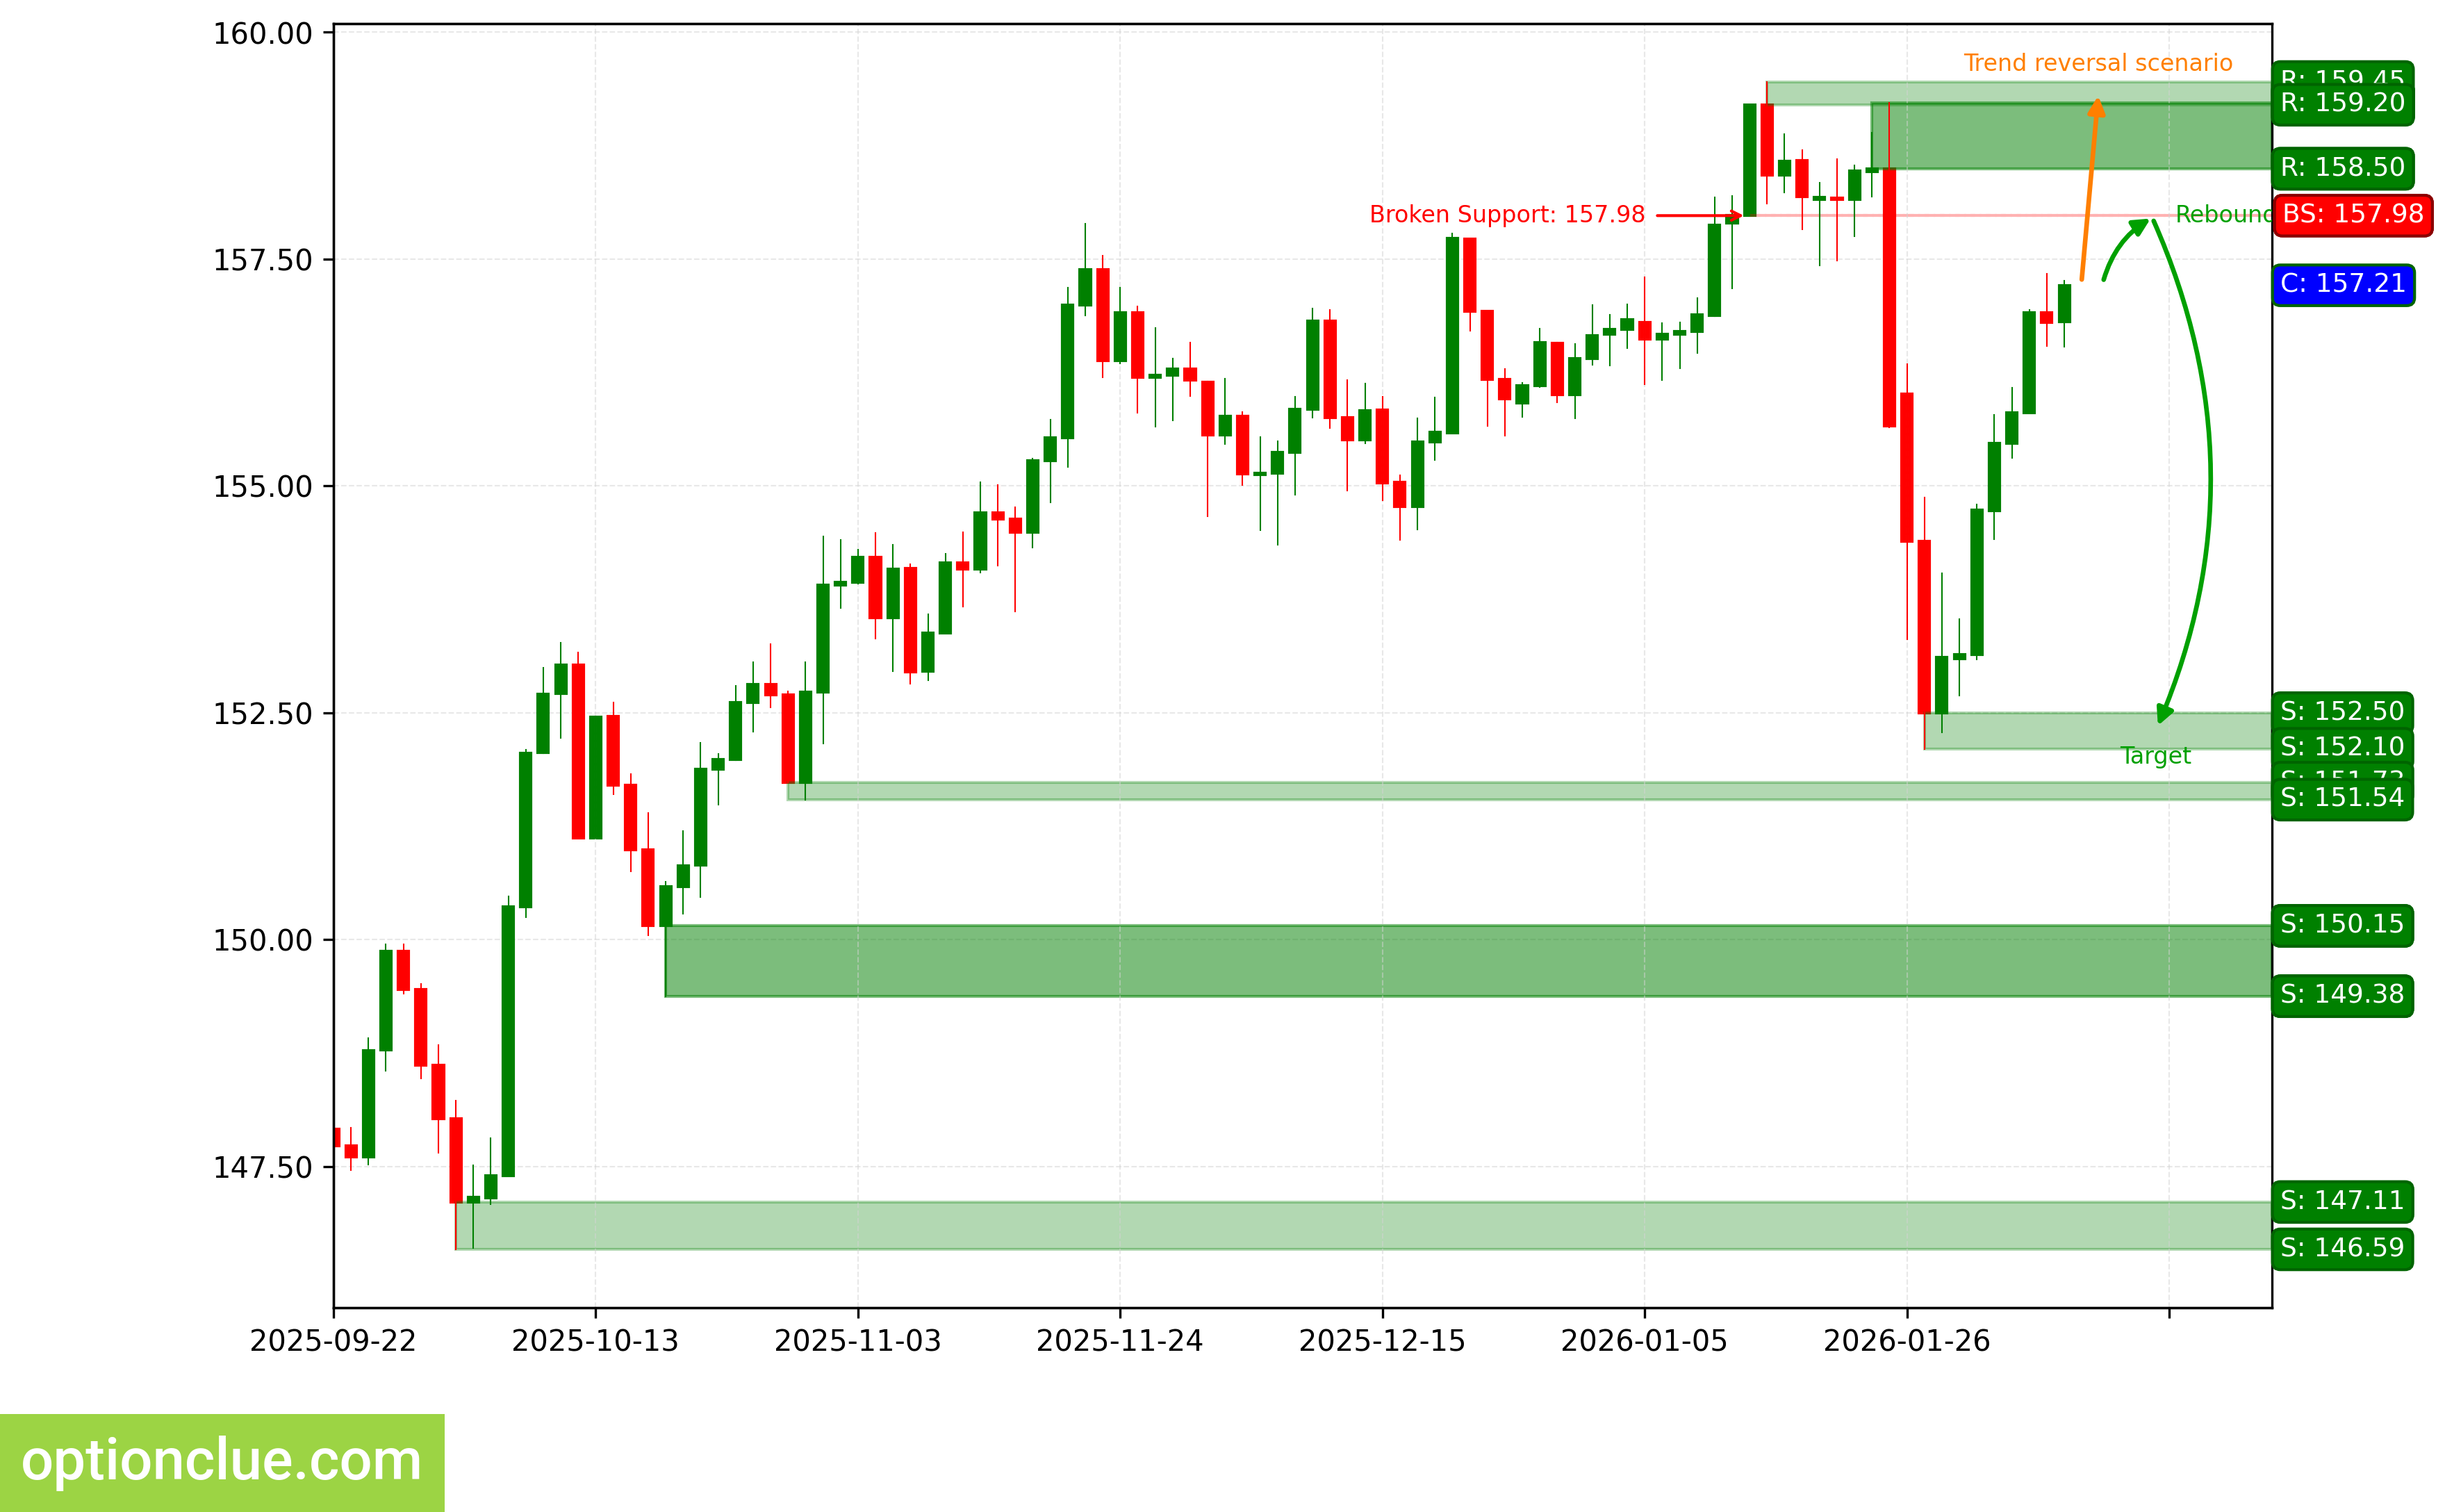
USDJPY. Technical analysis. D1.
Canadian Dollar (USDCAD)
Bearish trend continues, a corrective wave is developing again. An entry point for selling on rebound may form after the current correction completes. The last broken level is support (1.3854 — 1.3872). The breakout occurred 14 candlesticks ago.
Intermediate target for the downward movement is the support level with boundaries 1.3627 — 1.3638. In case of successful trend development, a further target will be at the support level with boundaries 1.3479 — 1.3490.
If the new correction completes near the resistance level (1.3916 — 1.3928), the potential profit/risk ratio may be more than 2:1. When using the further target — around 4:1. If the correction completes near the last broken level (1.3854 — 1.3872), the potential profit/risk ratio may be around 1.3:1. When selecting the further target — approximately 2:1.
Short positions will remain relevant as long as the market remains below the nearest resistance level with boundaries 1.3916 — 1.3928. If the market successfully settles above this nearest resistance, the trend will reverse to the opposite (bullish).
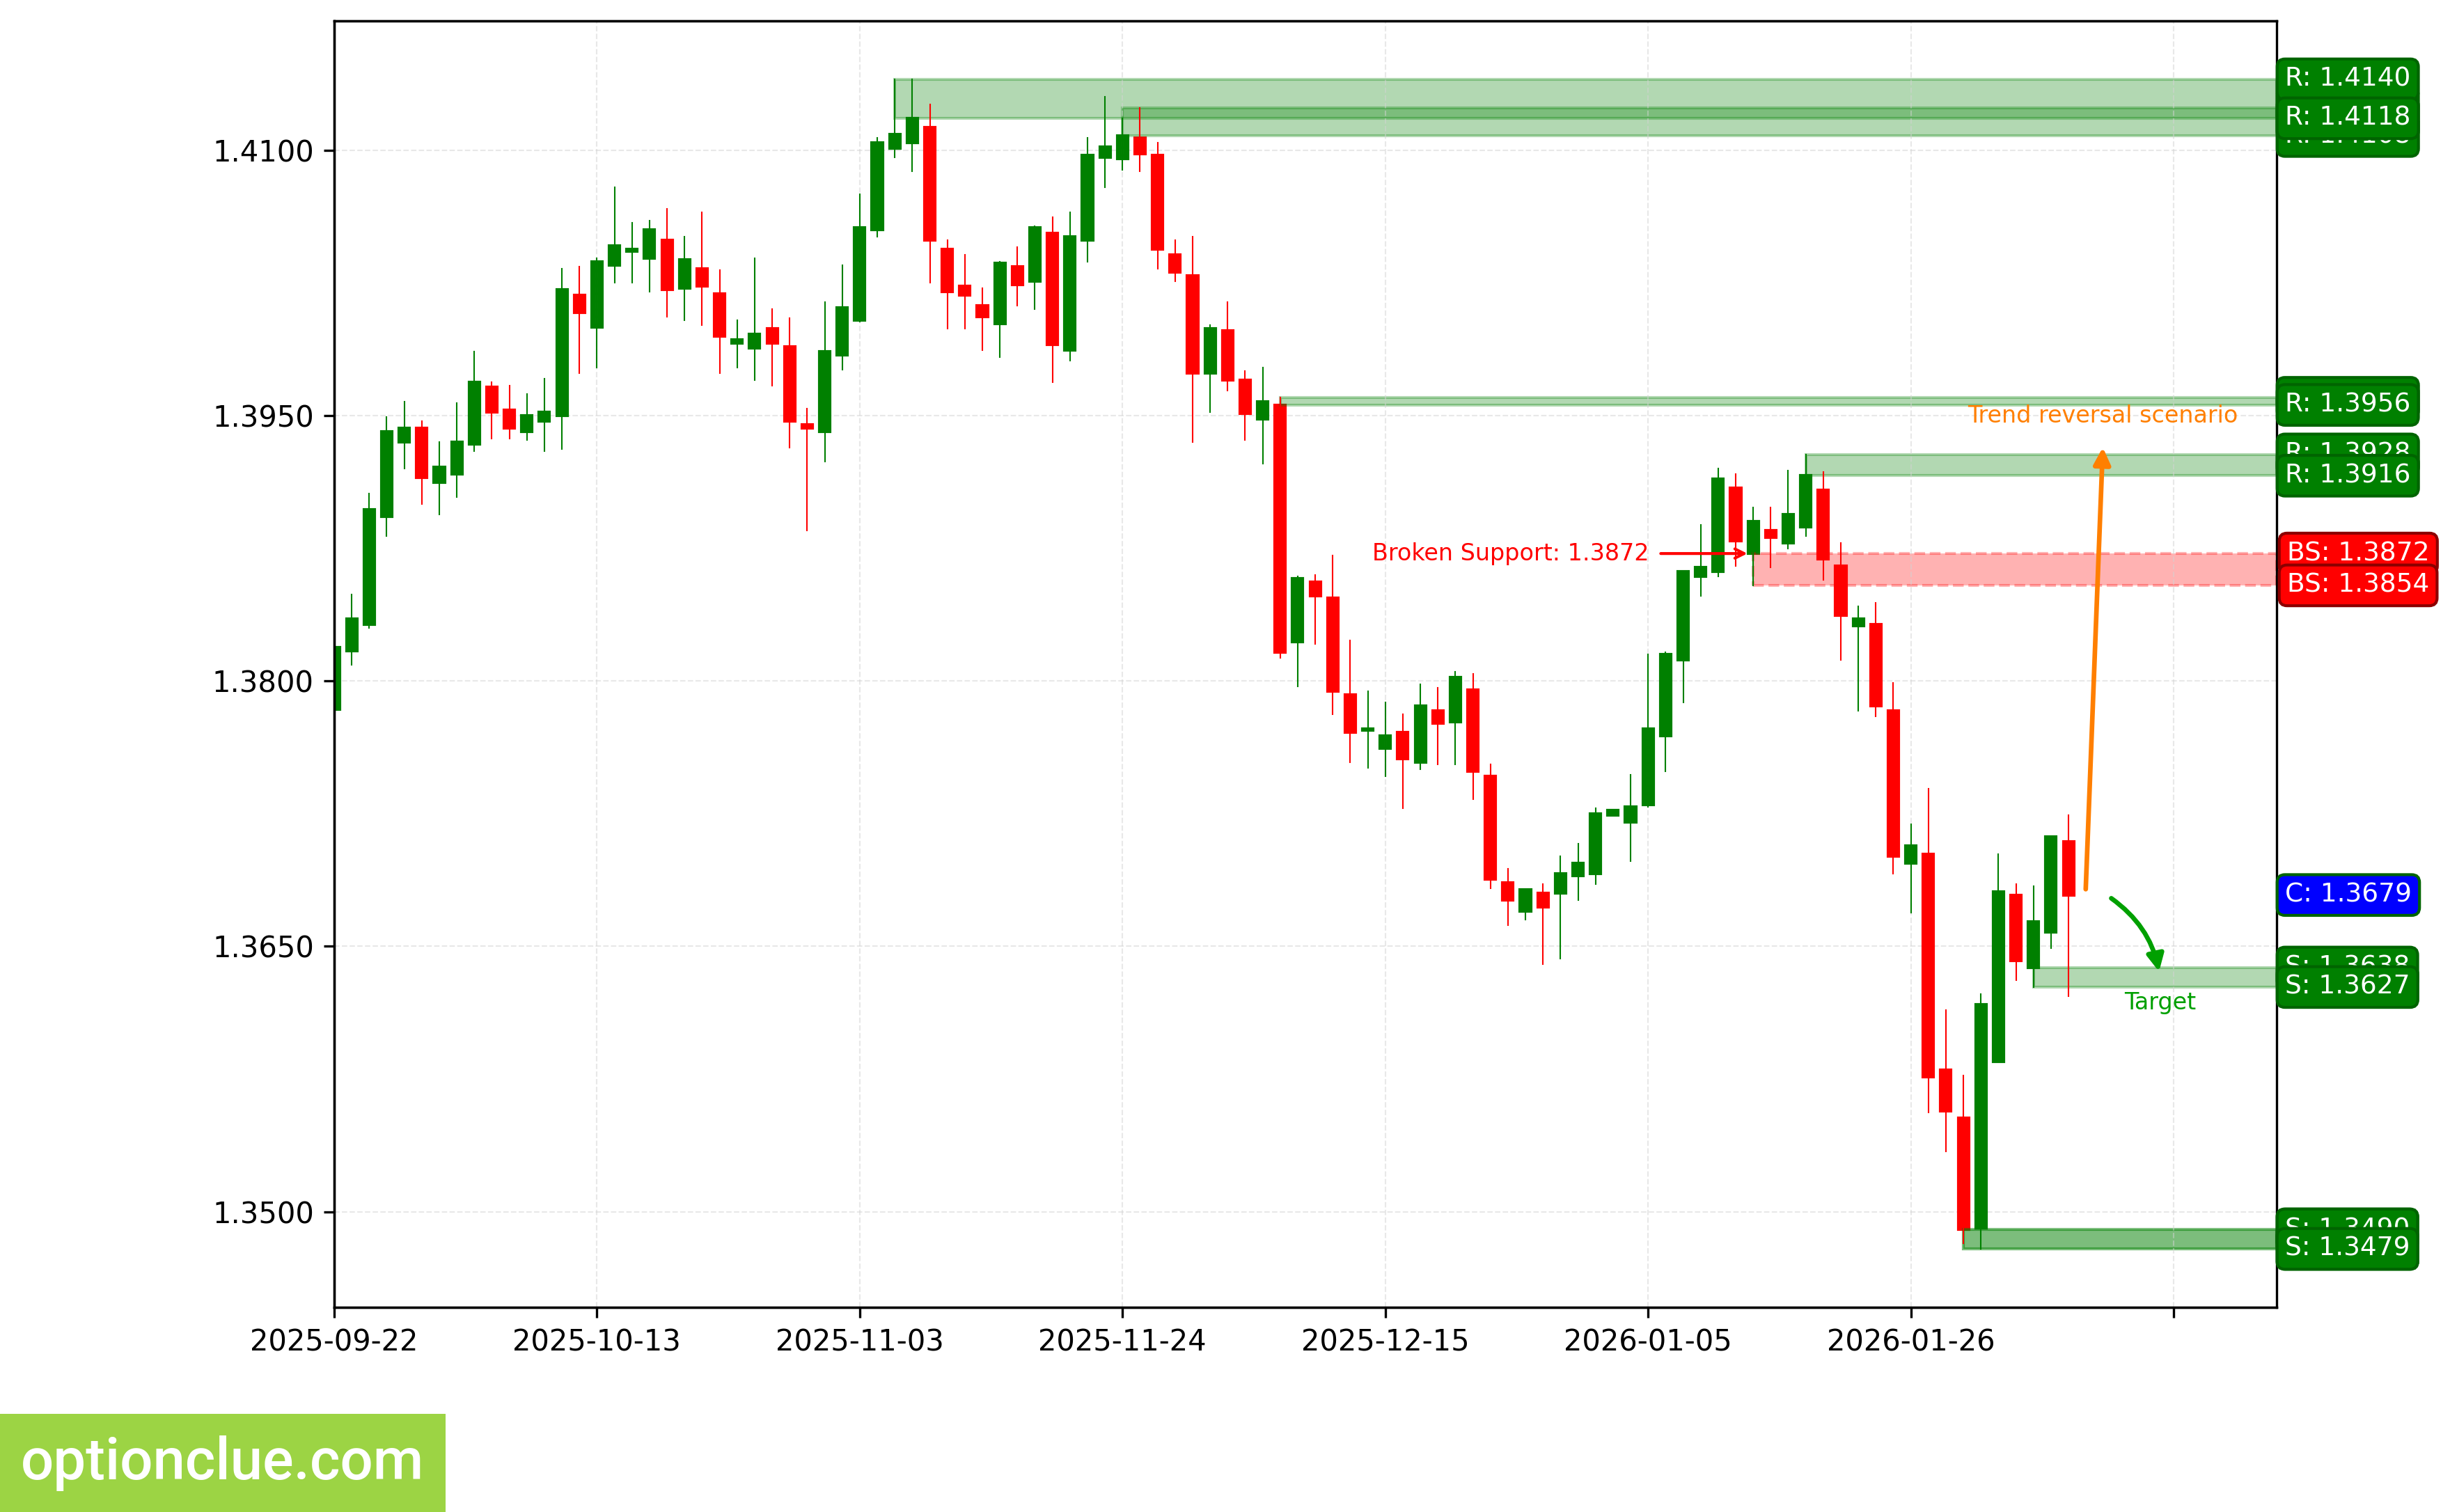
USDCAD. Technical analysis. D1.
Australian Dollar (AUDUSD)
Bullish trend continues, an impulse wave is developing. The last broken level is resistance (0.6711 — 0.6725). The breakout occurred 14 candlesticks ago.
Intermediate target for the upward movement is the resistance level with boundaries 0.7023 — 0.7050.
Potential profit/risk ratio from current prices when setting targets and fixing risks based on daily timeframe levels may be less than 0.1:1. If the next correction completes near the support level (0.6895 — 0.6925), the potential profit/risk ratio may be around 1.1:1.
Long positions will remain relevant as long as the market is above the nearest support level with boundaries 0.6895 — 0.6925. If the market successfully settles below this support, the trend will reverse to the opposite (bearish).
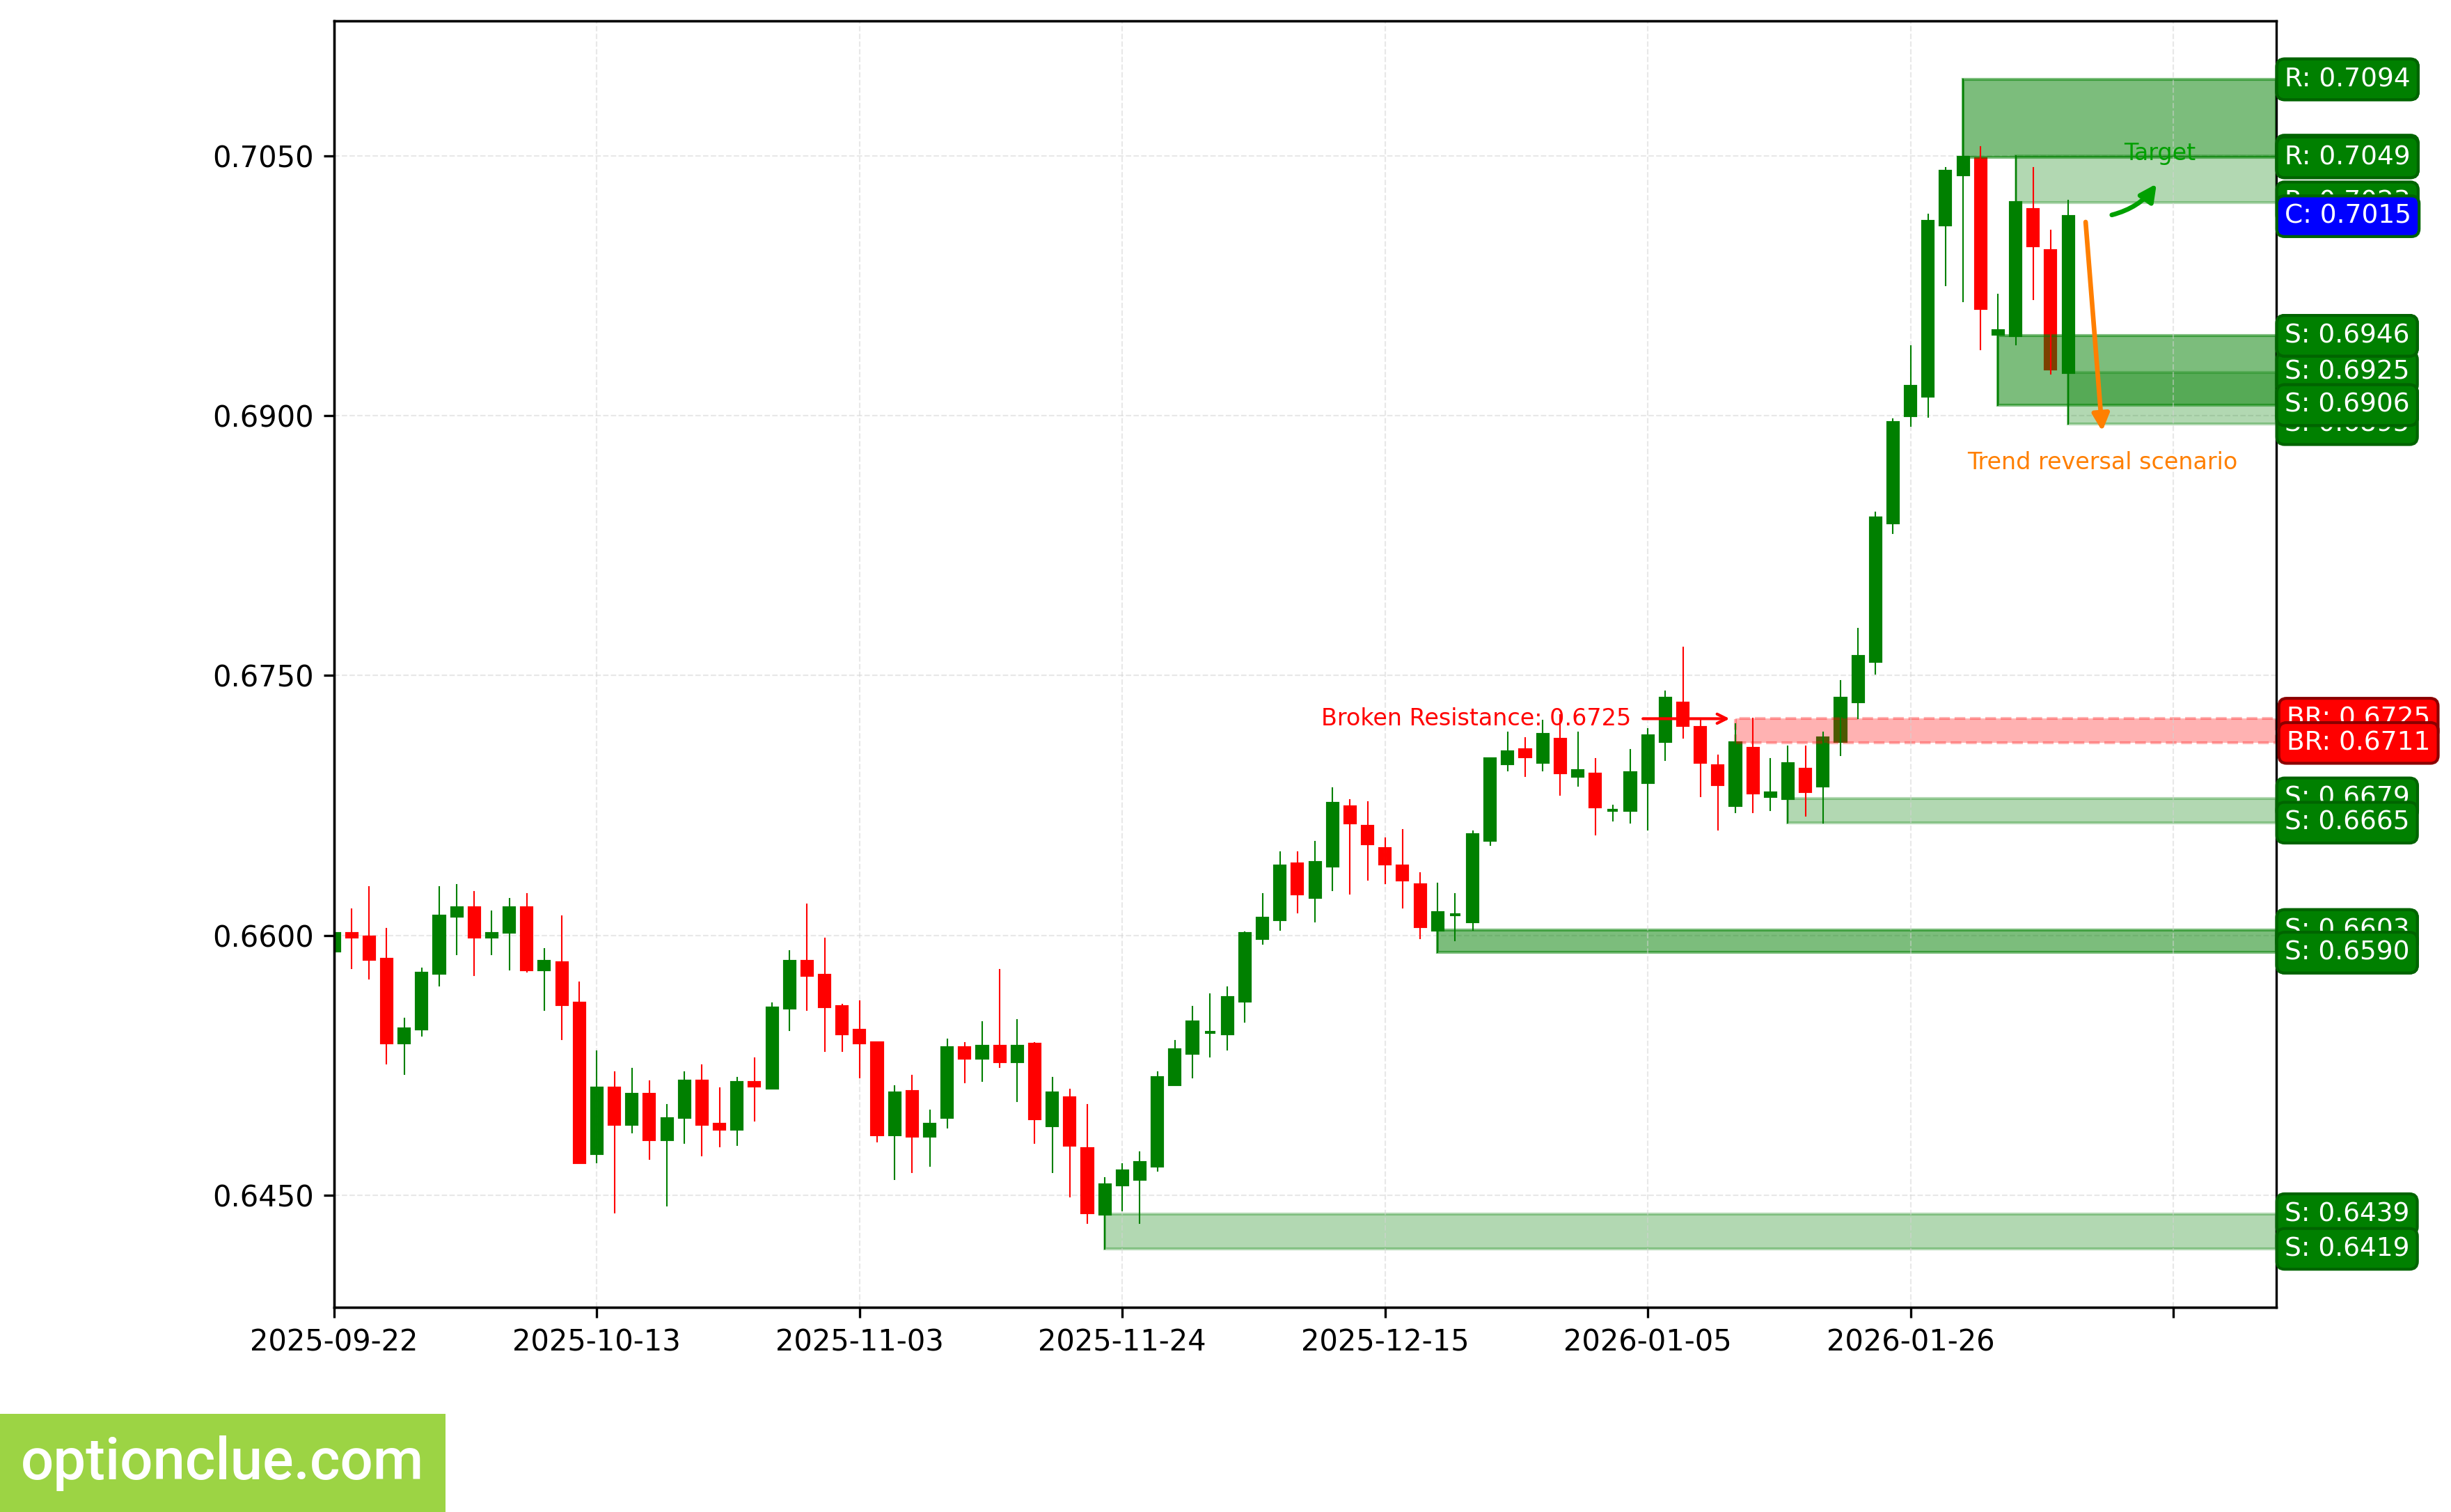
AUDUSD. Technical analysis. D1.
Bitcoin (BTC)
Bearish trend continues, a corrective wave is developing. An entry point for selling on rebound may form after the current correction completes. The last broken level is support (86004 — 86567). The breakout occurred 9 candlesticks ago.
Intermediate target for the downward movement is the support level with boundaries 60074 — 62702.
Potential profit/risk ratio from current prices when setting targets and fixing risks based on daily timeframe levels may be small (around 0.3:1). If the new correction completes near the resistance level (89185 — 90439), the potential profit/risk ratio may be more than 4:1. If the correction completes near the last broken level (86004 — 86567), the potential profit/risk ratio may be more than 2:1.
Short positions will remain relevant as long as the market remains below the nearest resistance level with boundaries 89185 — 90439. If the market successfully settles above this nearest resistance, the trend will reverse to the opposite (bullish).
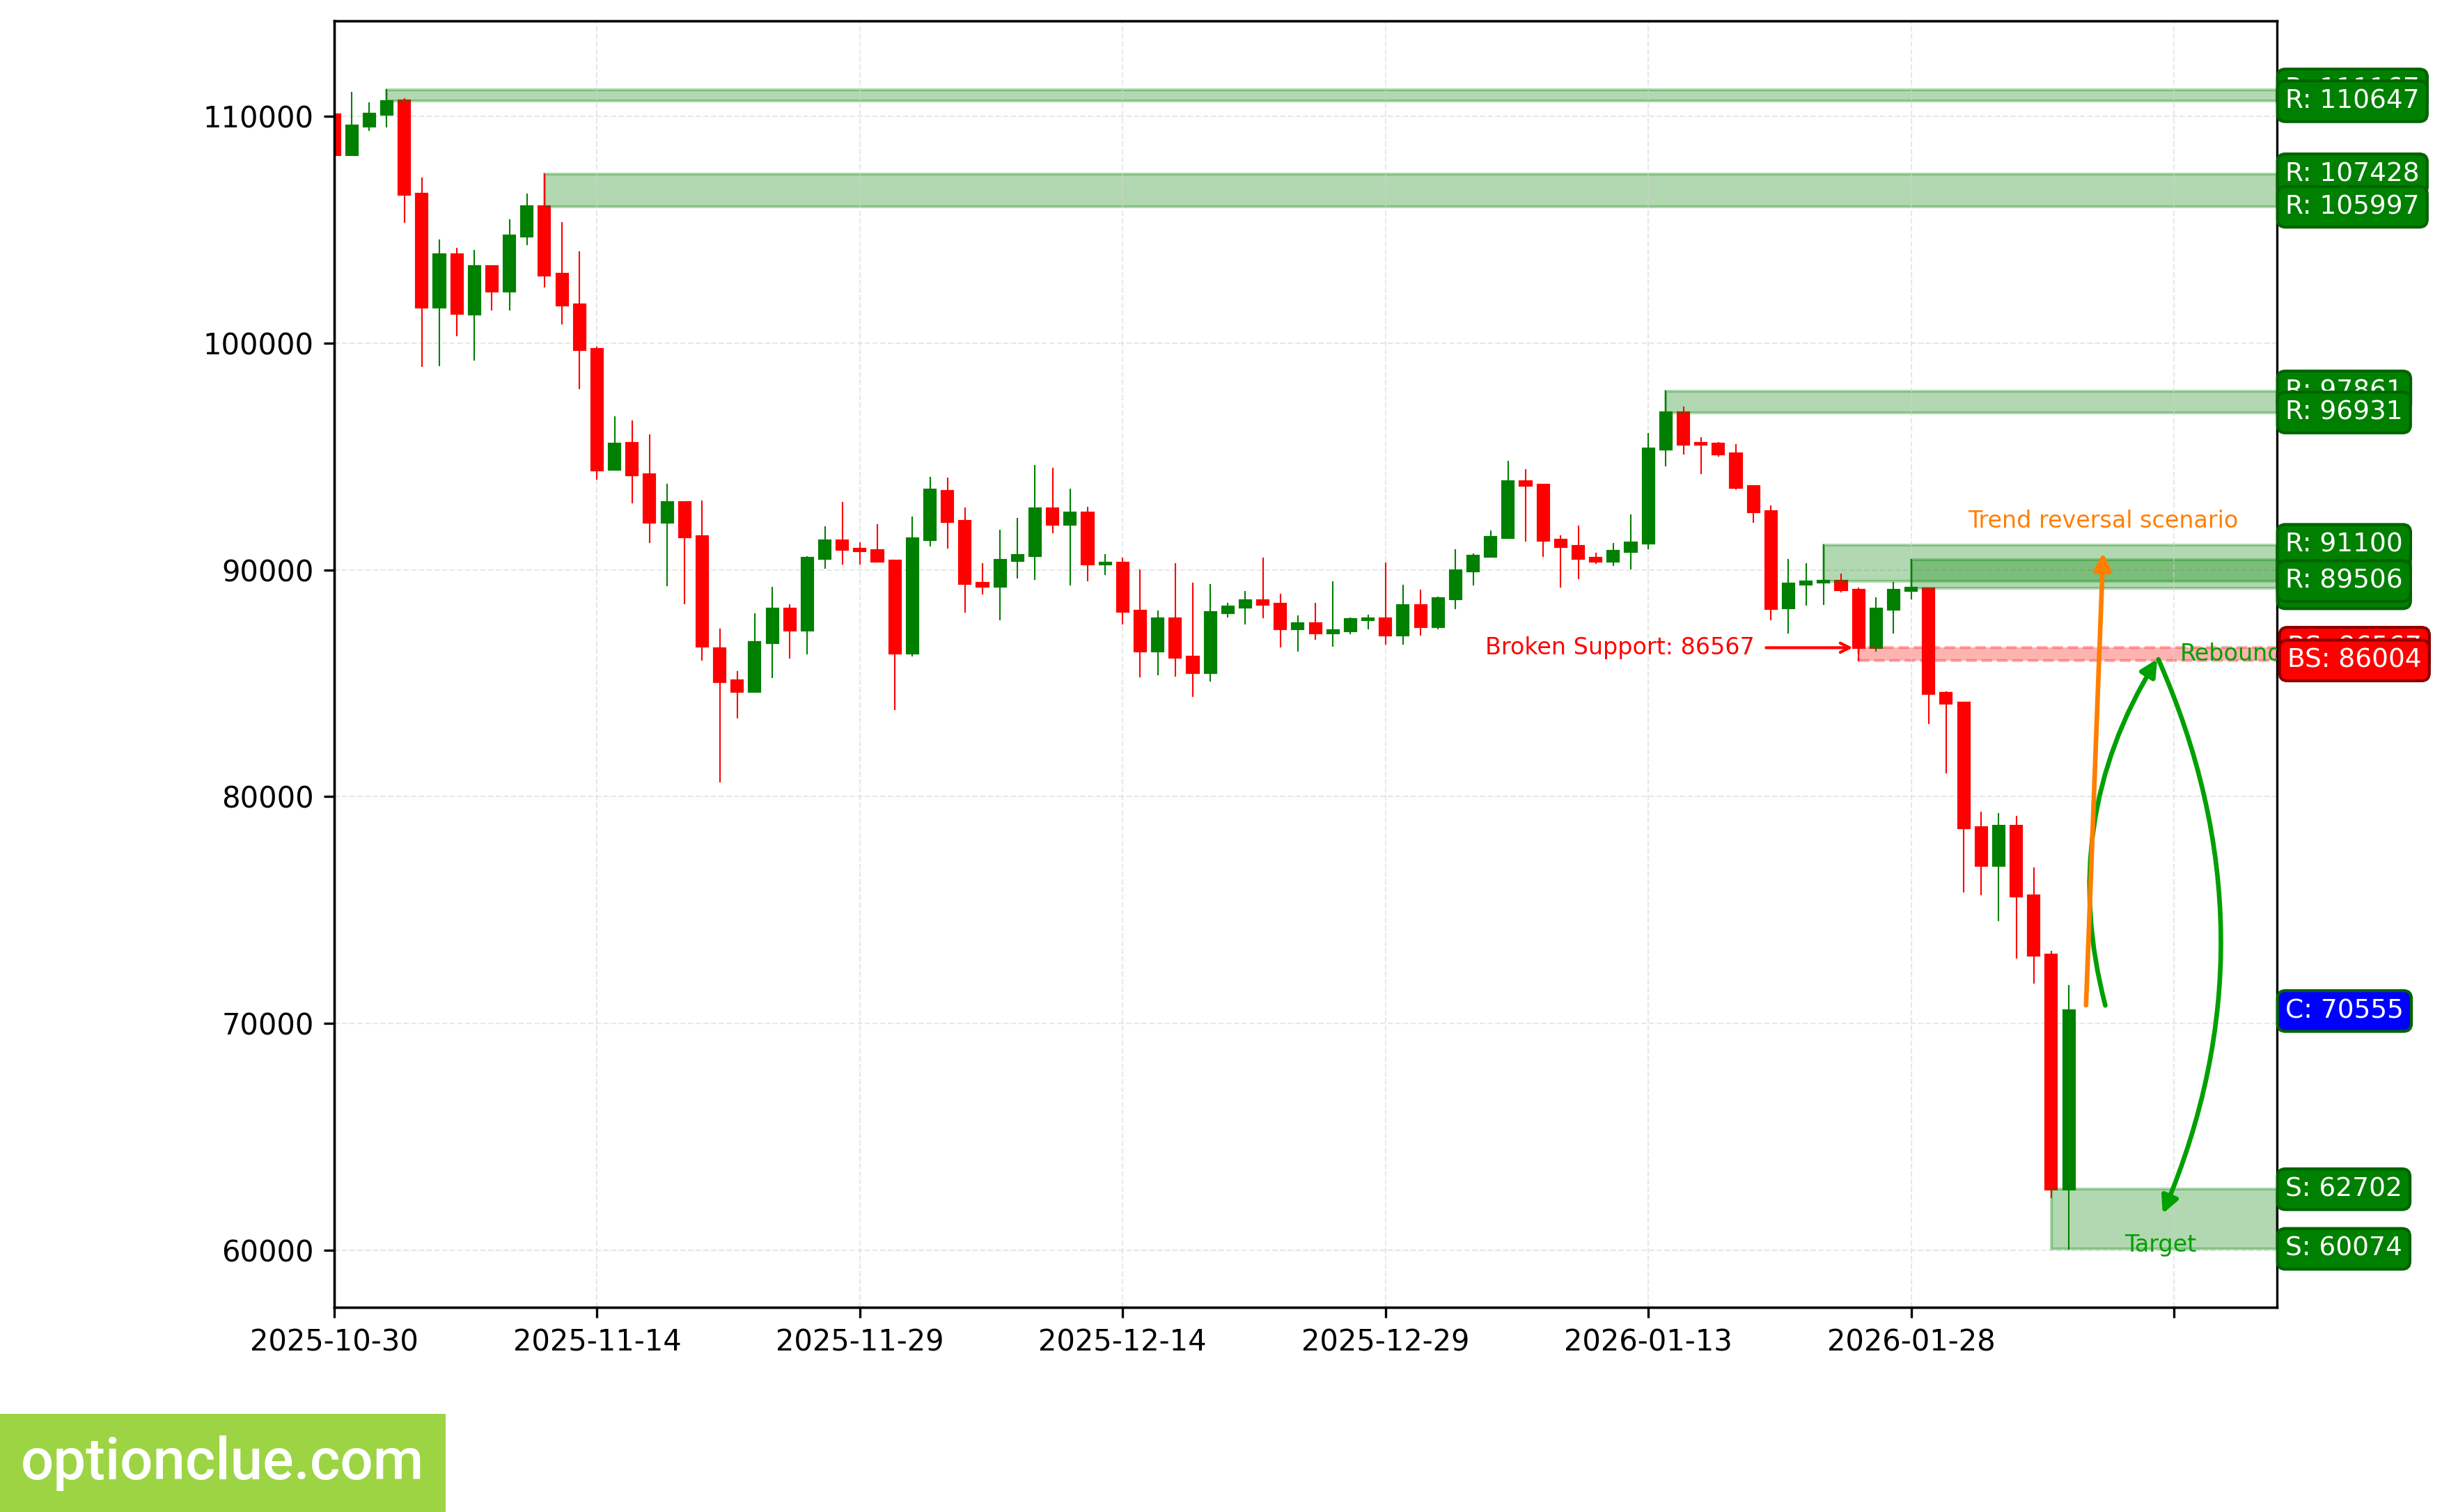
BTC. Technical analysis. D1.
Ether (ETH)
Bearish trend continues, a corrective wave is developing. An entry point for selling on rebound may form after the current correction completes. The last broken level is support (2786 — 2816). The breakout occurred 8 candlesticks ago.
Intermediate target for the downward movement is the support level with boundaries 1753 — 1812.
Potential profit/risk ratio from current prices when setting targets and fixing risks based on daily timeframe levels may be small (around 0.2:1). If the correction completes near the resistance level (3022 — 3041), the potential profit/risk ratio may be around 5:1. If the correction completes near the last broken level (2786 — 2816), the potential profit/risk ratio may be approximately 2:1.
Short positions will remain relevant as long as the market remains below the nearest resistance level with boundaries 3022 — 3041. If the market successfully settles above this nearest resistance, the trend will reverse to the opposite (bullish).
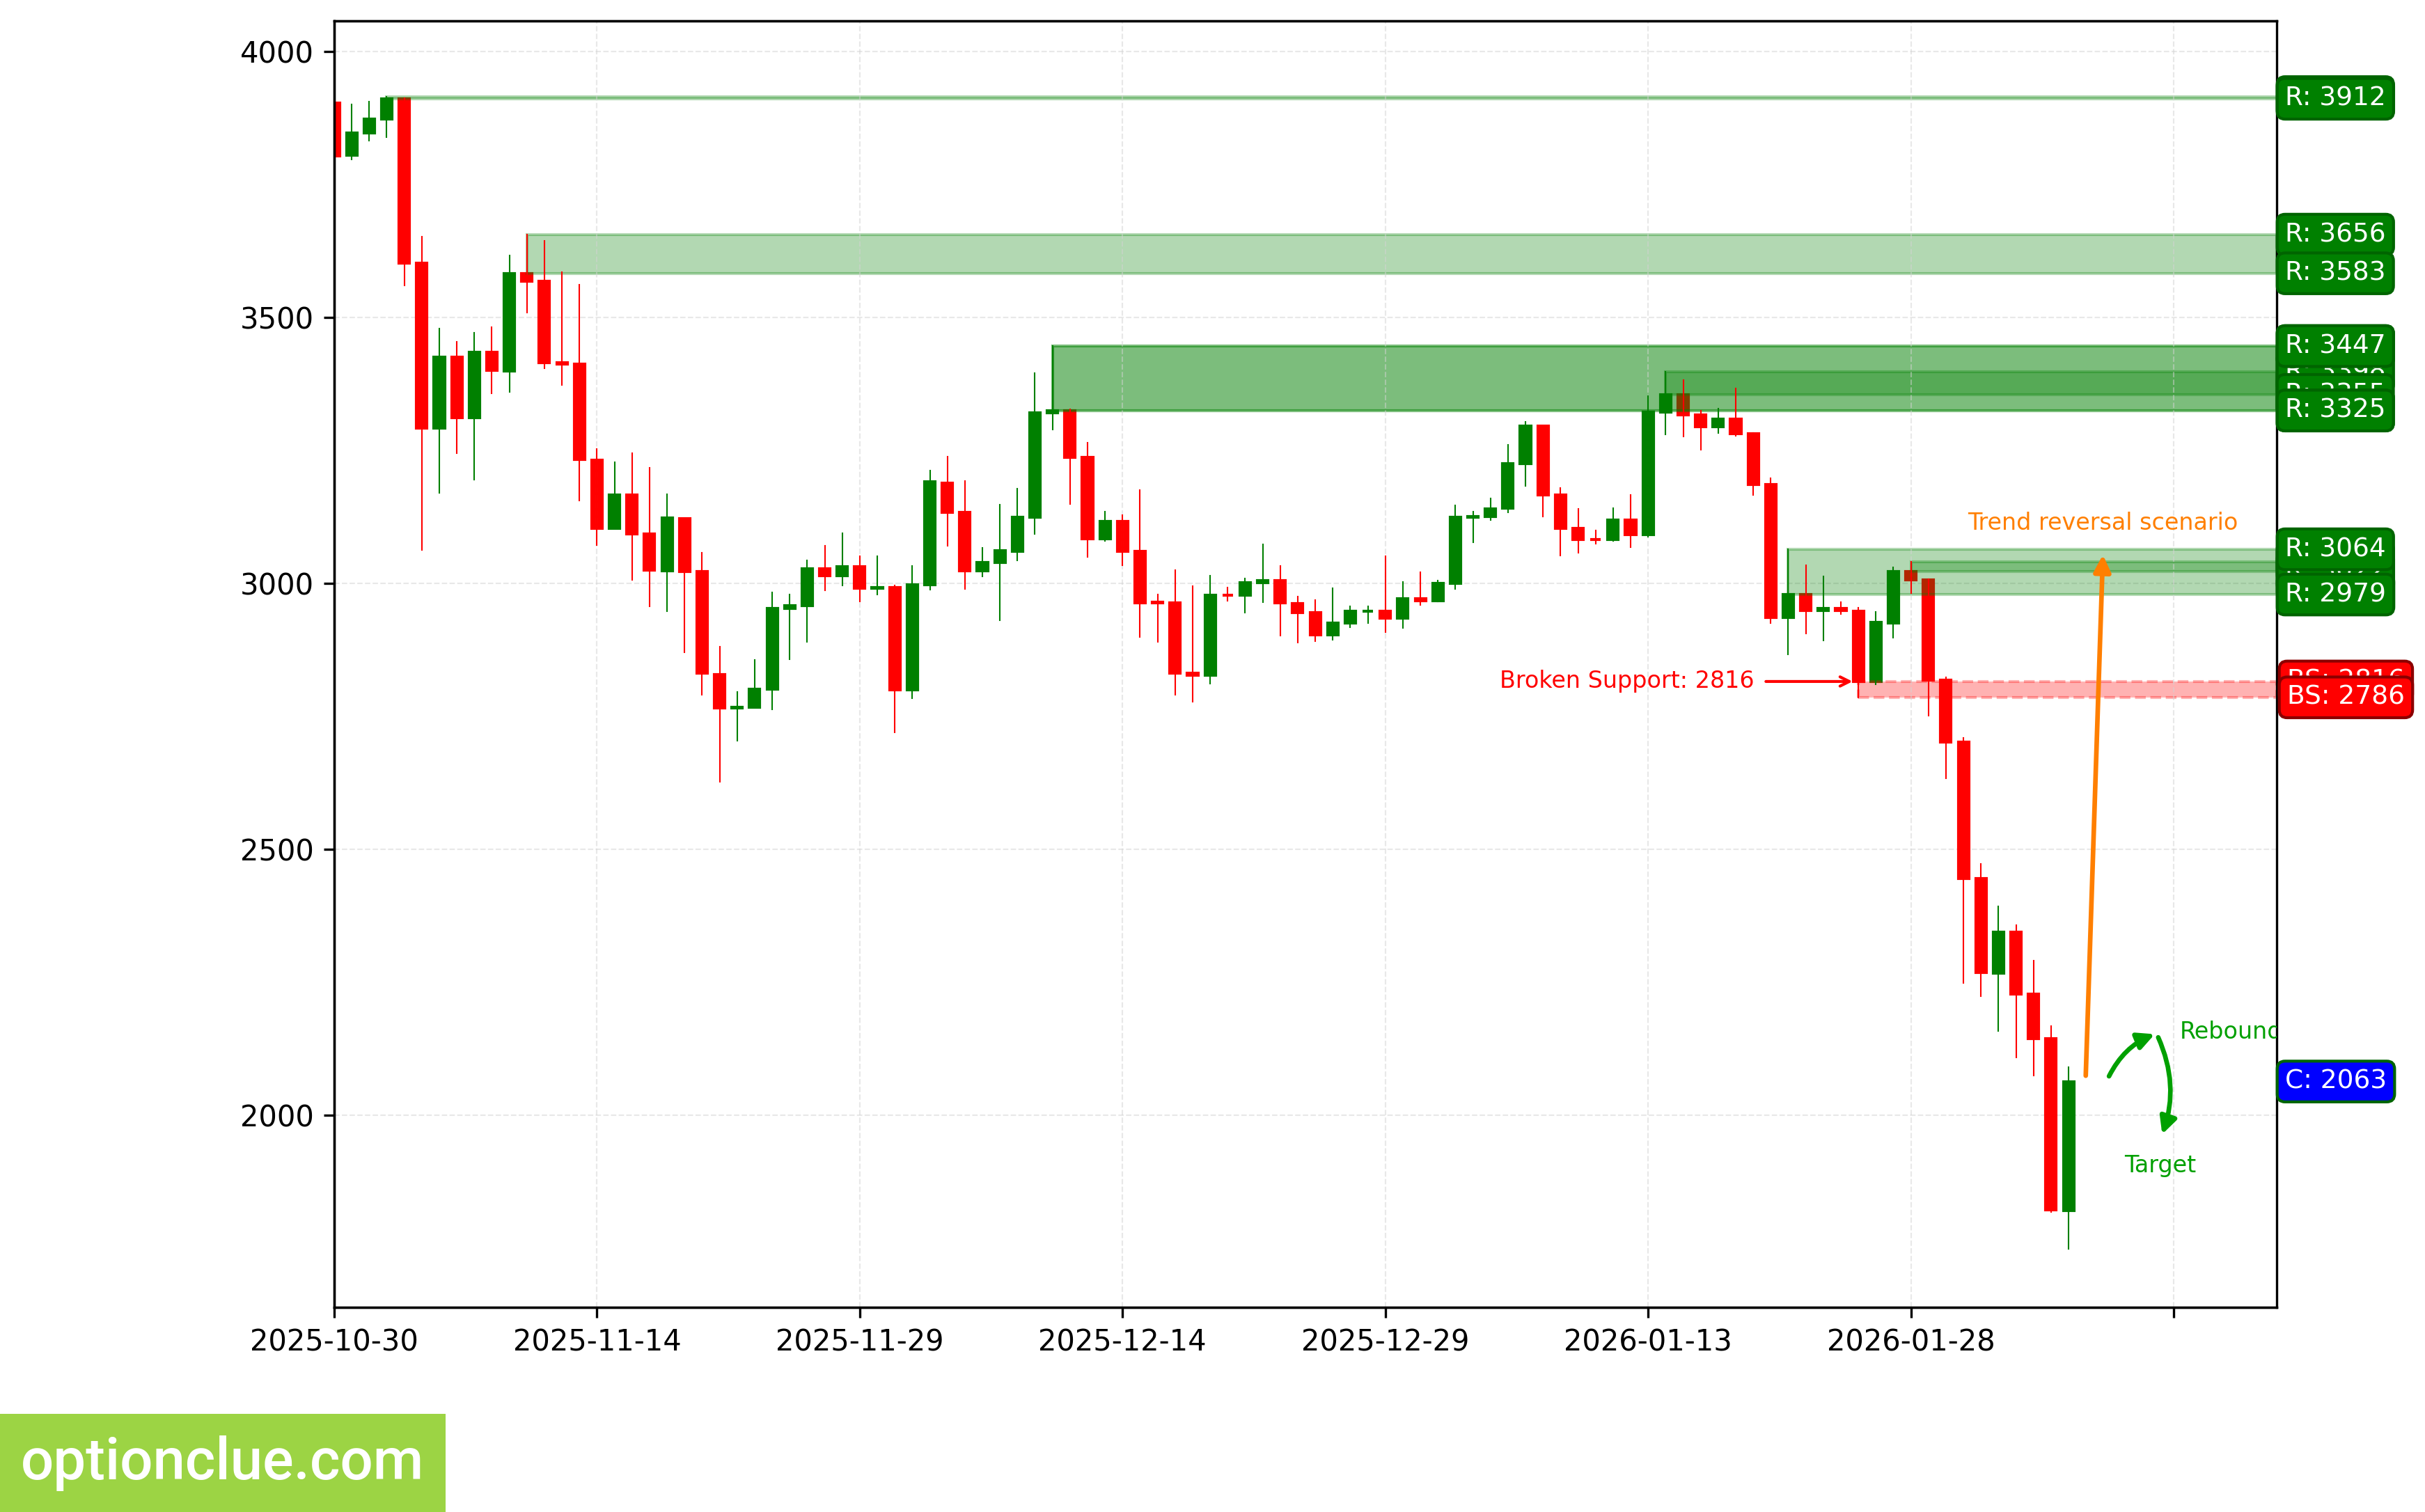
ETH. Technical analysis. D1.
Apple Inc (AAPL)
Trend has reversed to bullish 5 candlesticks ago, when the resistance level (259.17 — 261.95) was broken. A corrective wave is developing. An entry point for buying on rebound may form after the current correction completes.
Intermediate target for the upward movement is the resistance level with boundaries 286.20 — 288.62.
Potential profit/risk ratio from current prices when setting targets and fixing risks based on daily timeframe levels may be small (approximately 0.6:1). If the correction completes near the support level (272.29), the potential profit/risk ratio may be around 1.9:1.
Long positions will remain relevant as long as the market is above the nearest support level 272.29. If the market successfully settles below the nearest support (272.29), the trend will reverse to the opposite (bearish).
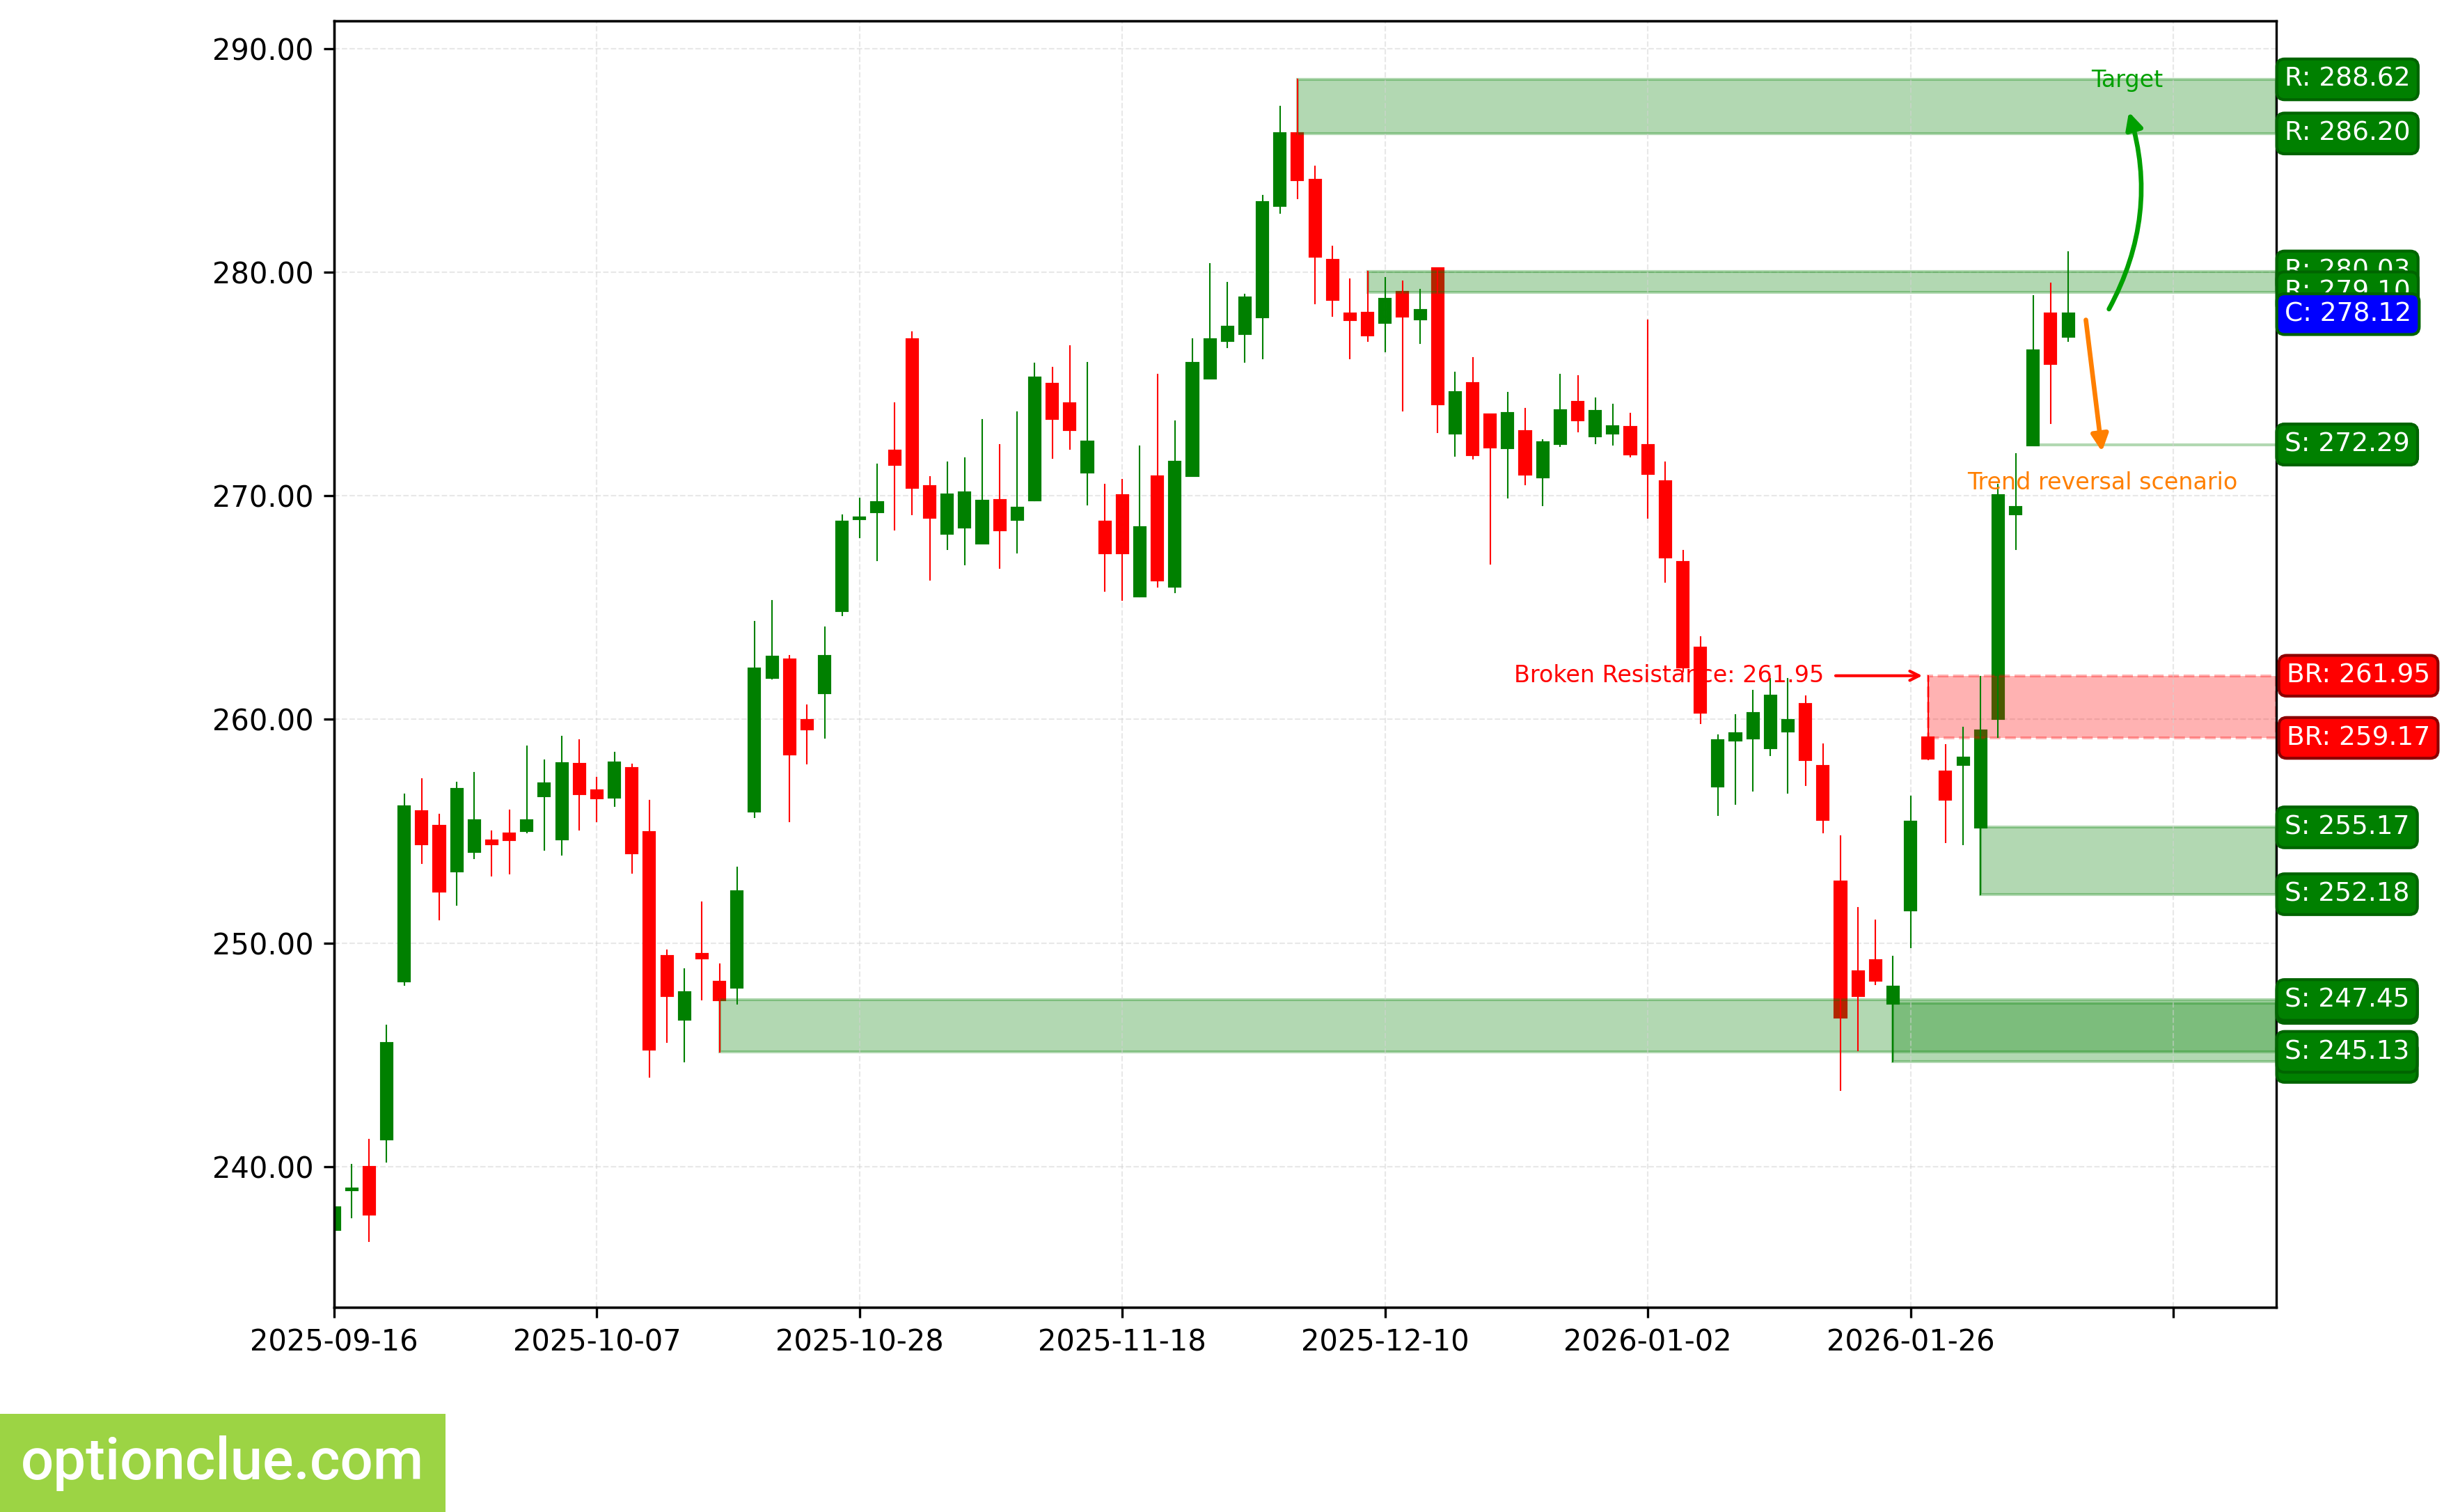
AAPL. Technical analysis. D1.
NVIDIA Corp (NVDA)
Bearish trend continues, a corrective wave is developing. An entry point for selling on rebound may form after the current correction completes. The last broken level is support (177.61 — 178.07). The breakout occurred 3 candlesticks ago.
Intermediate target for the downward movement is the support level with boundaries 170.31 — 170.94. In case of successful trend development, a further target will be at the support level with boundaries 164.07 — 167.02.
Potential profit/risk ratio from current prices when setting targets and fixing risks based on daily timeframe levels may be small (approximately 0.9:1). When using the further target — around 1.2:1. If the correction completes near the resistance level (192.51 — 194.49), the potential profit/risk ratio may be around 2.9:1. When selecting the further target — approximately 3.4:1.
Short positions will remain relevant as long as the market remains below the nearest resistance level with boundaries 192.51 — 194.49. If the market successfully settles above this nearest resistance, the trend will reverse to the opposite (bullish).
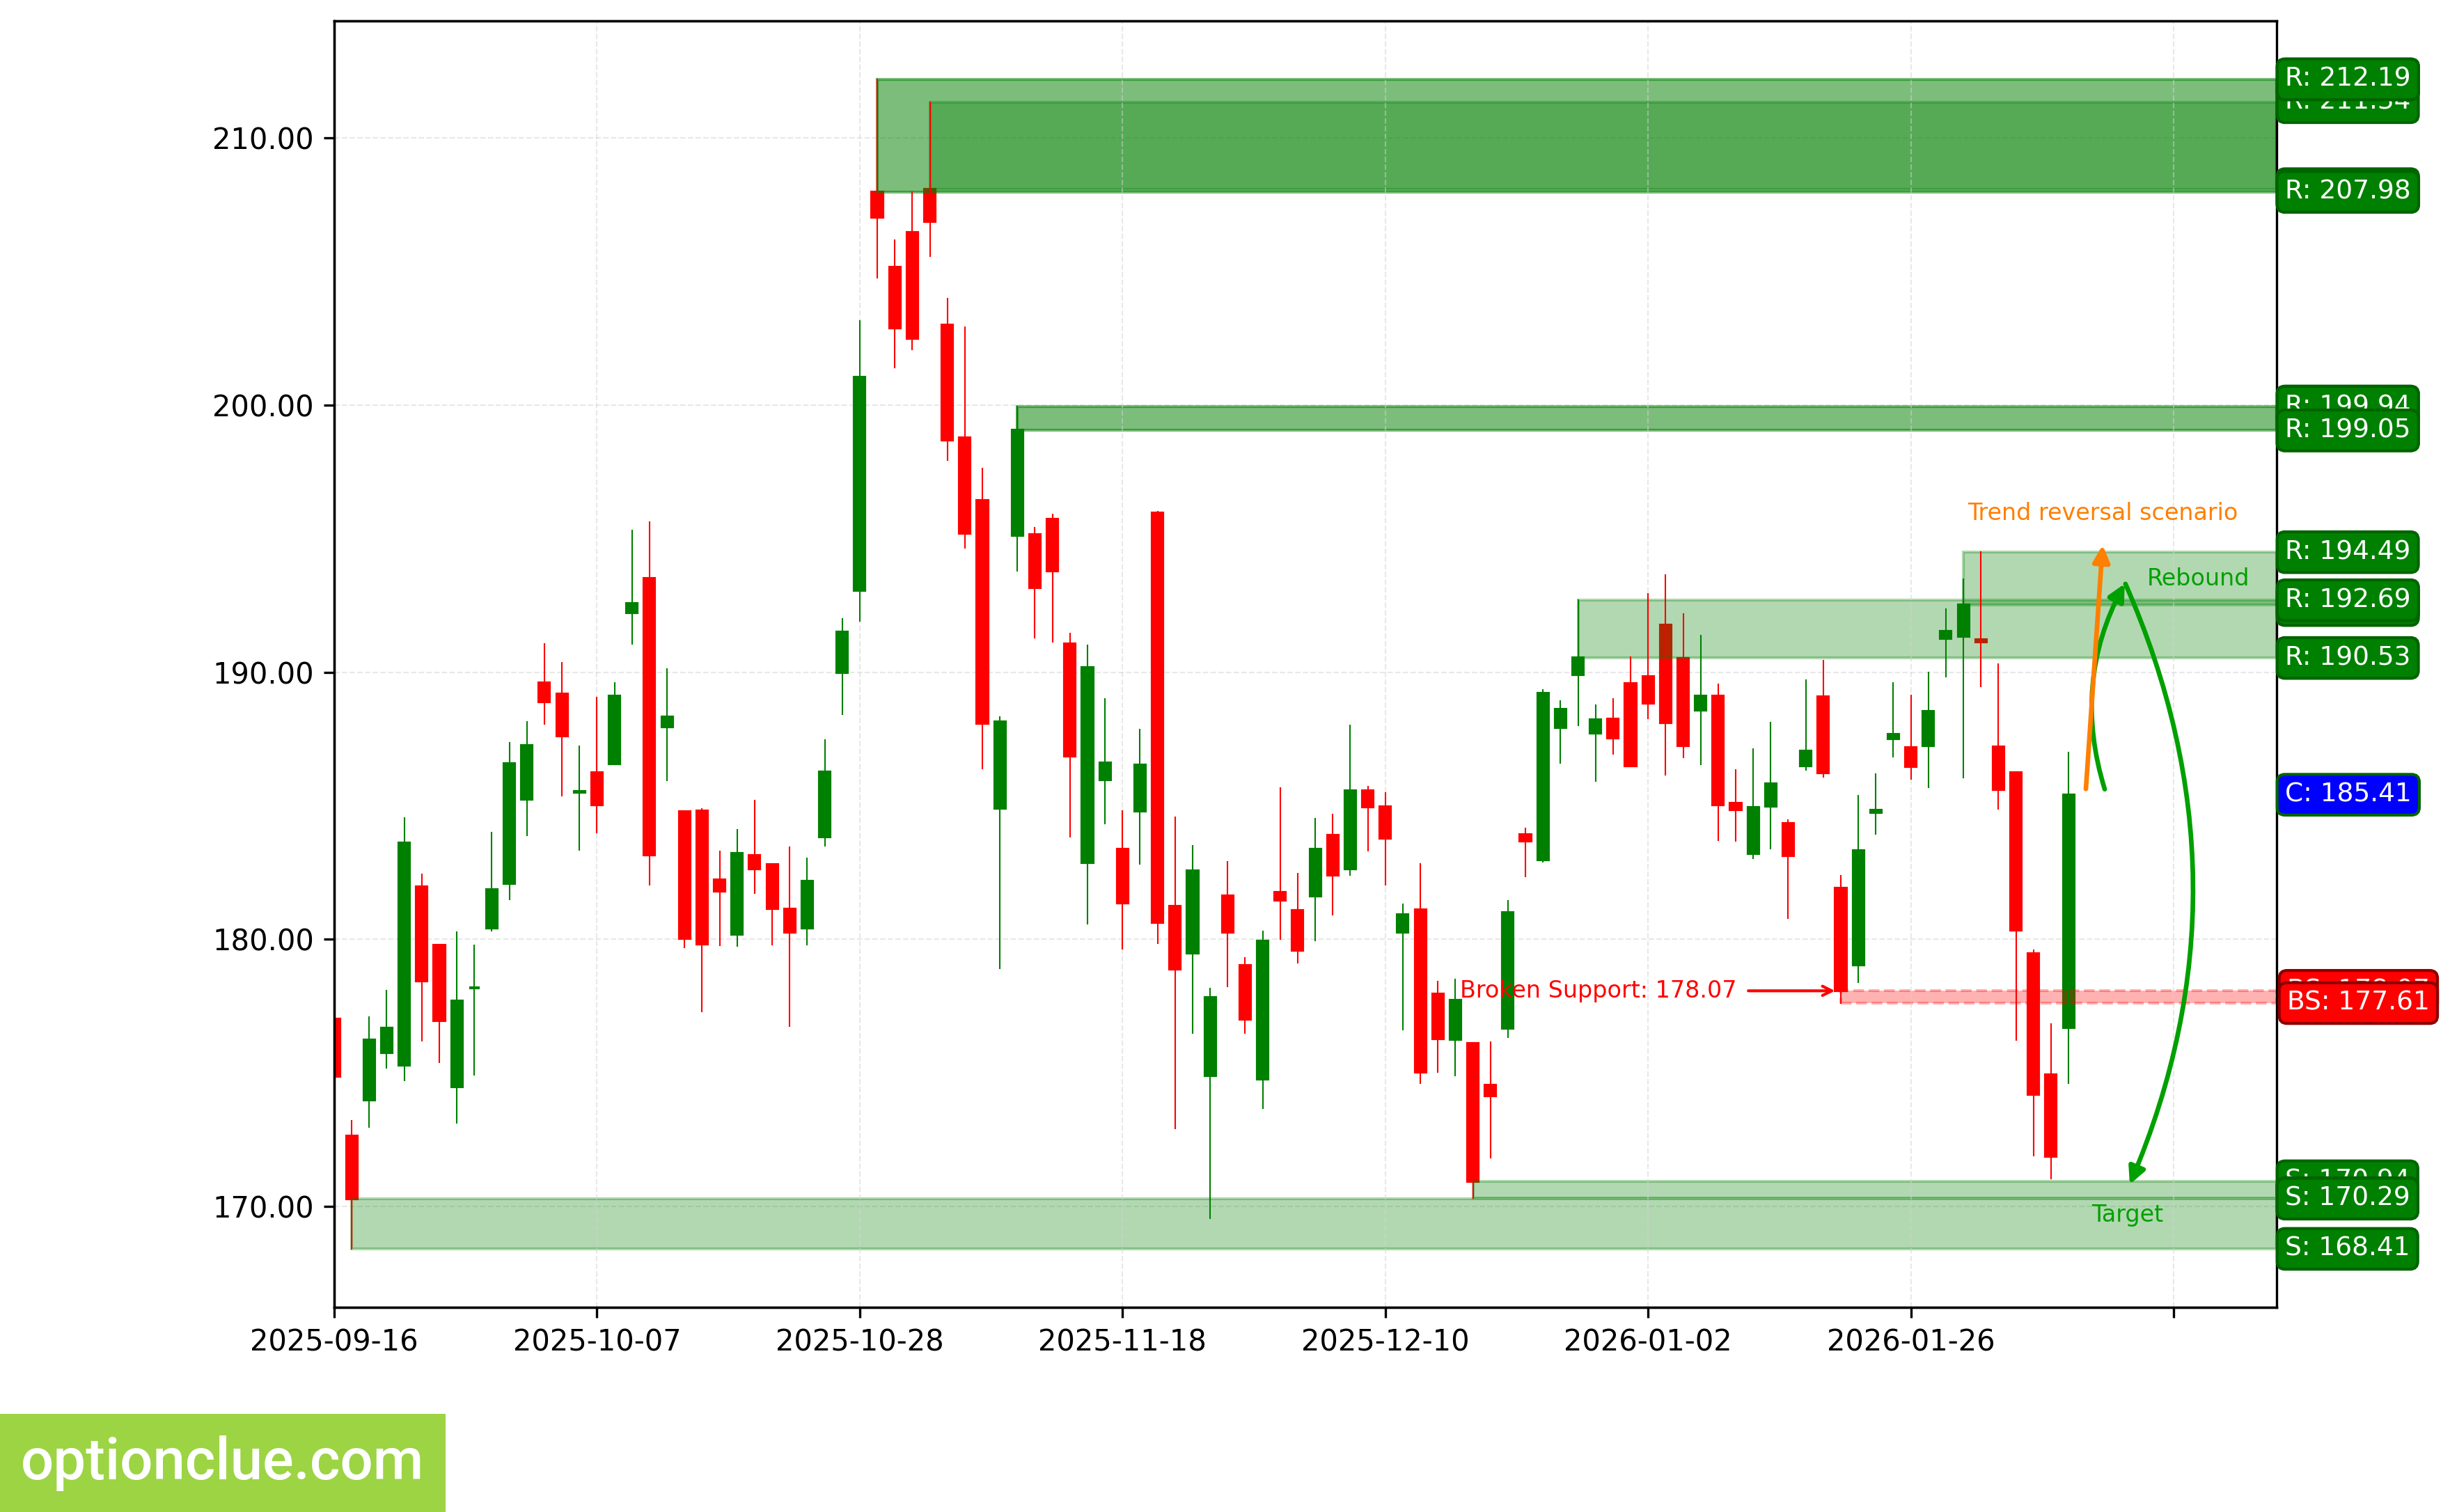
NVDA. Technical analysis. D1.
Tesla Inc (TSLA)
Bearish trend continues, a corrective wave is developing. An entry point for selling on rebound may form after the current correction completes. The last broken level is support (414.50 — 416.56). The breakout occurred 3 candlesticks ago.
Intermediate target for the downward movement is the support level with boundaries 387.53 — 397.02.
Potential profit/risk ratio from current prices when setting targets and fixing risks based on daily timeframe levels may be small (approximately 0.3:1). If the correction completes near the resistance level (430.41 — 439.88), the potential profit/risk ratio may be around 1.7:1. If the correction completes near the last broken level (414.50 — 416.56), the potential profit/risk ratio may be small (around 0.4:1).
Short positions will remain relevant as long as the market remains below the nearest resistance level with boundaries 430.41 — 439.88. If the market successfully settles above this nearest resistance, the trend will reverse to the opposite (bullish).
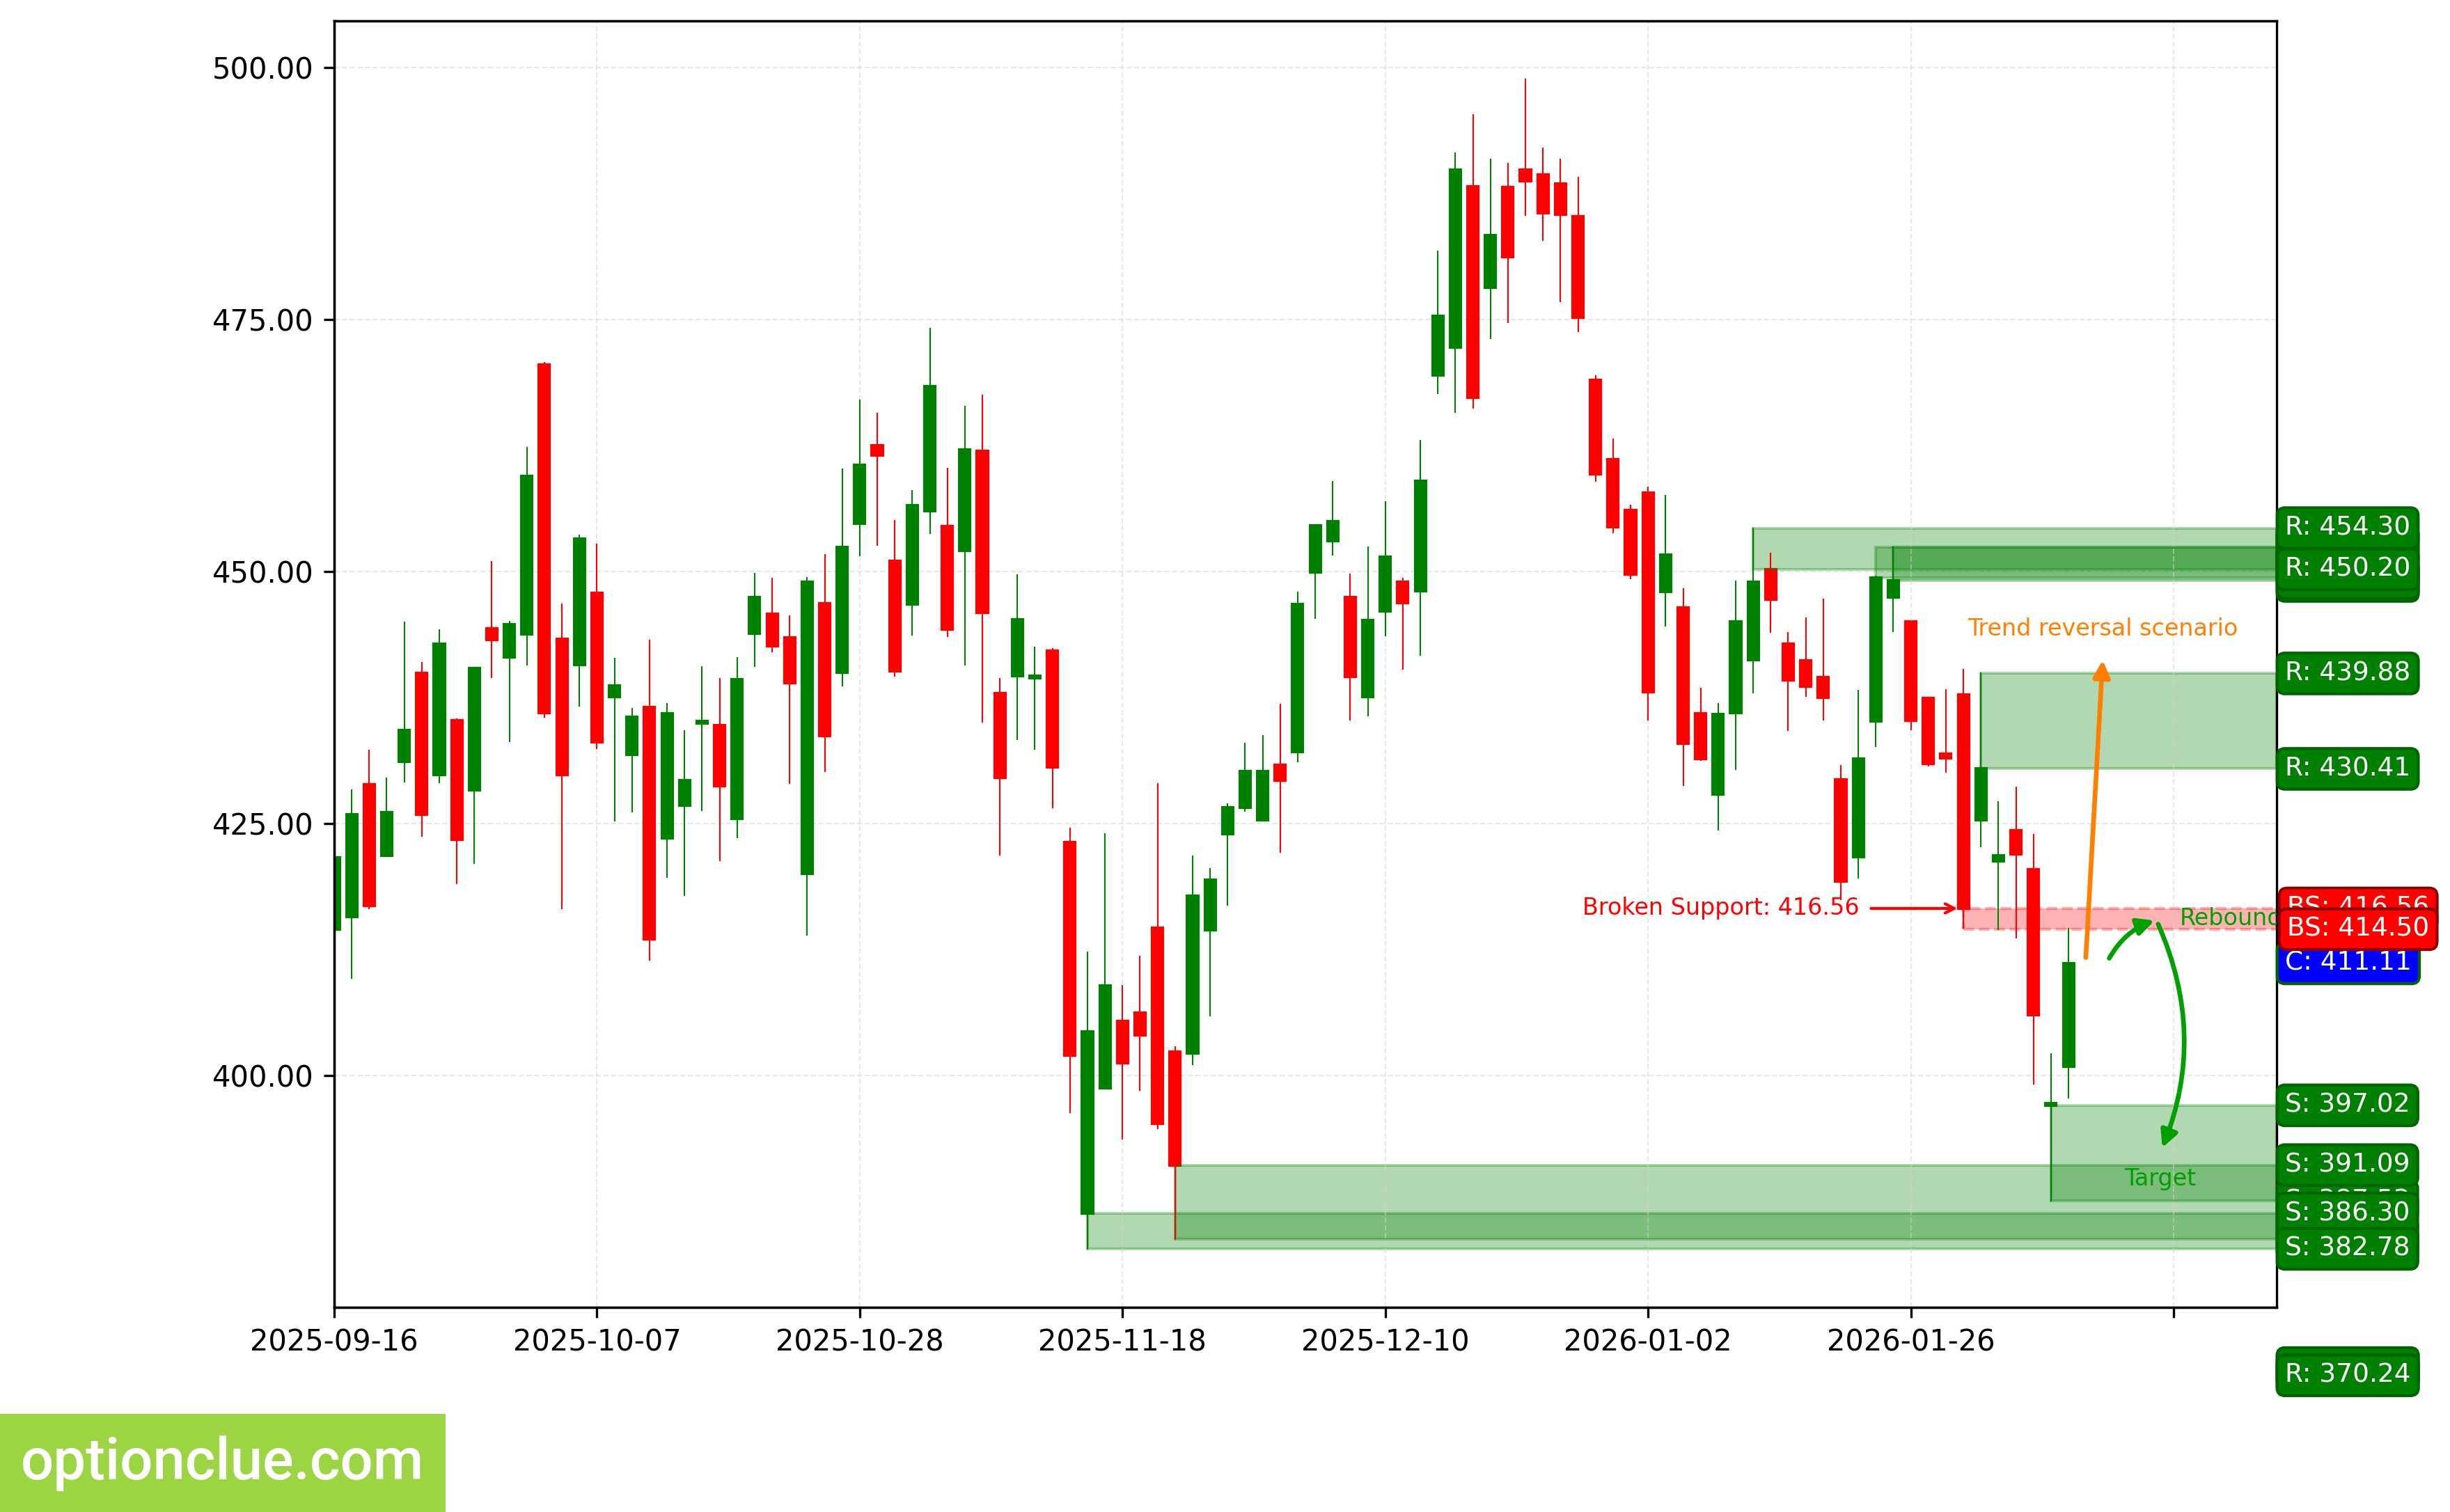
TSLA. Technical analysis. D1.
Summary
From the perspective of medium-term trading, financial instruments with correction nearing completion on daily and/or potentially the most promising profit/risk ratios can be named: GBPUSD, NVDA, TSLA. Soon, depending on the depth of market correction, BTC, ETH may be worth attention.
The remaining financial instruments on the trading list may also be interesting, but on these markets, daily bounce signals are likely to appear no earlier than in a week.