
Looking at the markets through the lens of technical analysis. We identify key support and resistance levels, around which the trend continues or the market reverses.
Key Topics
- Euro (EURUSD)
- British Pound (GBPUSD)
- Swiss Franc (USDCHF)
- Japanese Yen (USDJPY)
- Canadian Dollar (USDCAD)
- Australian Dollar (AUDUSD)
- New Zealand Dollar (NZDUSD)
- Bitcoin (BTC)
- Ether (ETH)
- Apple Inc (AAPL)
- NVIDIA Corp (NVDA)
- Tesla Inc (TSLA)
- Summary
Euro (EURUSD)
The bearish trend continues, an impulse move is developing.
A few days ago, the price returned to the last broken level (1.1725 — 1.1744) and rebounded from it. The intermediate target for the downward move is the support level with boundaries 1.1645 — 1.1665.
If the market successfully holds below this support, it will open the way for the price to move to target #2 — the support level with boundaries 1.1606 — 1.1638. Short positions may remain relevant as long as the market stays below the nearest resistance level with boundaries 1.1733 — 1.1778.
If this zone is broken, the medium-term trend will change to an uptrend.
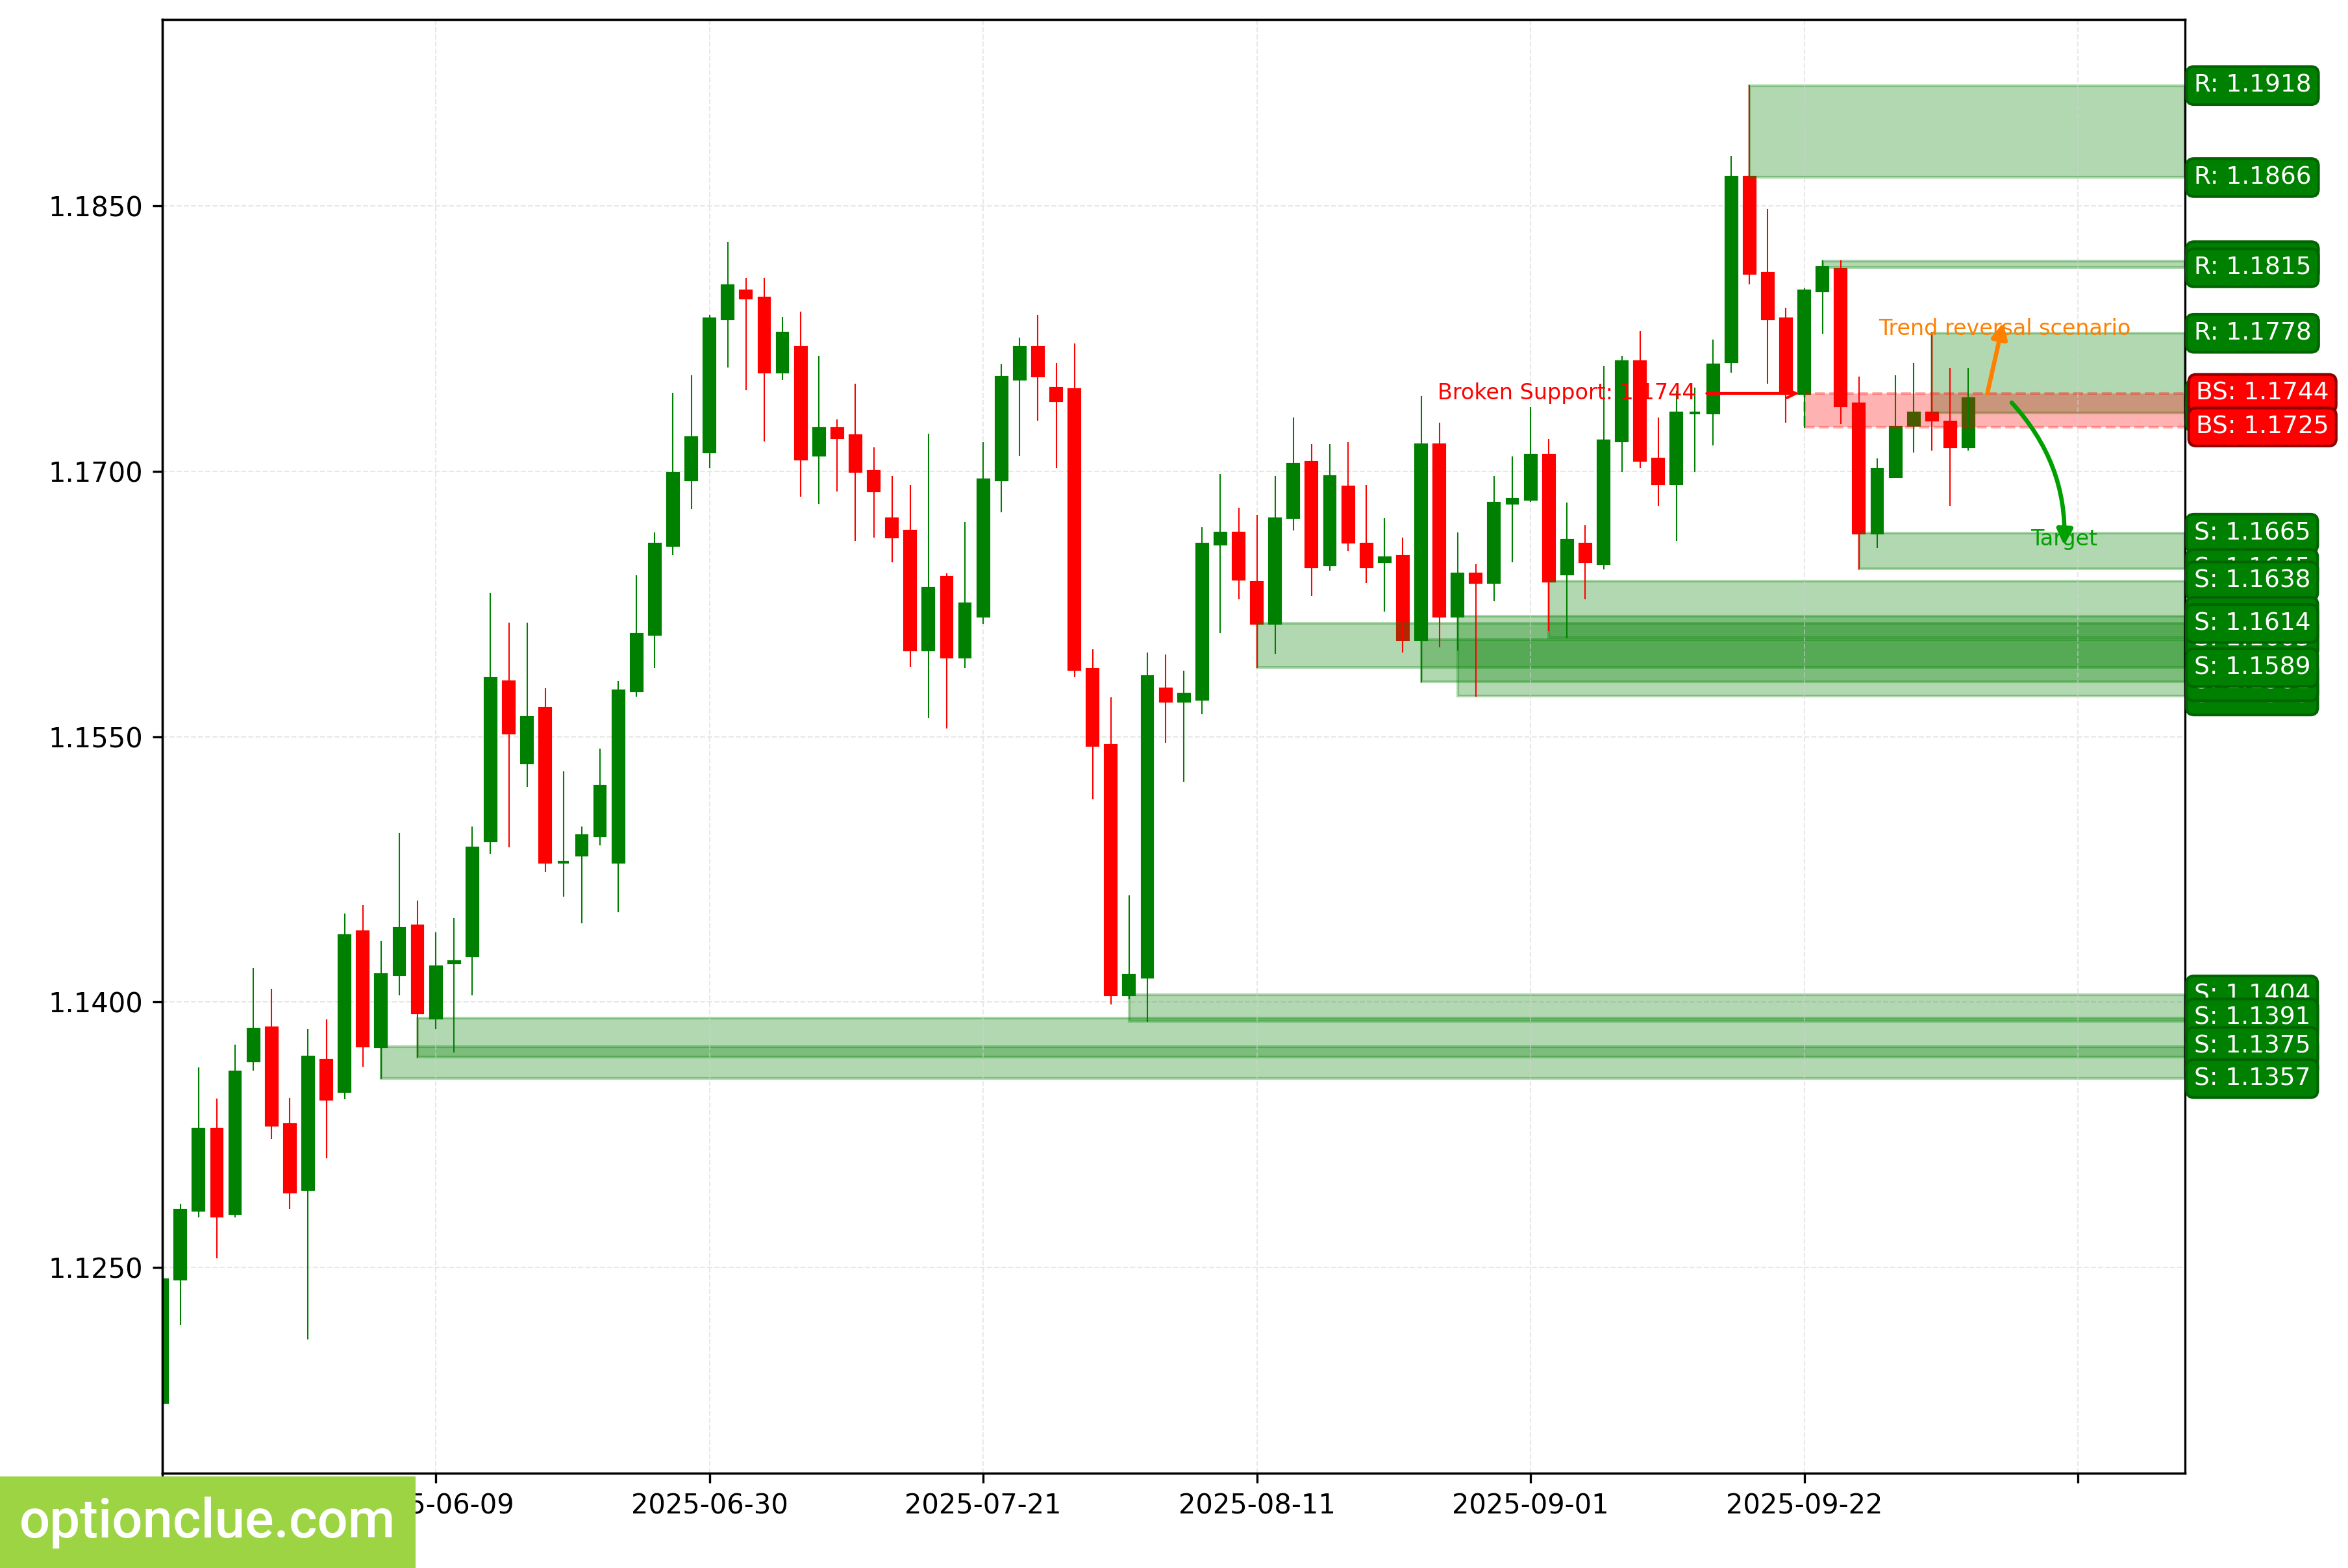
EURUSD. Technical analysis. D1.
British Pound (GBPUSD)
The market remains in a bearish trend. A few days ago, the price returned to the last broken level (1.3449 — 1.3466) and rebounded from it; an impulse wave is developing.
The intermediate target for the downward move is the support level with boundaries 1.3321 — 1.3340. If the market successfully holds below this support, it will open the way for the price to move to target #2 — the support level with boundaries 1.3138 — 1.3205.
Short positions will remain relevant as long as the market is below the nearest resistance level with boundaries 1.3477 — 1.3527.
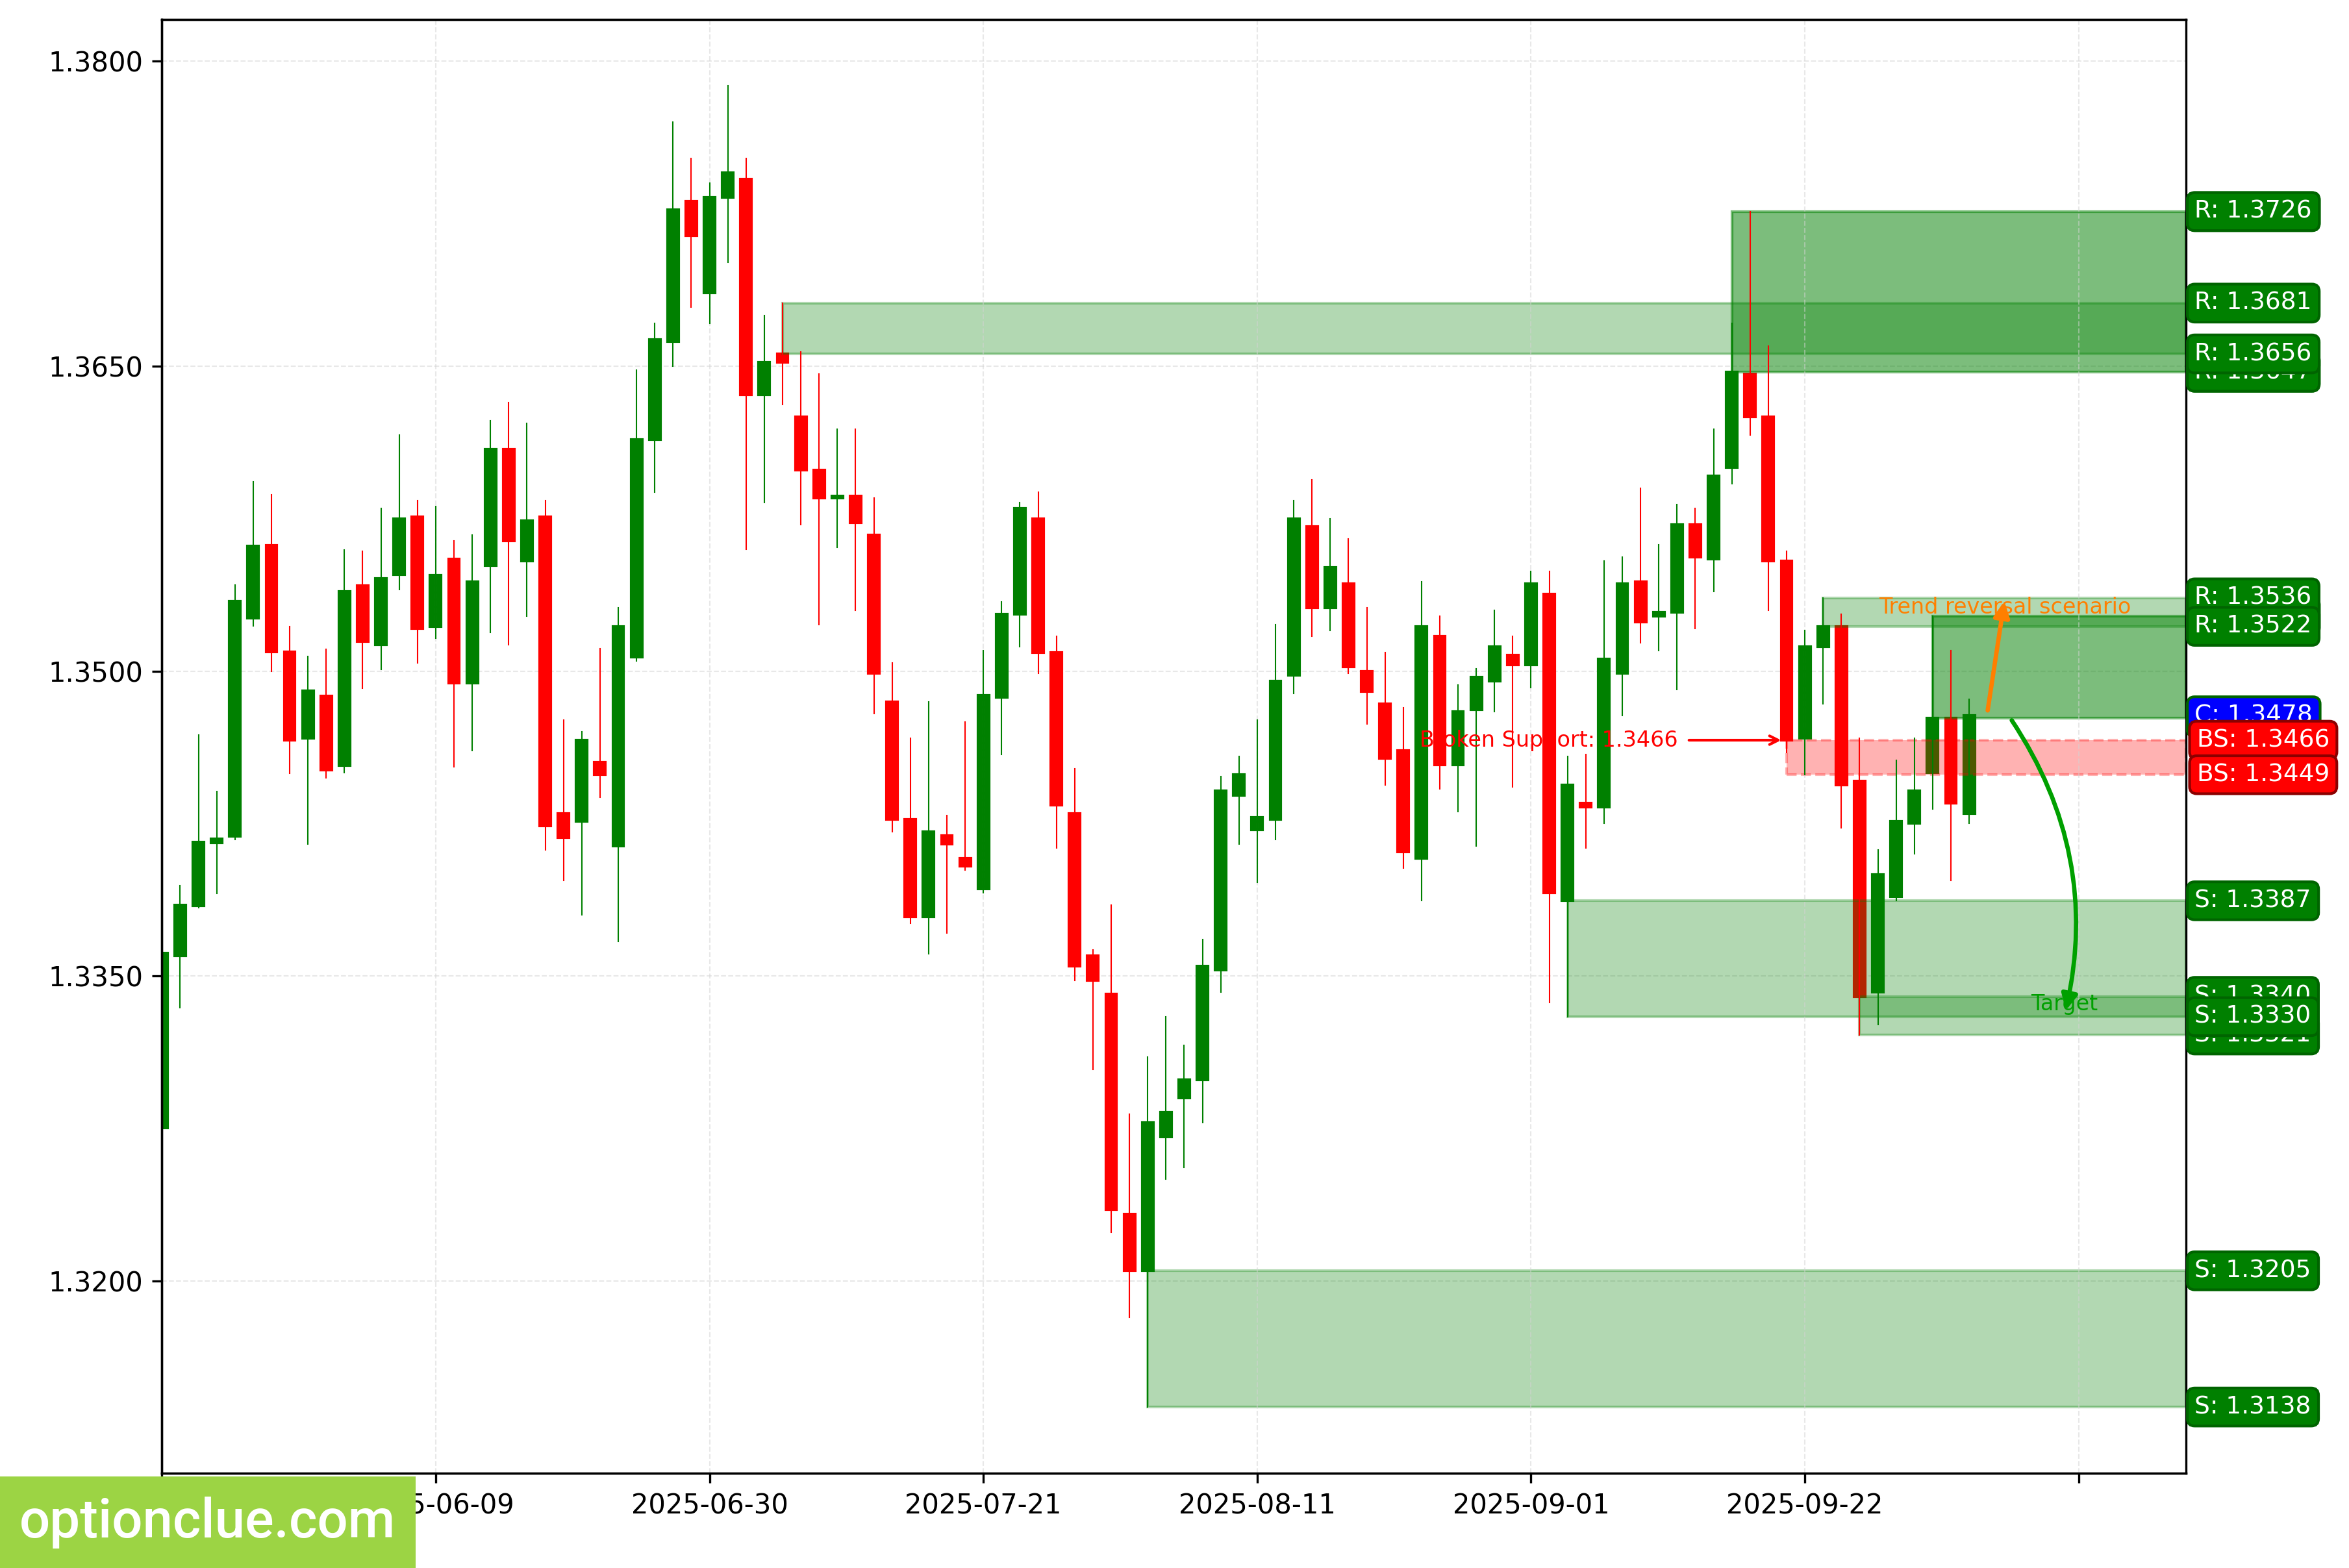
GBPUSD. Technical analysis. D1.
Swiss Franc (USDCHF)
The bullish trend continues, an impulse move is developing. A few days ago, the price returned to the last broken resistance level (0.7953 — 0.7972) and rebounded from it.
The intermediate target for the upward move is the resistance level with boundaries 0.8053 — 0.8072. If the market successfully holds above this resistance, it will open the way for the price to move to target #2 — the resistance level with boundaries 0.8058 — 0.8076.
Long positions may remain relevant as long as the market stays above the nearest support level with boundaries 0.7925 — 0.7961. If this zone is broken, the medium-term trend will change to a downtrend.

USDCHF. Technical analysis. D1.
Japanese Yen (USDJPY)
The trend changed to bearish when the support level (147.44 — 147.62) was broken last week.
A correction is forming on the daily timeframe. A sell entry point on a rebound may appear after its completion.
If the downward move resumes, the first target will be the support level with boundaries 146.57 — 147.05. In case of a successful trend development, a more distant target will be at the support level with boundaries 145.47 — 146.48.
Short positions will remain relevant as long as the market is below the nearest resistance level with boundaries 149.83 — 149.95. Breaking this level would signal a trend reversal.
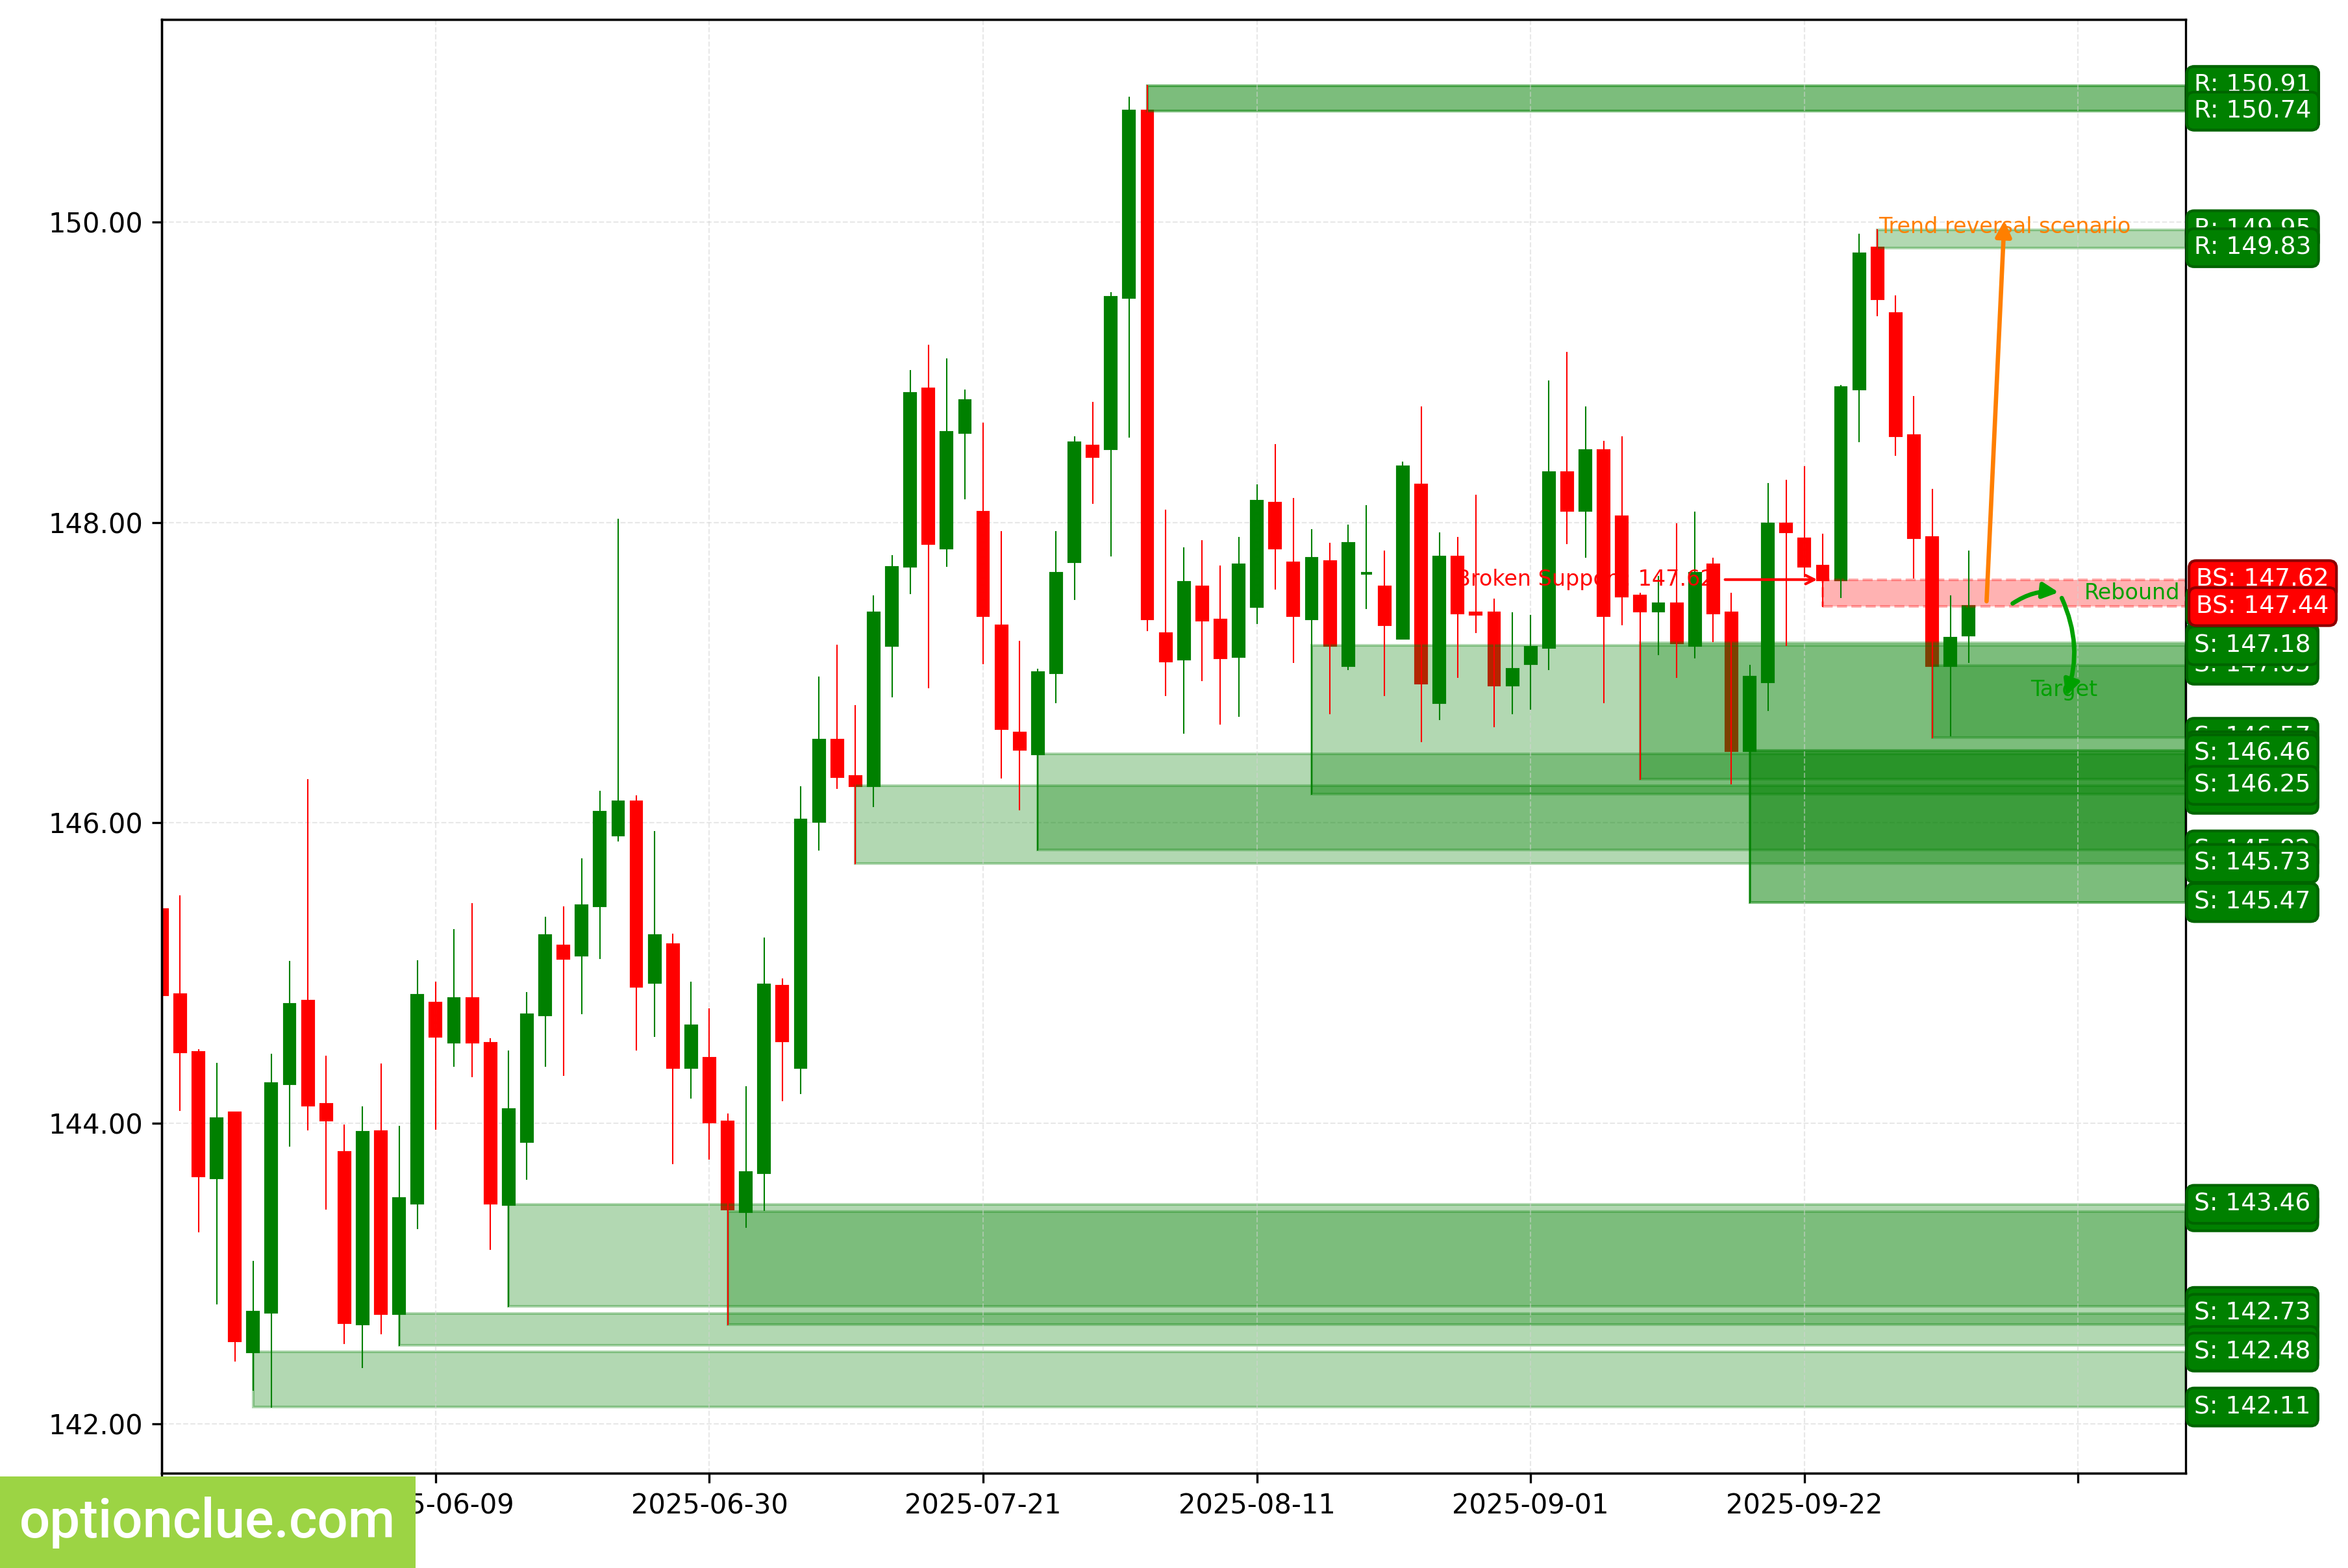
USDJPY. Technical analysis. D1.
Canadian Dollar (USDCAD)
The bullish trend continues, a corrective wave is developing.
A buy entry point on a rebound may appear after its completion. If the upward move resumes, the first target will be the resistance level with boundaries 1.3971 — 1.4005.
In case of a successful trend development, a further target will be in the resistance area with boundaries 1.4385 — 1.4415. Long positions may remain relevant as long as the market is above the nearest support level with boundaries 1.3894 — 1.3911.
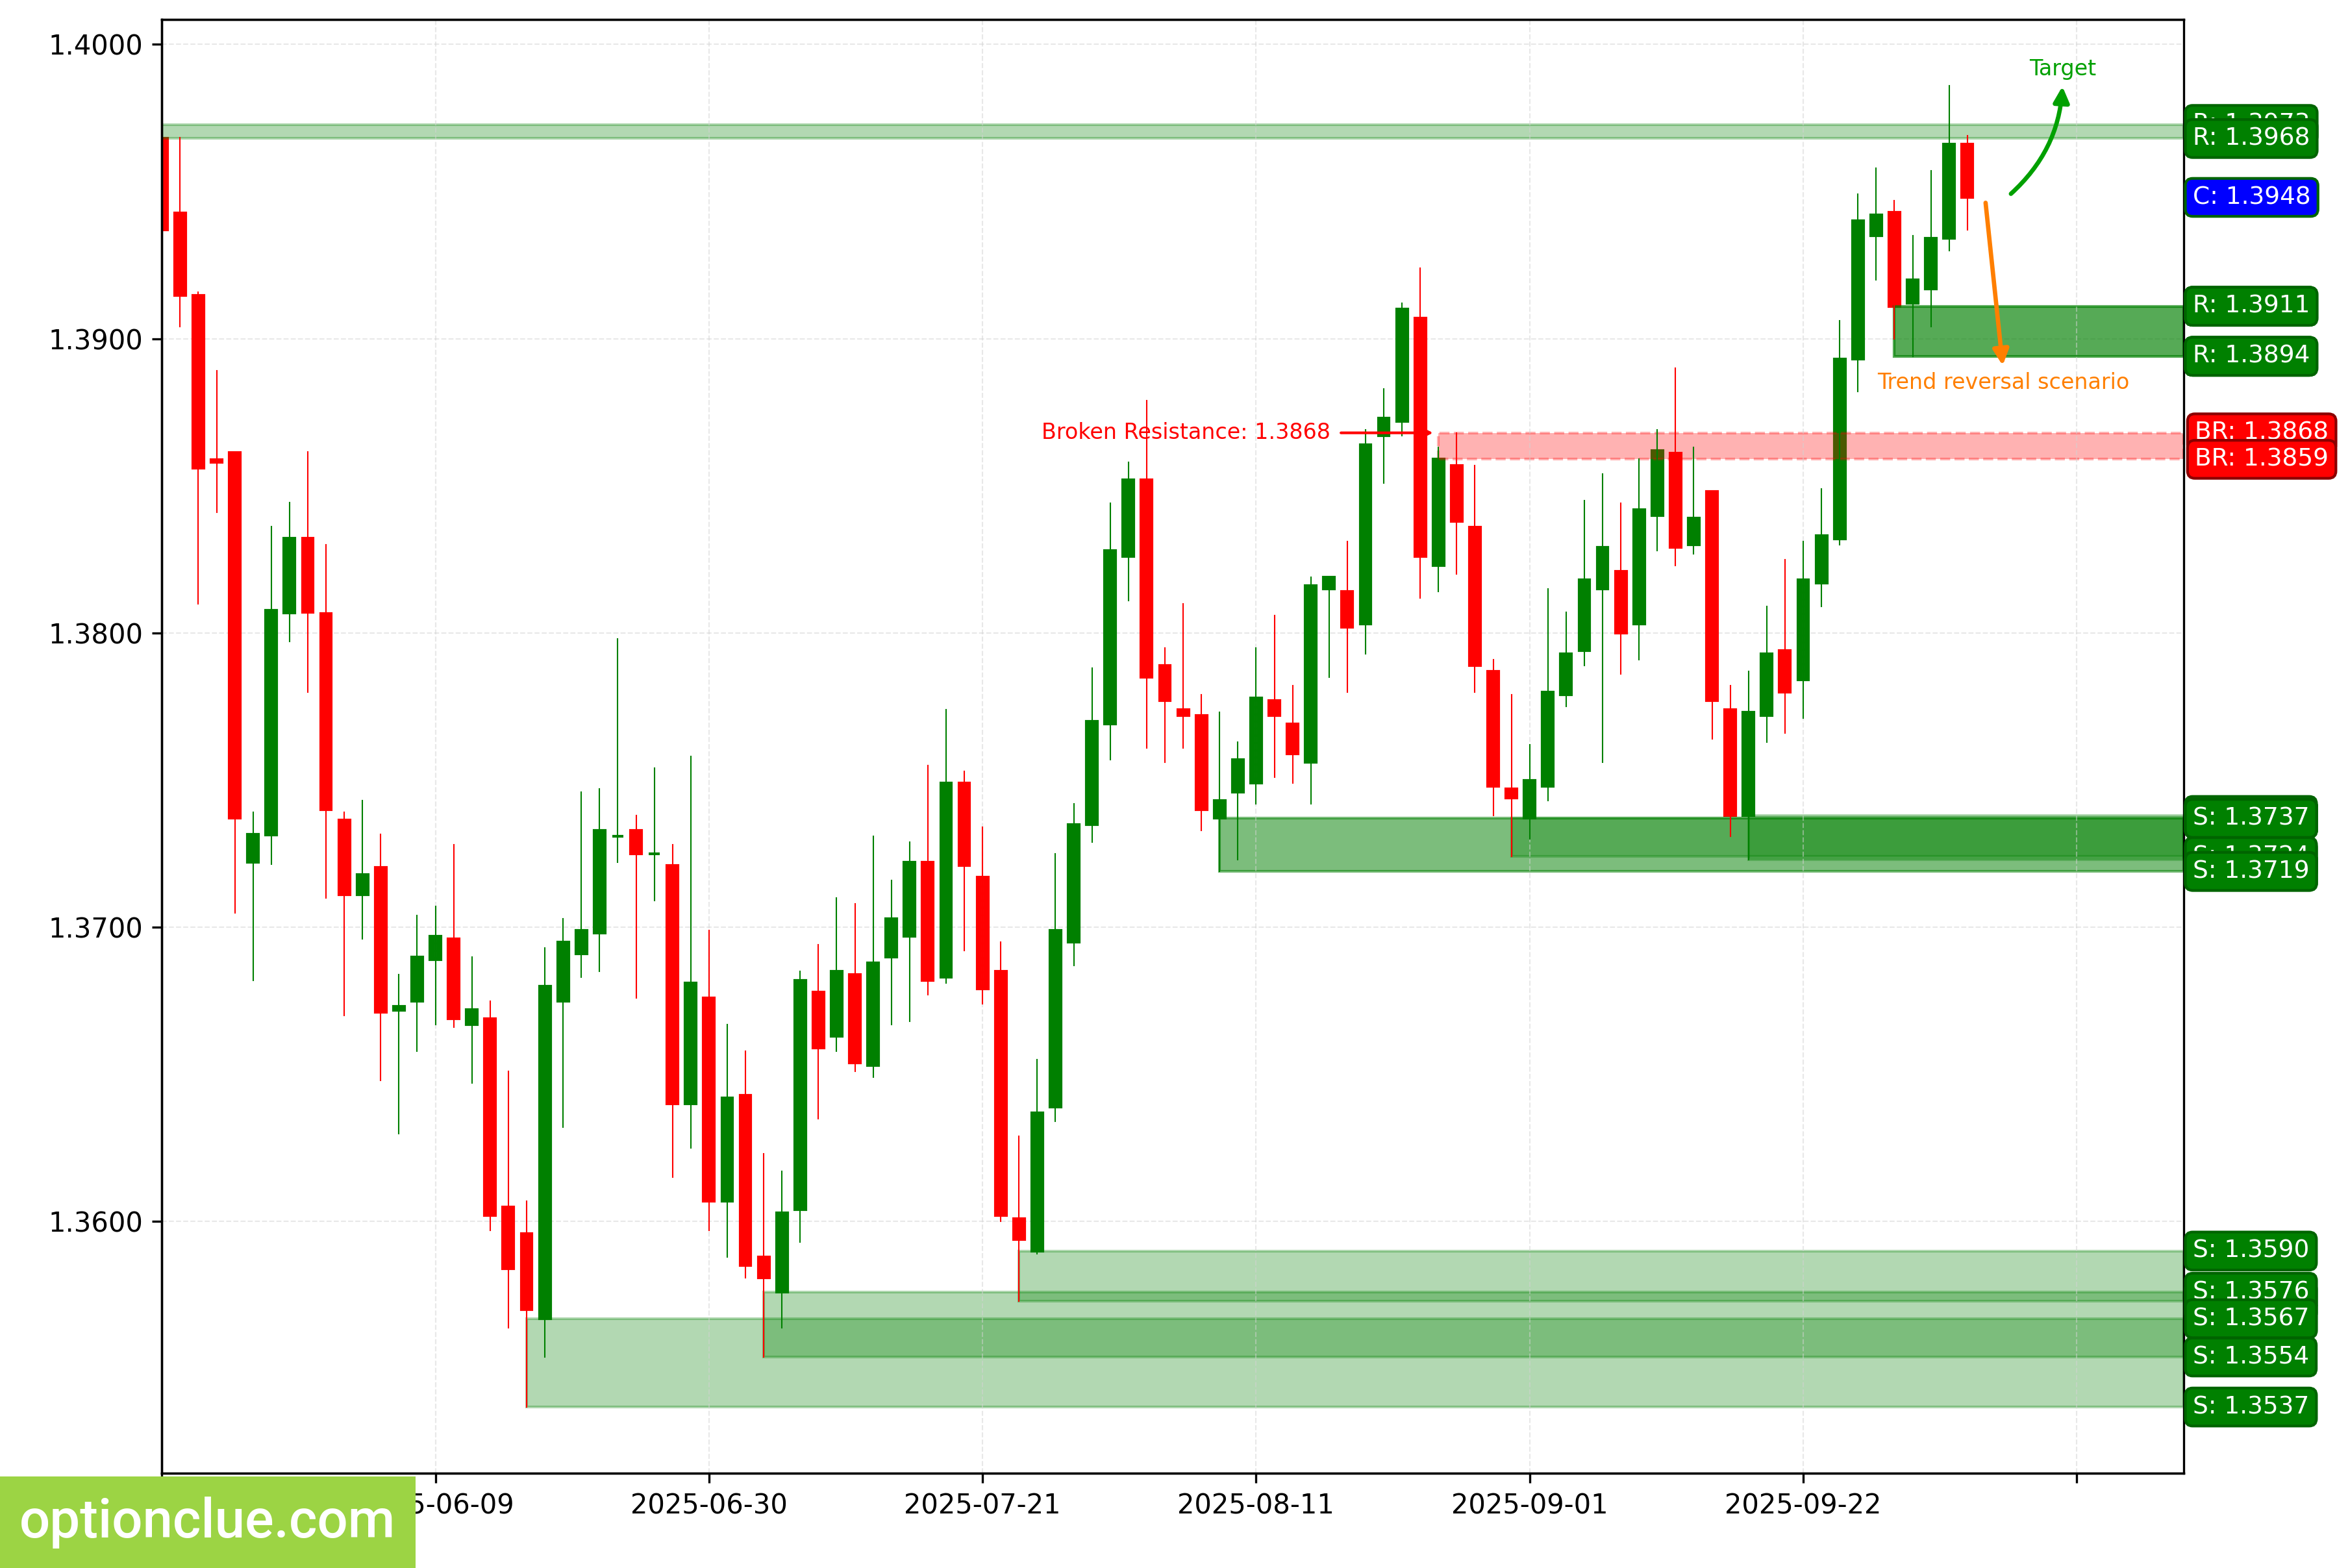
USDCAD. Technical analysis. D1.
Australian Dollar (AUDUSD)
The bearish trend continues, an impulse move is developing.
A few days ago, the price returned to the last broken support level (0.6573 — 0.6586) and rebounded from it. The intermediate target for the downward move is the support level with boundaries 0.6518 — 0.6538.
In case of a successful trend development, a further target will be at the support level with boundaries 0.6481 — 0.6515. Short positions may remain relevant as long as the market stays below the nearest resistance level with boundaries 0.6598 — 0.6628.
If this zone is broken, the medium-term trend will change to bullish.
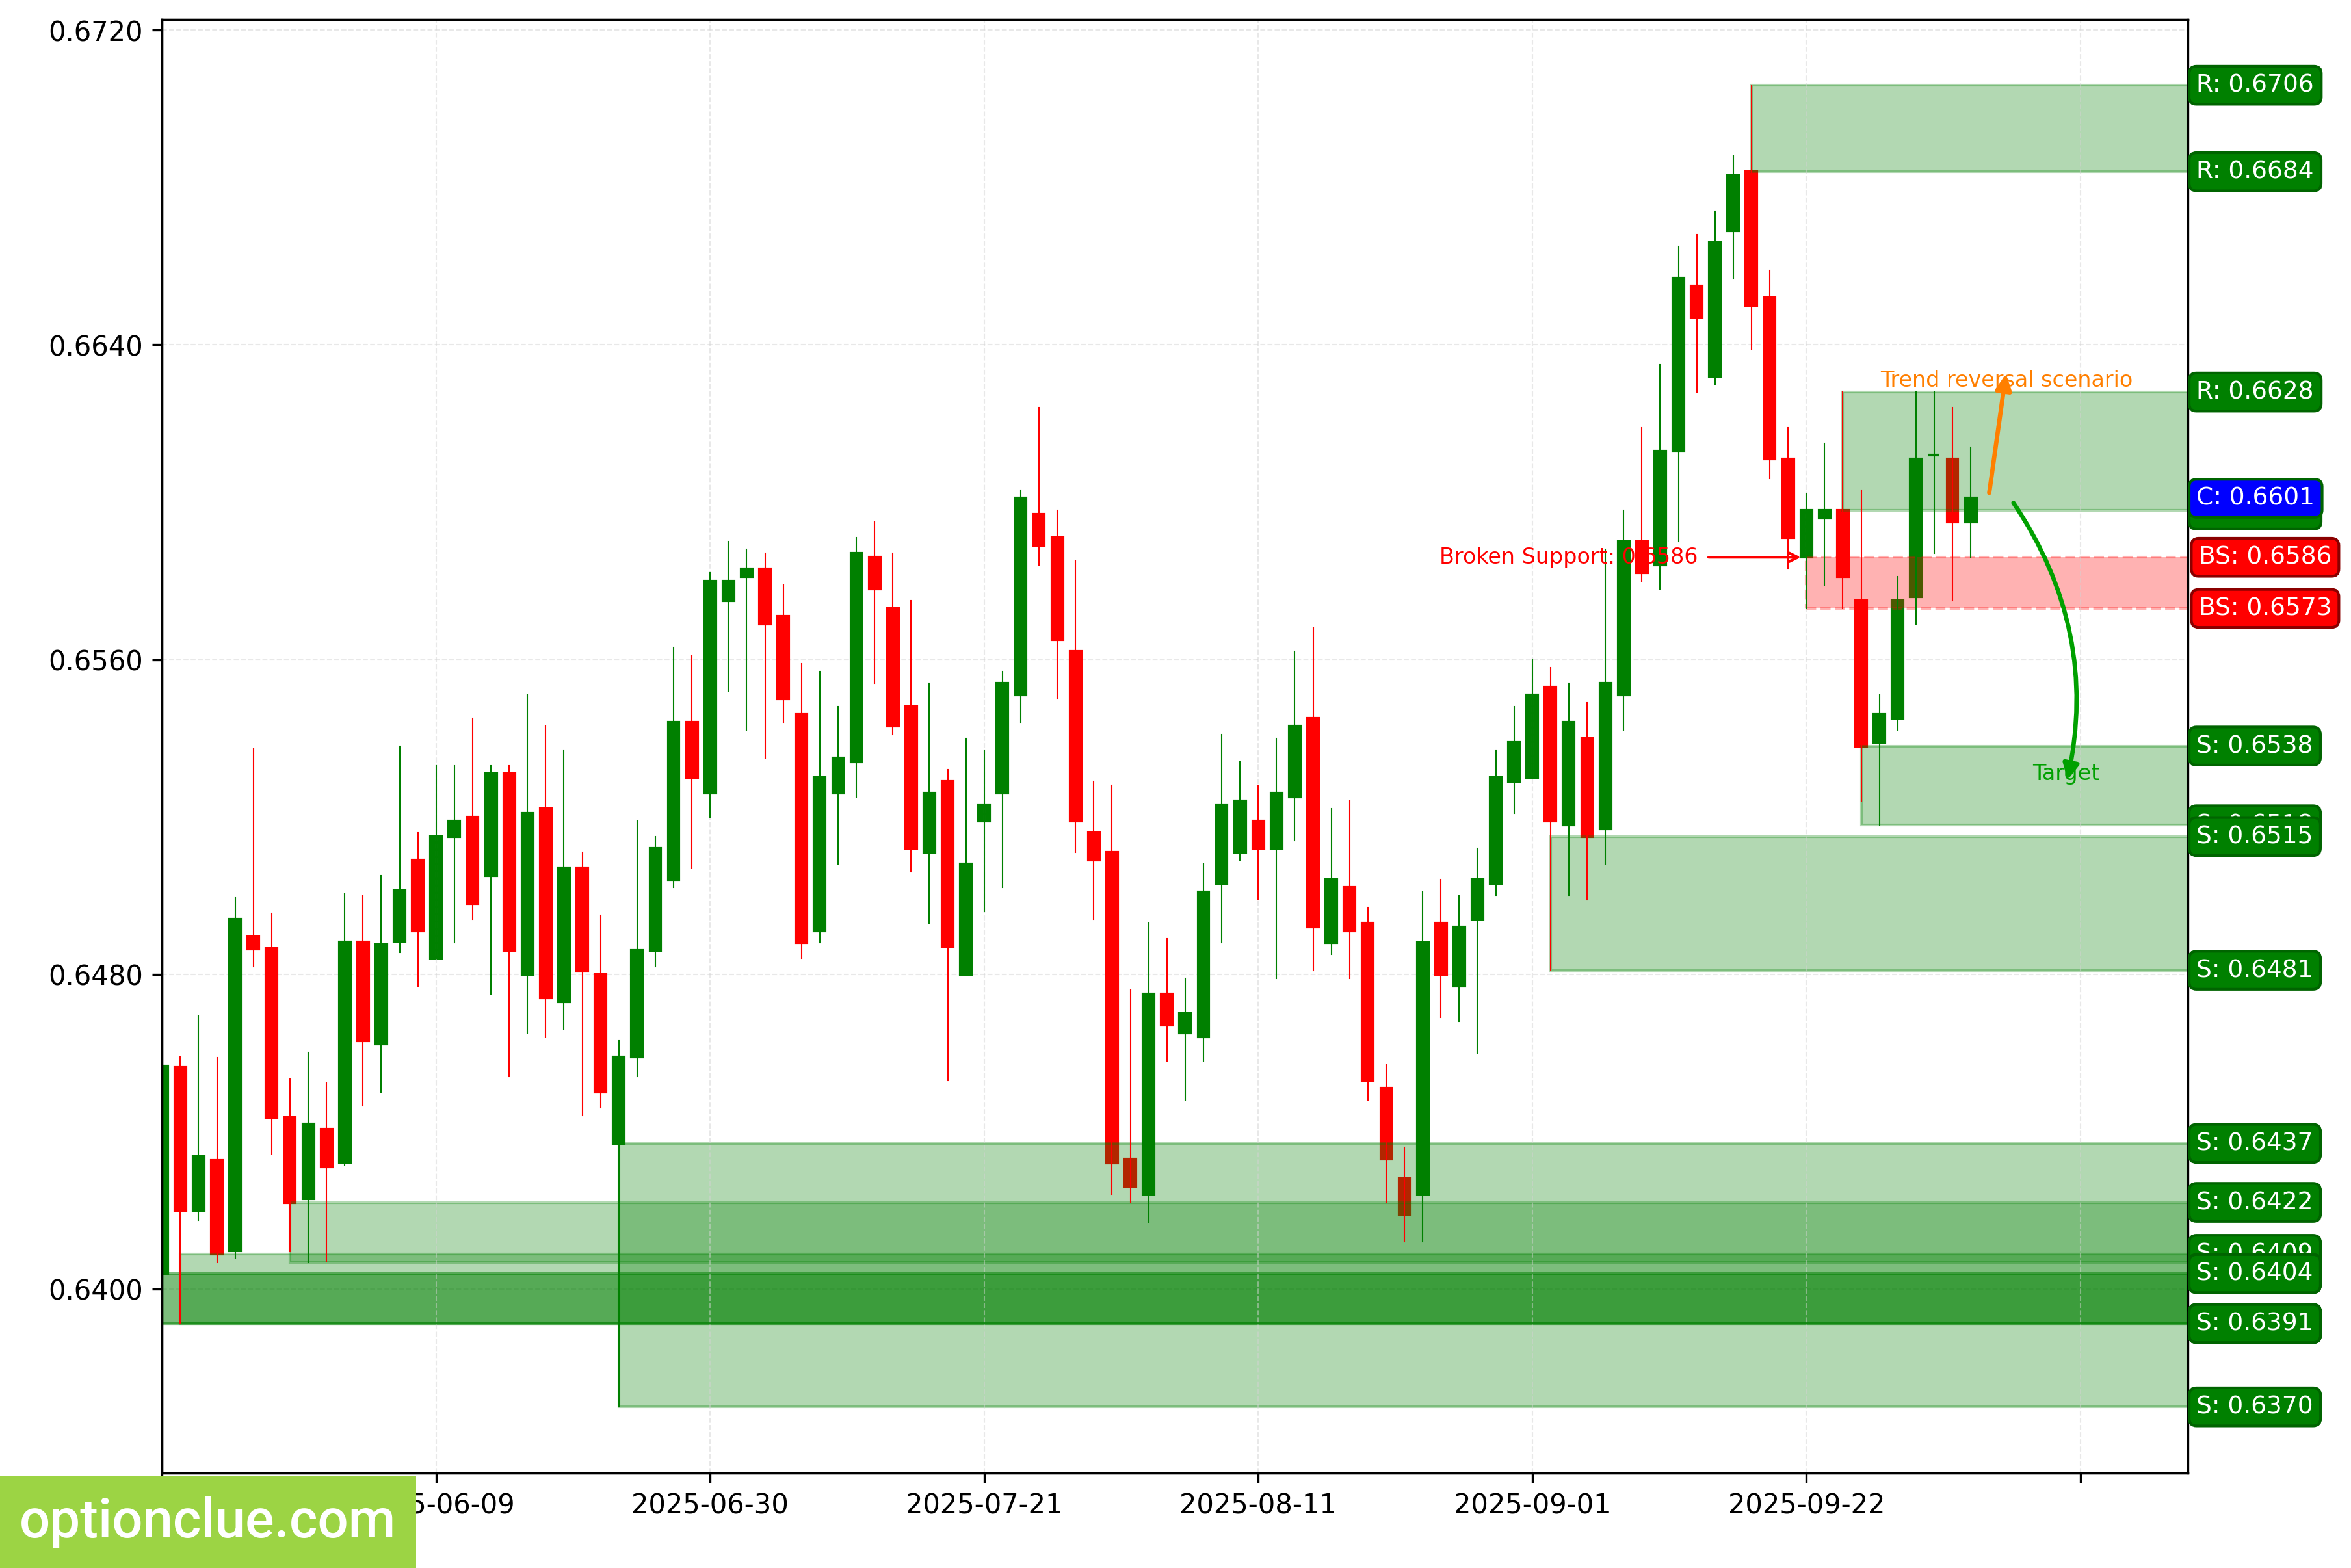
AUDUSD. Technical analysis. D1.
New Zealand Dollar (NZDUSD)
The trend is bearish, a corrective wave is developing on the daily timeframe. A sell entry point on a rebound will appear after the correction completes.
If the downward move resumes, the first target will be the support level with boundaries 0.5752 — 0.5763. In case of a successful trend development, a further target will be at the support level with boundaries 0.5485 — 0.5528.
Short positions will remain relevant as long as the market is below the nearest resistance level with boundaries 0.5864 — 0.5871.
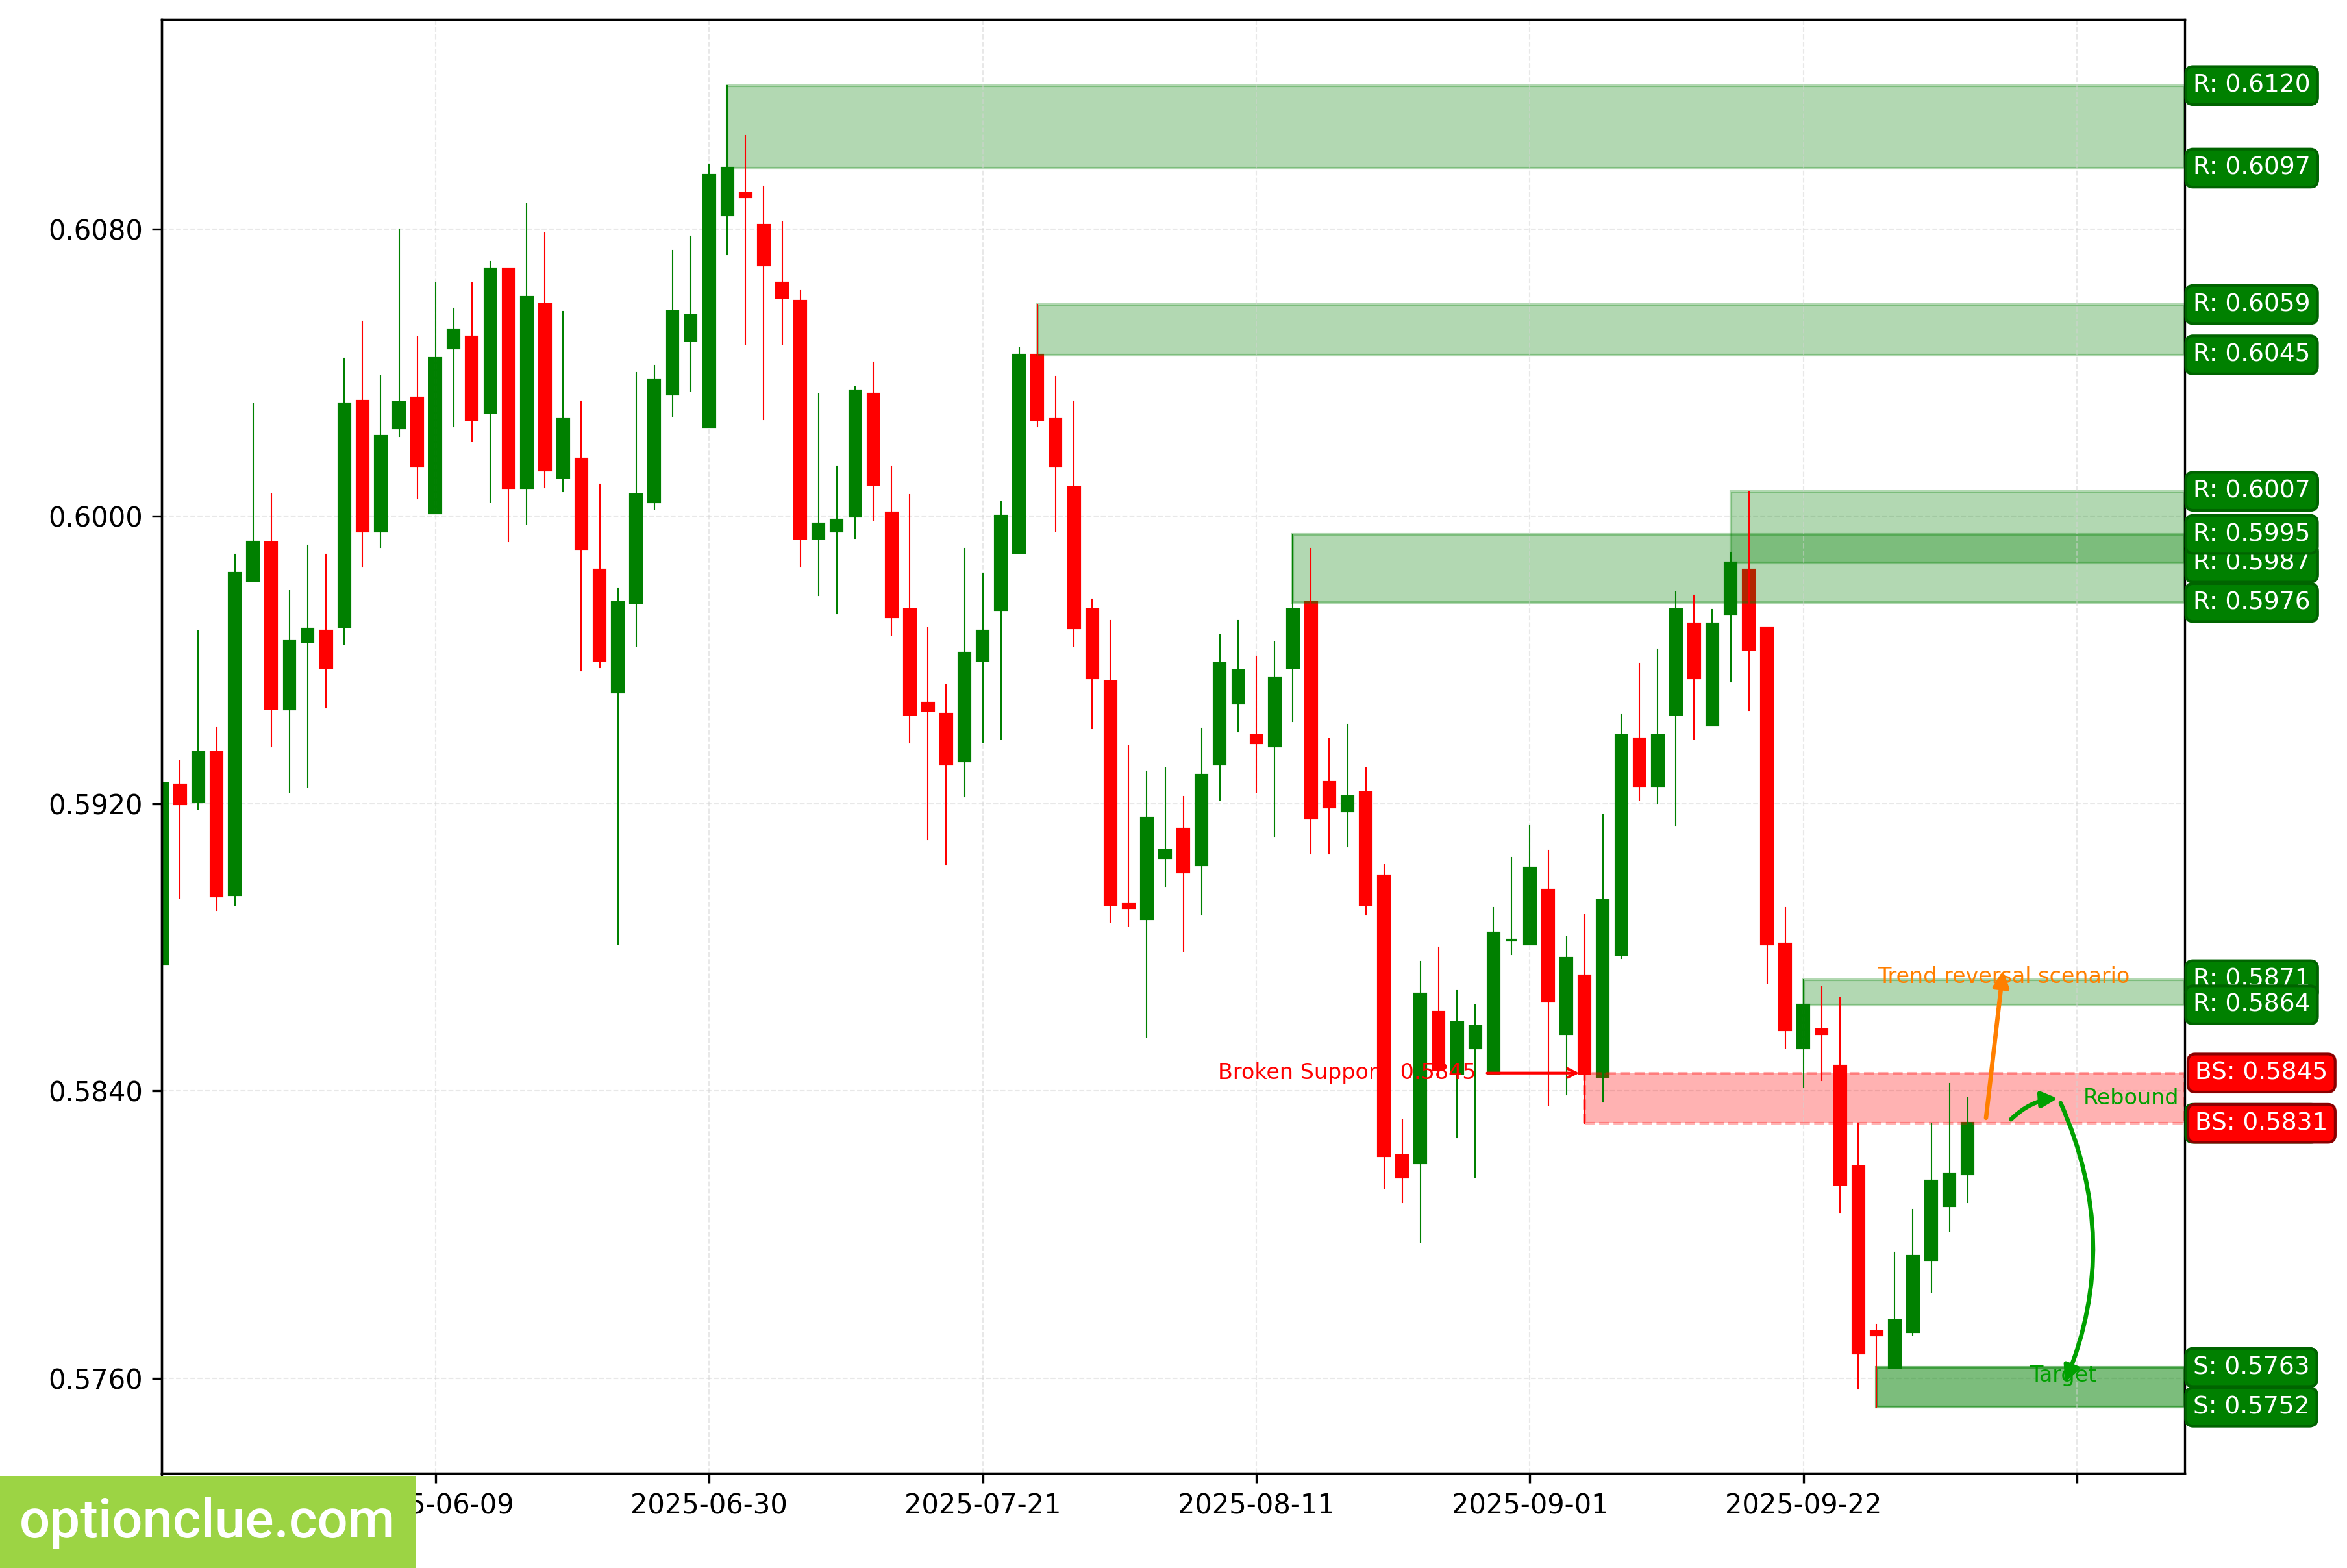
NZDUSD. Technical analysis. D1.
Bitcoin (BTC)
The trend is now bullish, as the resistance level (117118 — 117998) was broken last week. An impulse wave is developing on the daily timeframe.
A buy entry point on a rebound may appear after a full-fledged correction forms. The intermediate target for the upward move is the resistance level with boundaries 123366 — 124533.
Buy signals will remain relevant as long as the market is above the nearest support level with boundaries 108624 — 109036.
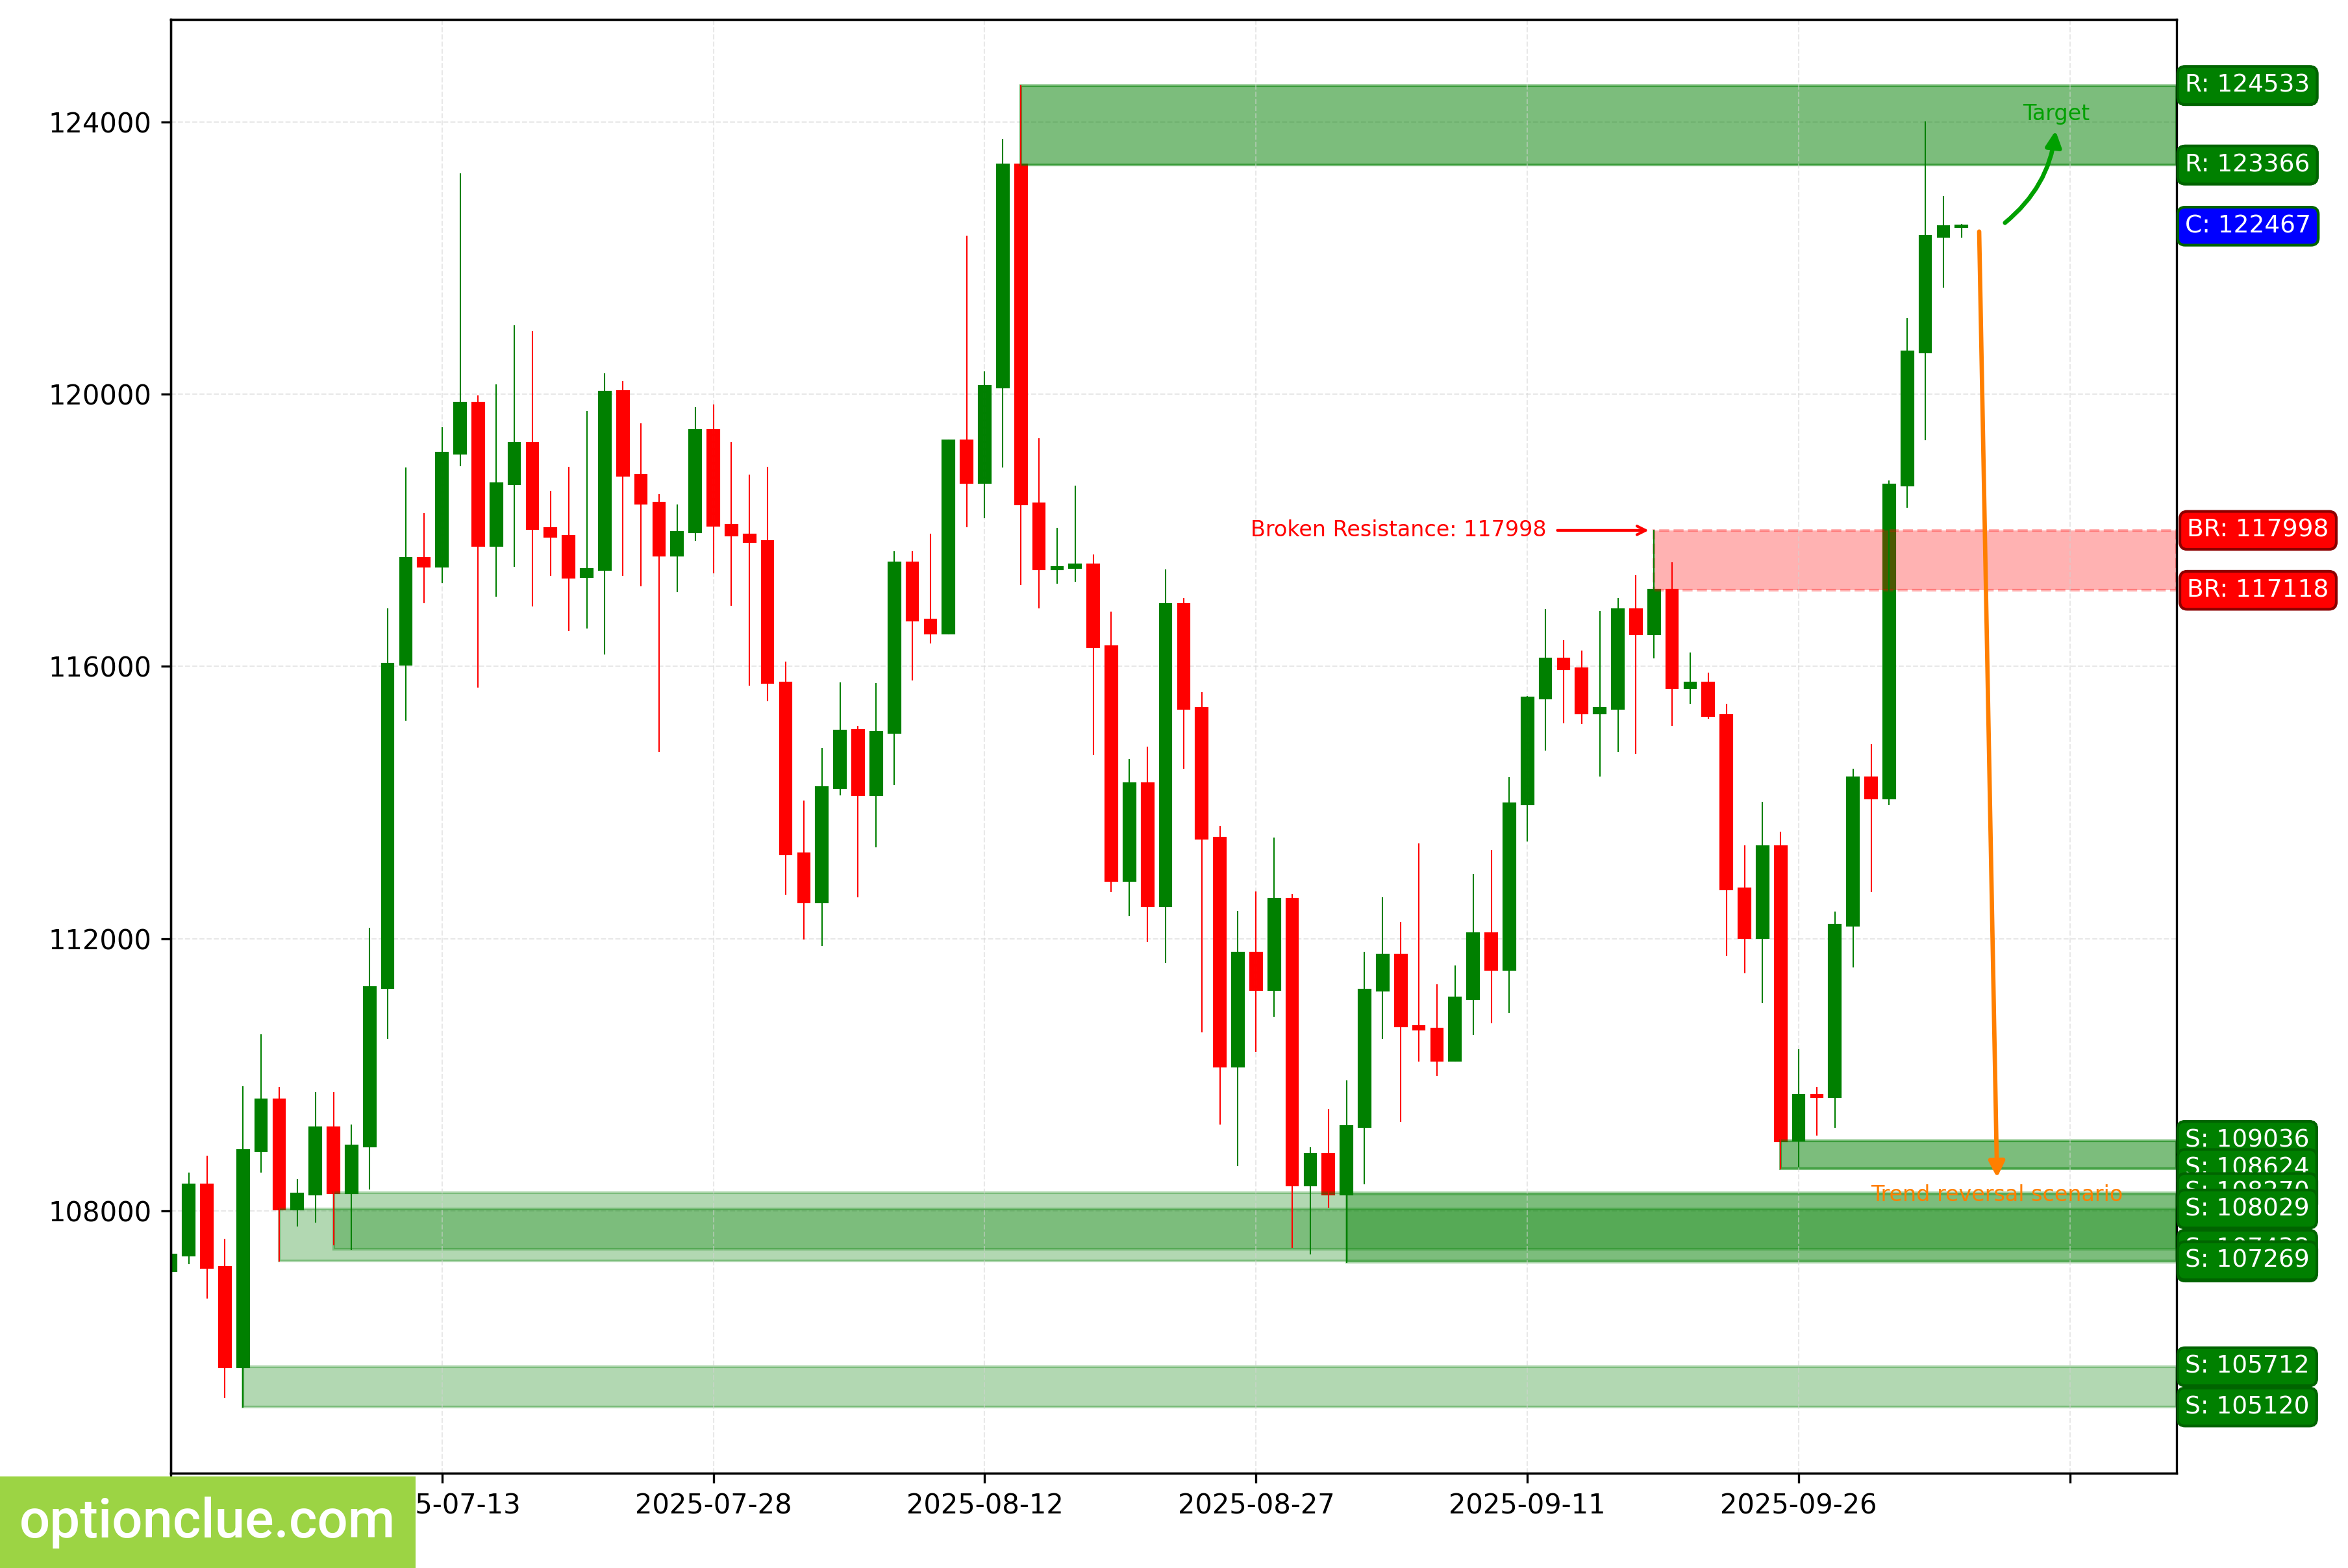
BTC. Technical analysis.
D1.
Ether (ETH)
The trend changed to an uptrend when the resistance level (4154 — 4163) was broken last week. An impulse wave is developing on the daily timeframe.
A buy entry point on a rebound may appear after a full-fledged correction forms. The intermediate target for the upward move is the resistance level with boundaries 4592 — 4647.
A further target is at the resistance level with boundaries 4715 — 4769. Buy signals will remain relevant as long as the market is above the nearest support level with boundaries 3825 — 3876.
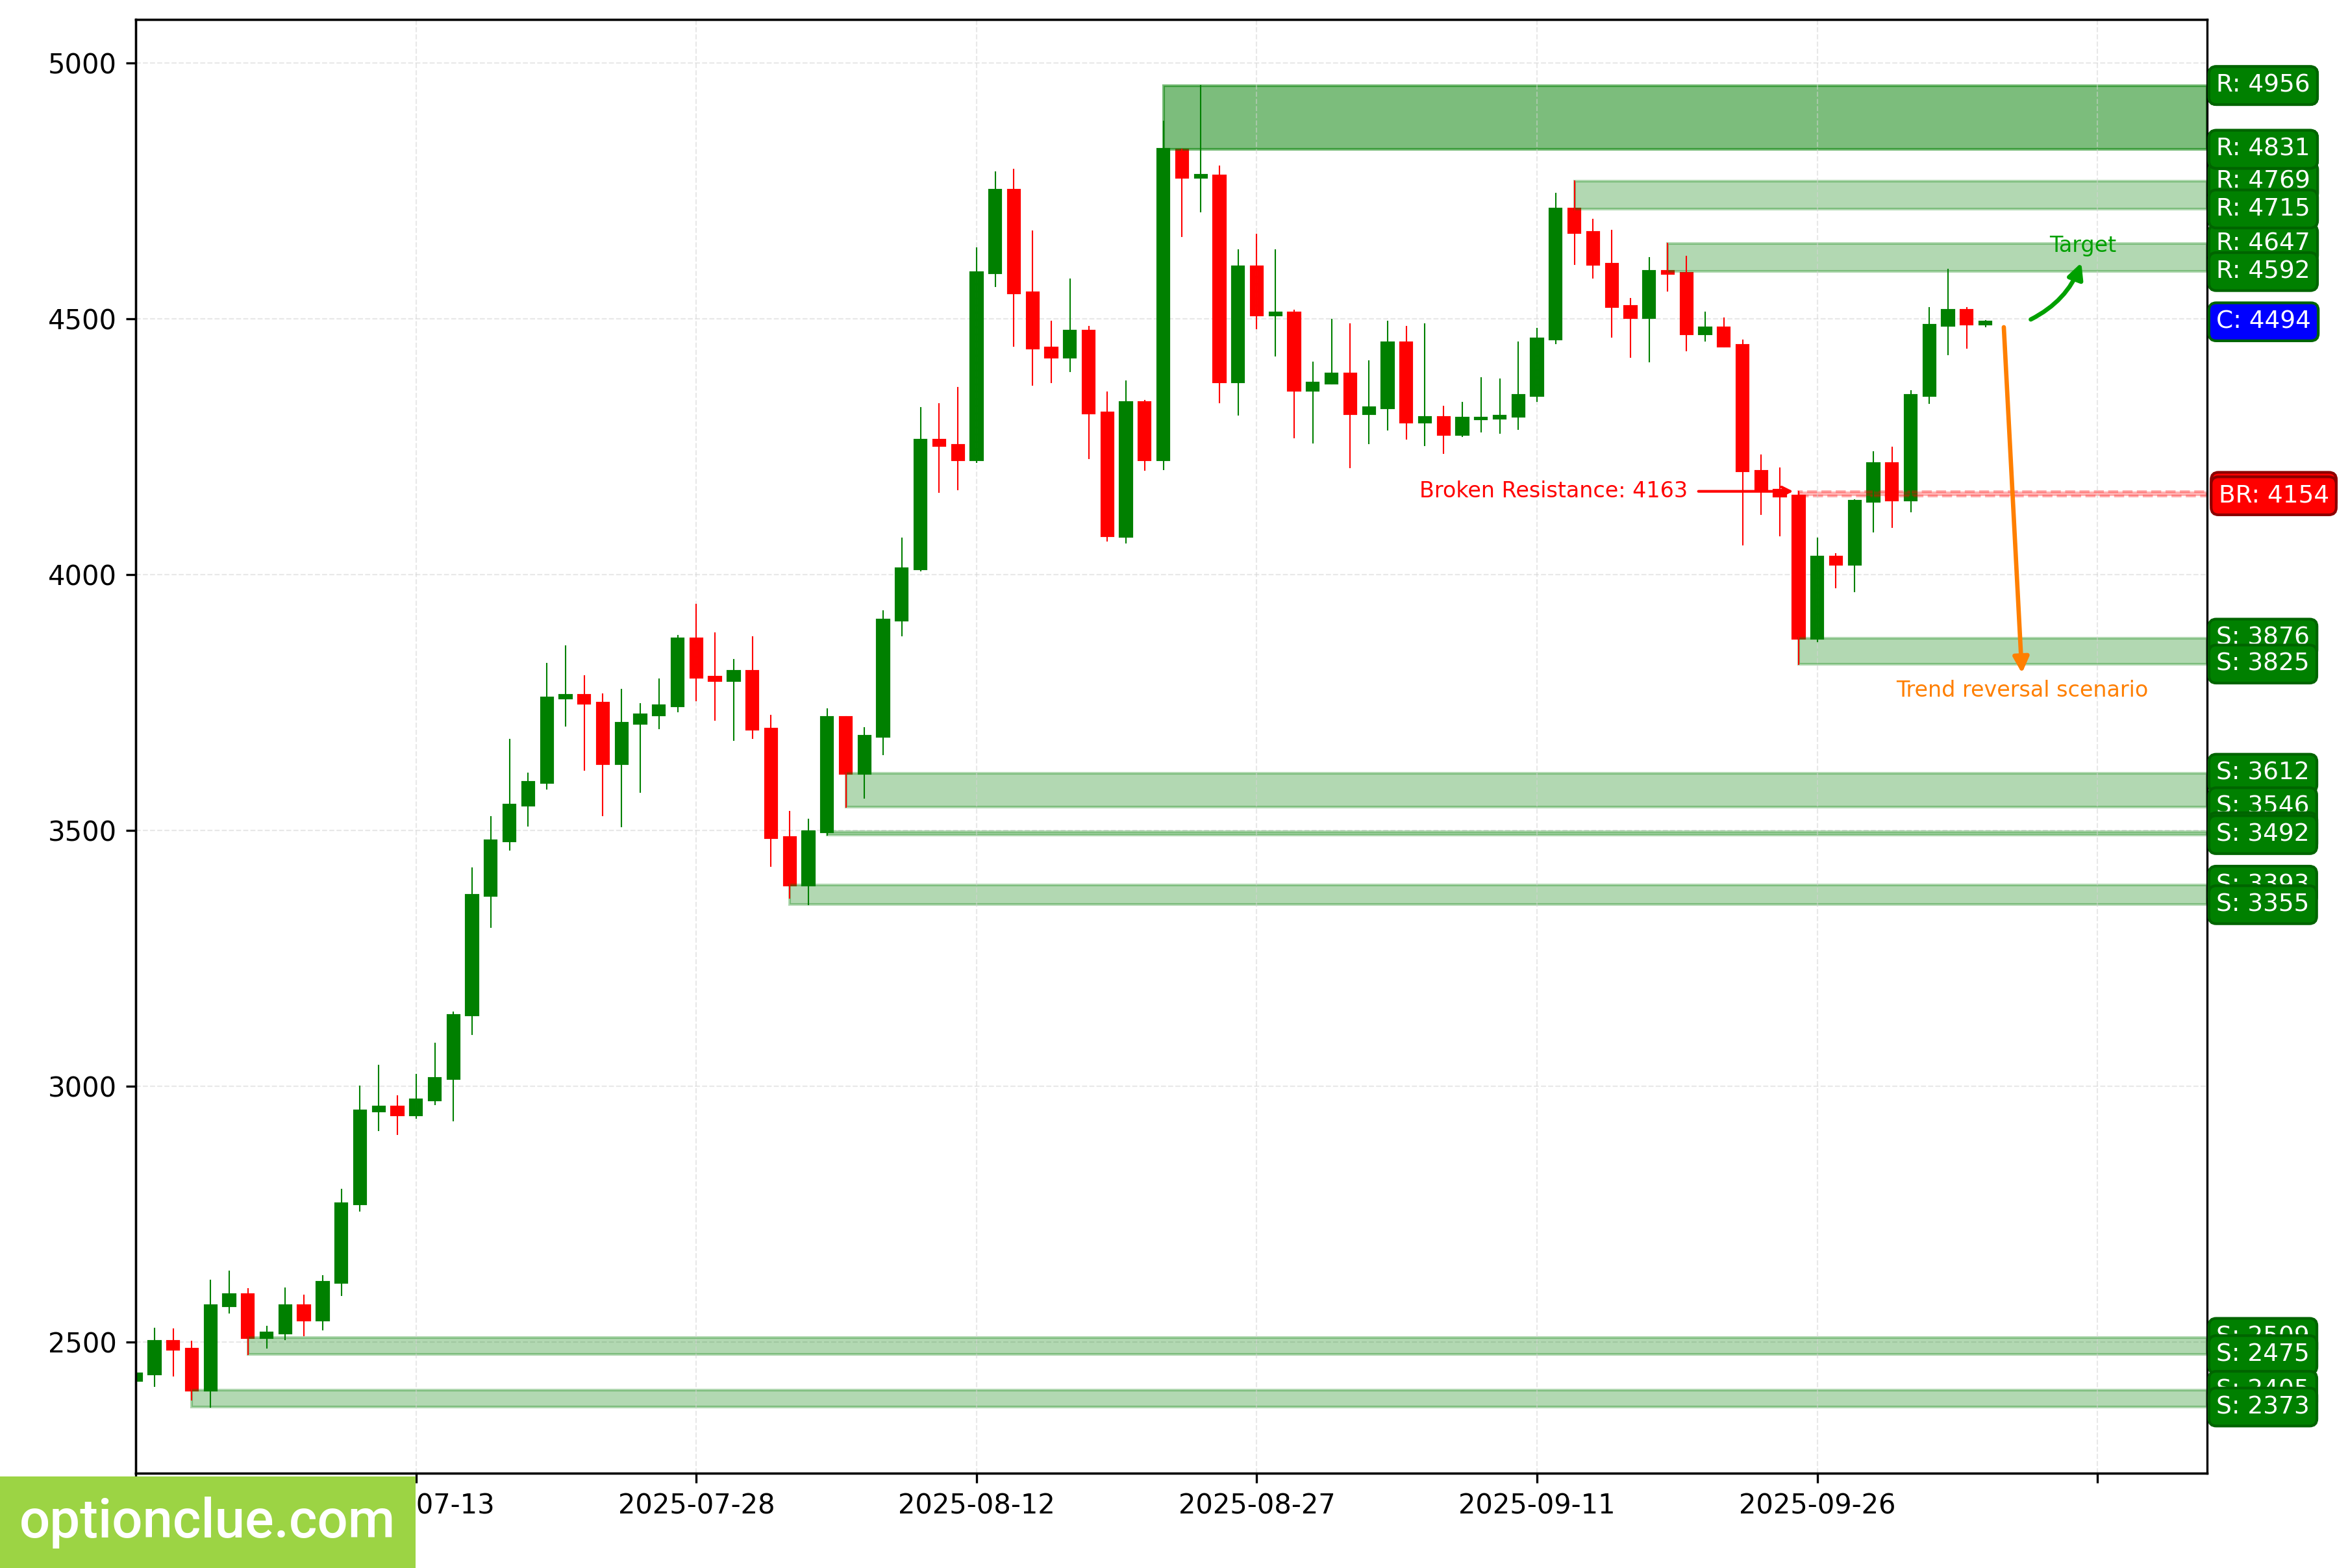
ETH. Technical analysis. D1.
Apple Inc (AAPL)
The bullish trend continues.
An impulse wave is developing on the daily timeframe. A buy entry point on a rebound may appear after a full-fledged correction forms.
The intermediate target for the upward move is the resistance level with boundaries 259.02 — 260.10. Long positions will remain relevant as long as the market is above the nearest support level with boundaries 253.11 — 254.63.
In case of a confirmed breakout of this price zone, the medium-term trend will change to bearish.
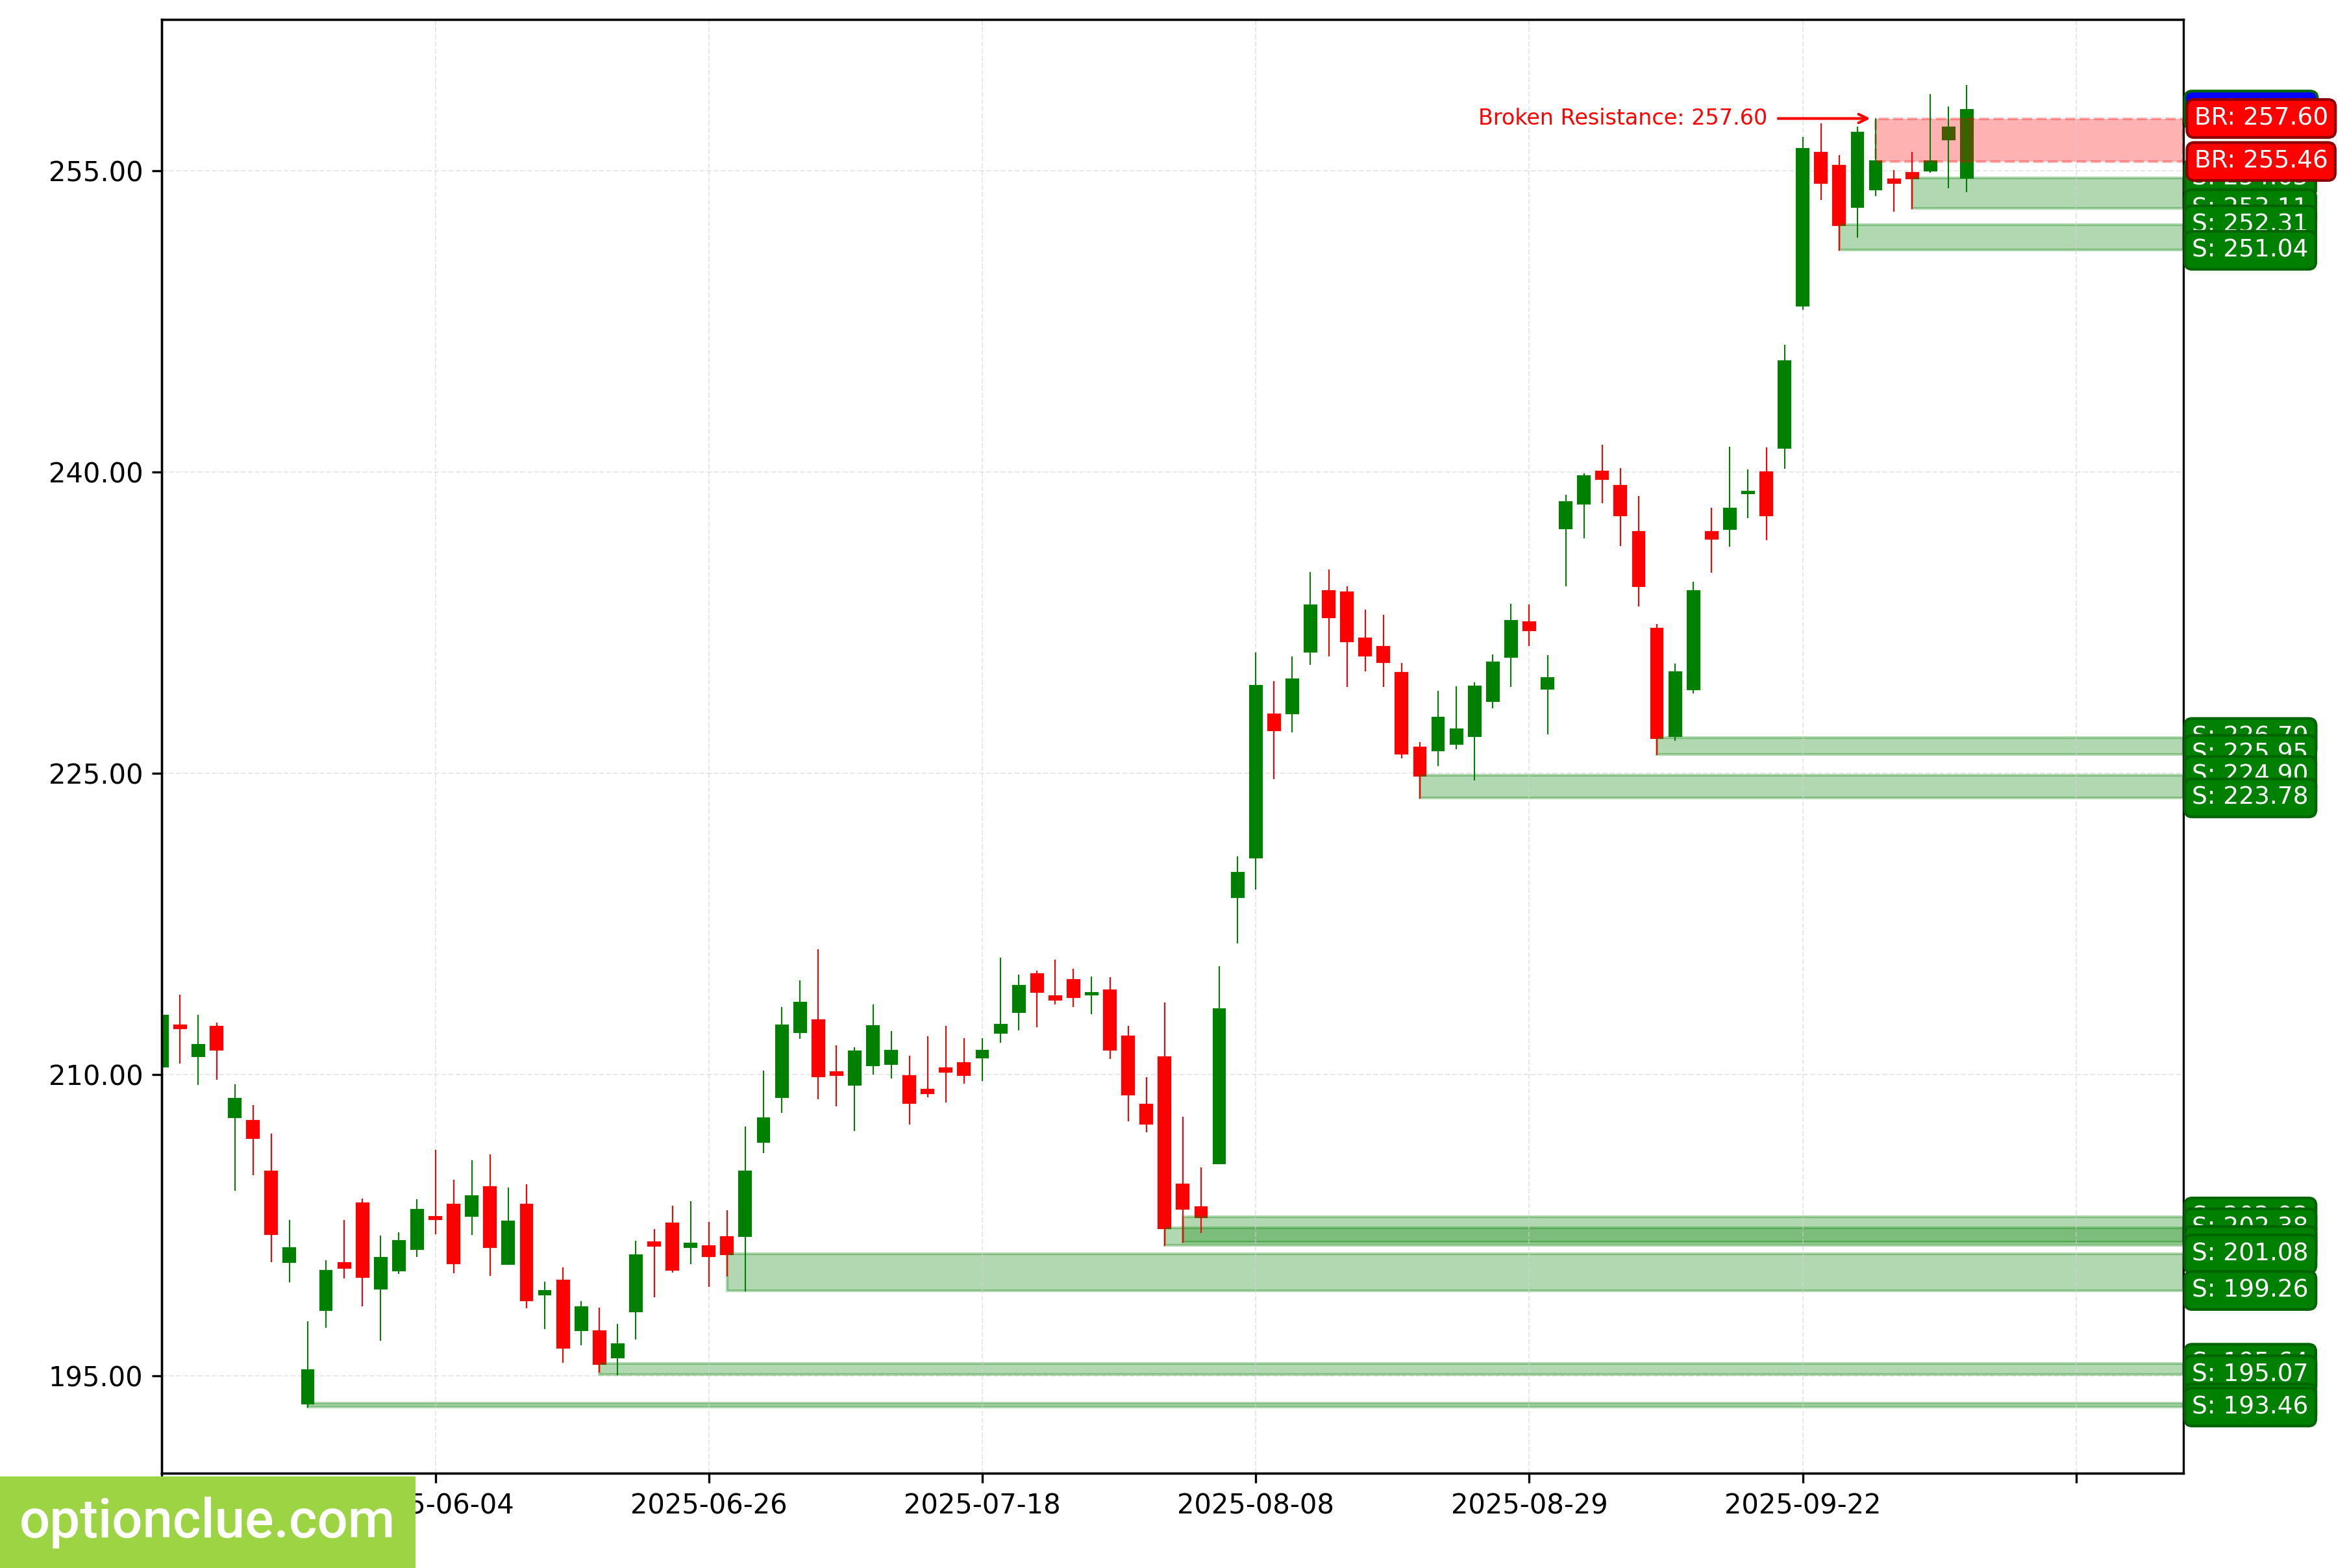
AAPL. Technical analysis. D1.
NVIDIA Corp (NVDA)
The uptrend continues, a corrective wave is developing. A buy entry point on a rebound may appear after its completion.
If the bullish move resumes, the first target will be the resistance level with boundaries 189.60 — 191.05. Long positions will remain relevant as long as the market is above the nearest daily timeframe support level with boundaries 173.13 — 174.48.
In case of a confirmed breakout of this price zone, the medium-term trend will change to bearish.
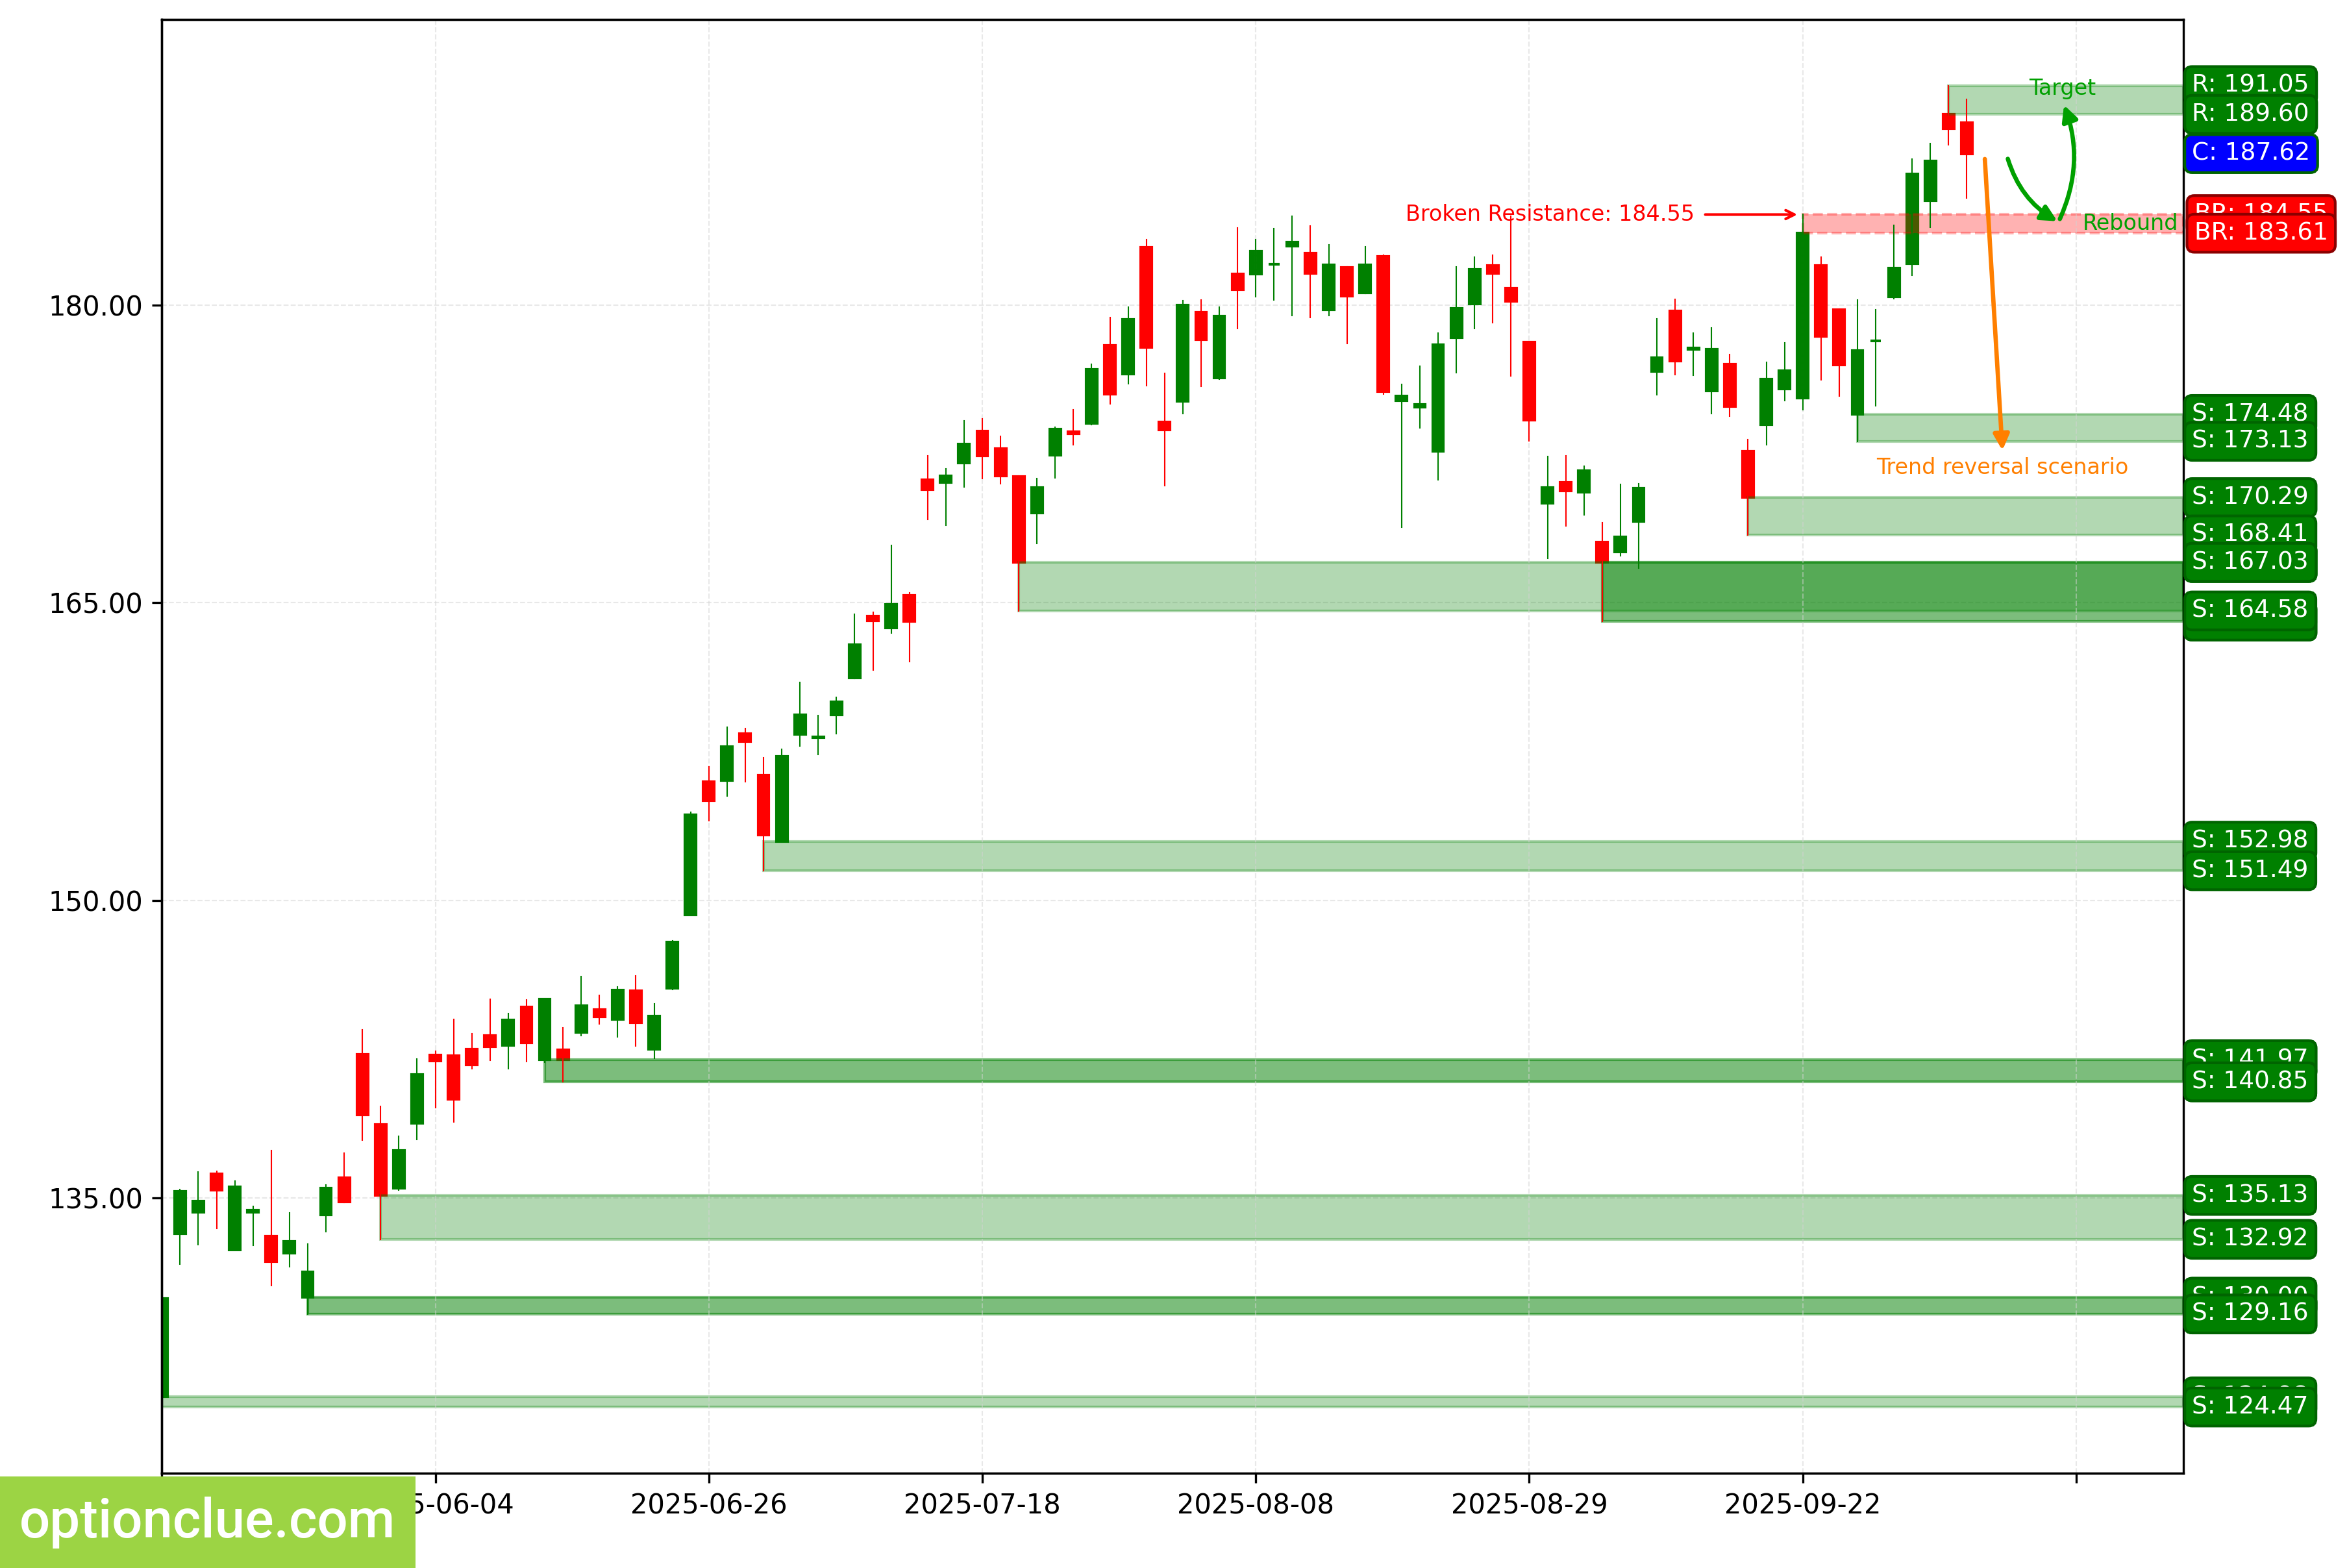
NVDA. Technical analysis. D1.
Tesla Inc (TSLA)
The bullish trend continues, a corrective wave is developing. A buy entry point on a rebound may appear after its completion.
If the upward move resumes, the first target could be the resistance level with boundaries 470.54 — 470.75. In case of a successful trend development, a further target will be near the next resistance with boundaries 479.86 — 488.54.
Long positions may remain relevant as long as the market is above the nearest daily timeframe support level with boundaries 416.56 — 416.85. In case of a confirmed breakout of this price zone, the medium-term trend will change to bearish.
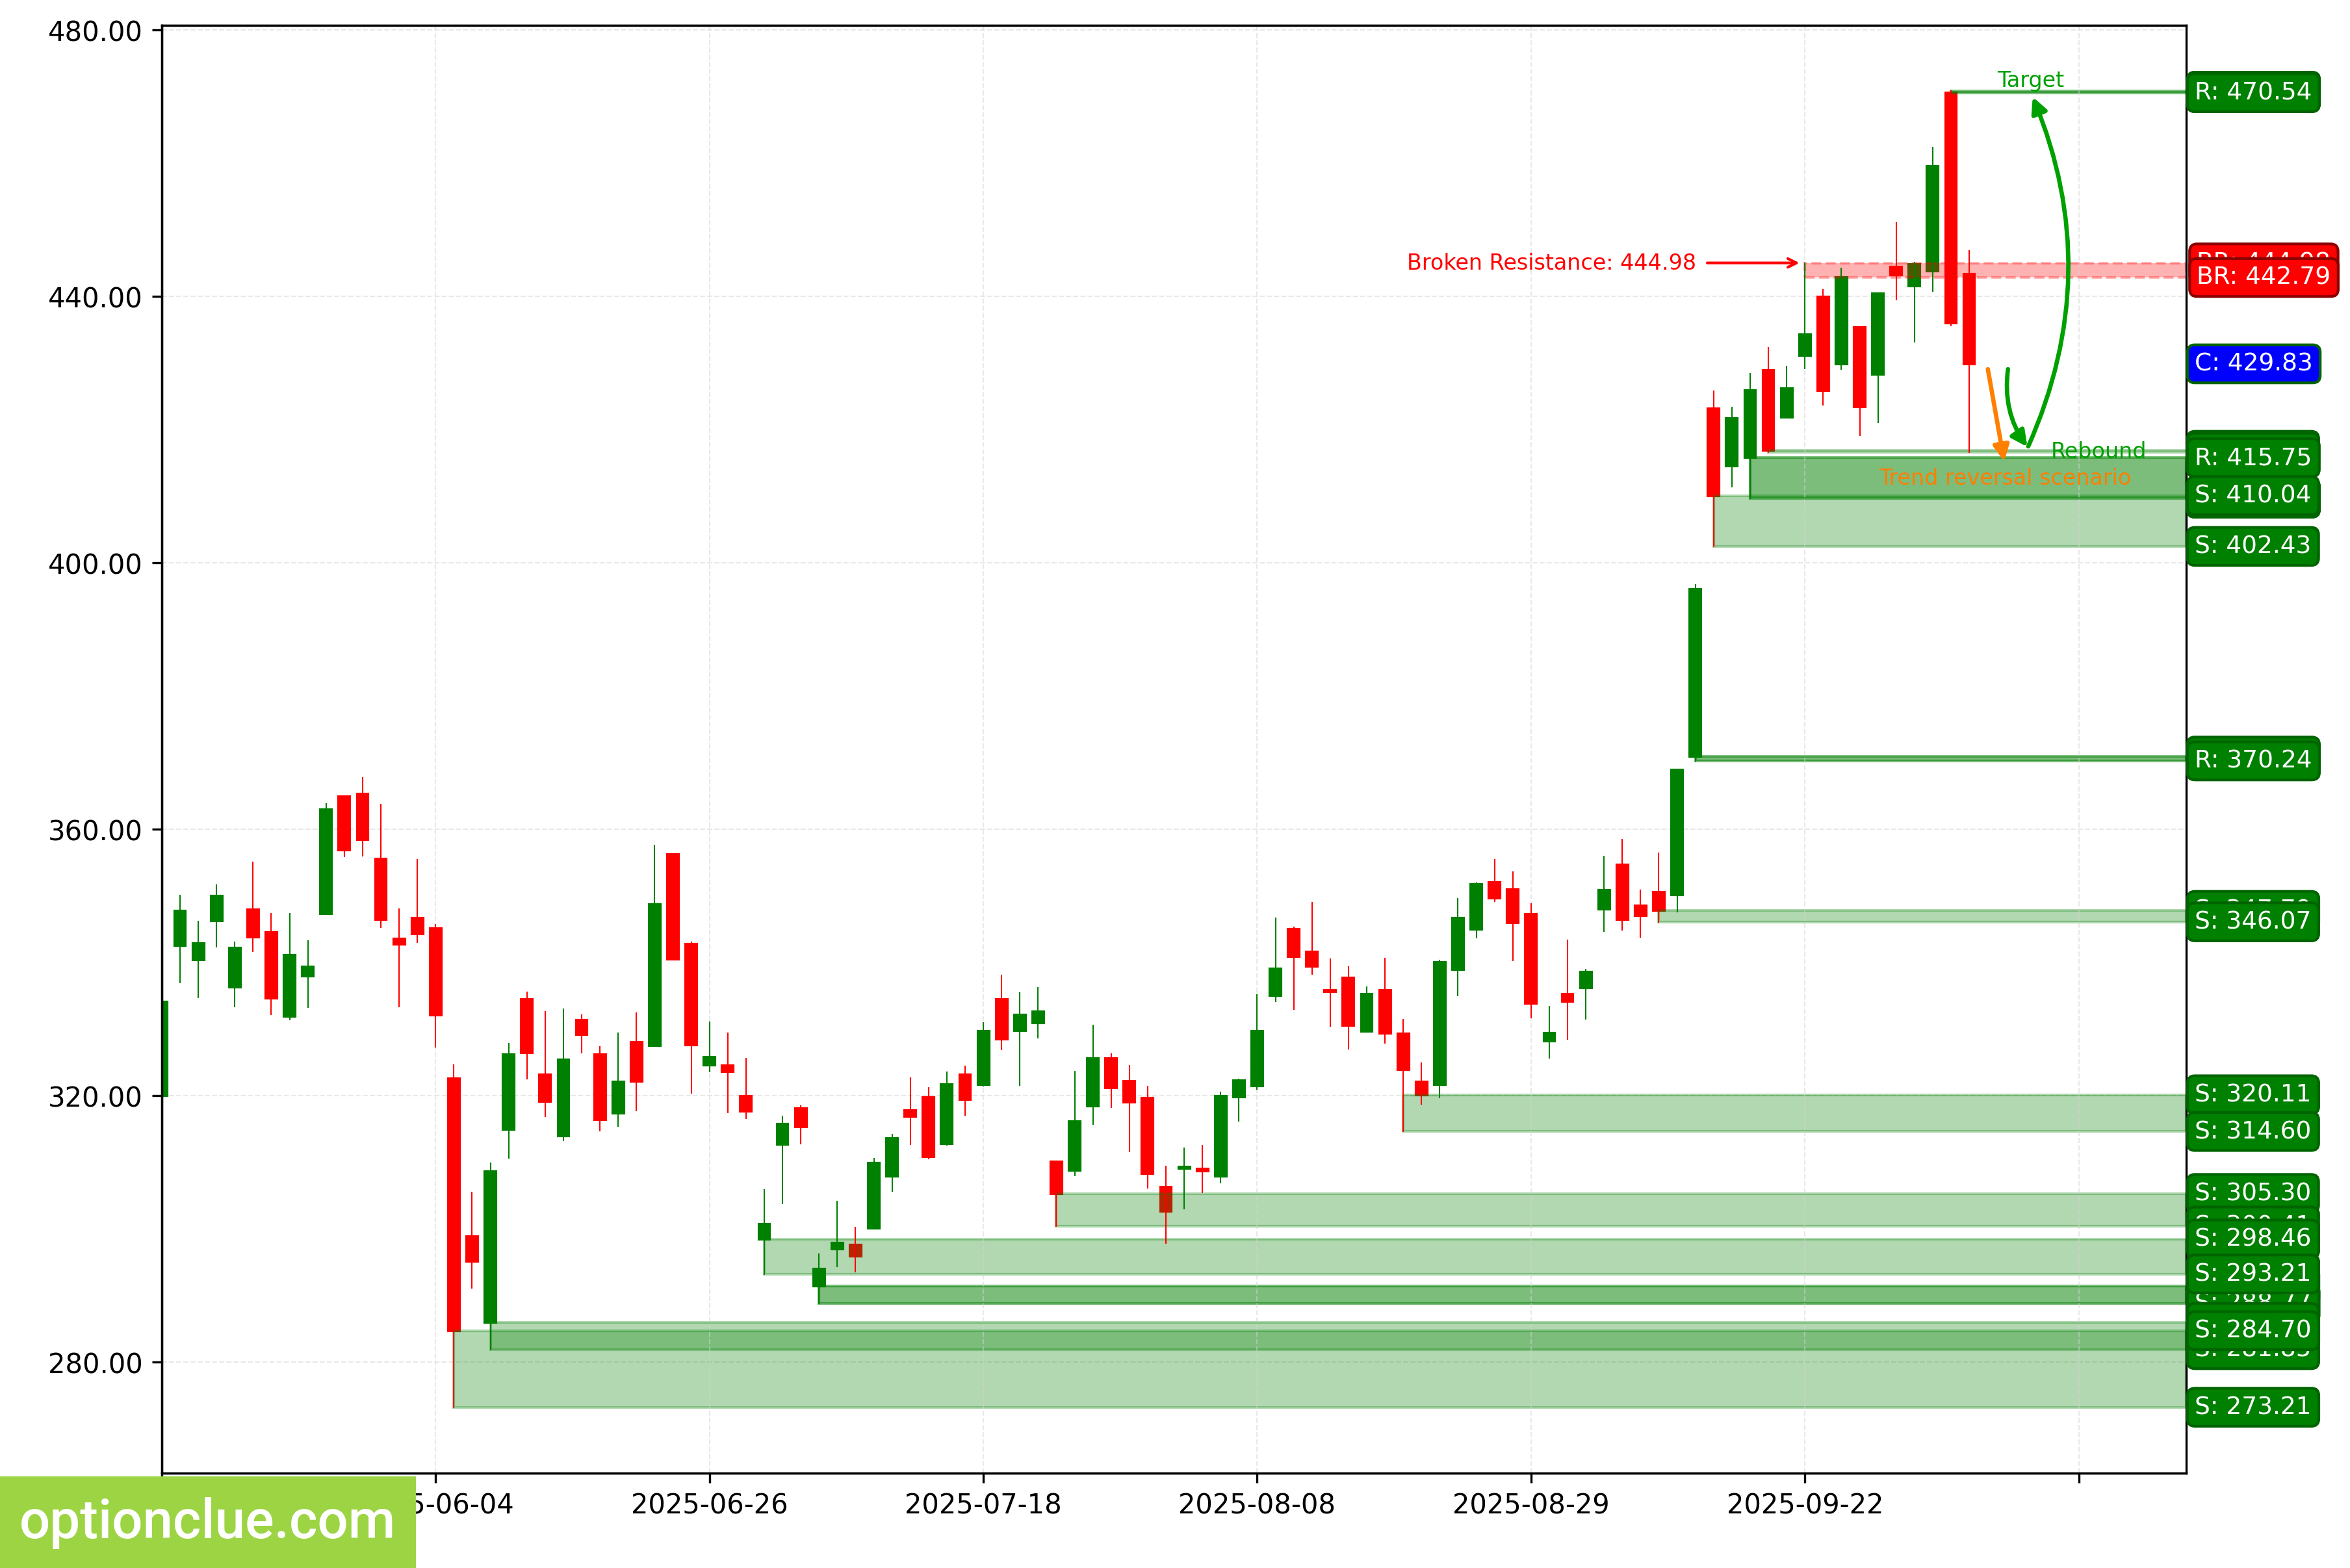
TSLA. Technical analysis. D1.
Summary
On the daily charts, NZDUSD, NVDA, and TSLA are completing corrections — we are waiting for signals for a move with the trend.
The other assets are under observation: much depends on the depth of the market correction.