
We review the most important levels on key financial instruments and likely scenarios for further developments.
Key Topics
- Euro (EURUSD)
- British Pound (GBPUSD)
- Swiss Franc (USDCHF)
- Japanese Yen (USDJPY)
- Canadian Dollar (USDCAD)
- Australian Dollar (AUDUSD)
- Ether (ETH)
- Apple Inc (AAPL)
- Tesla Inc (TSLA)
- Summary
Euro (EURUSD)
Bullish trend continues, a corrective wave is developing again. Entry point for buying on rebound may form after the current correction completes. Last broken level—resistance (1.1590 — 1.1627). Breakout happened 19 candlesticks ago.
Intermediate target for upward movement is the resistance level with boundaries 1.1723 — 1.1755. In case of successful trend development, a farther target will be at the resistance level with boundaries 1.1895 — 1.1927.
If correction completes near the support level (1.1662 — 1.1684), potential profit/risk ratio may be small (approximately 0.6:1). When using farther target—approximately 2.7:1.
Long positions will remain relevant as long as the market stays above the nearest support level with boundaries 1.1662 — 1.1684. If the market successfully closes below this support, the trend will reverse to the opposite (bearish).
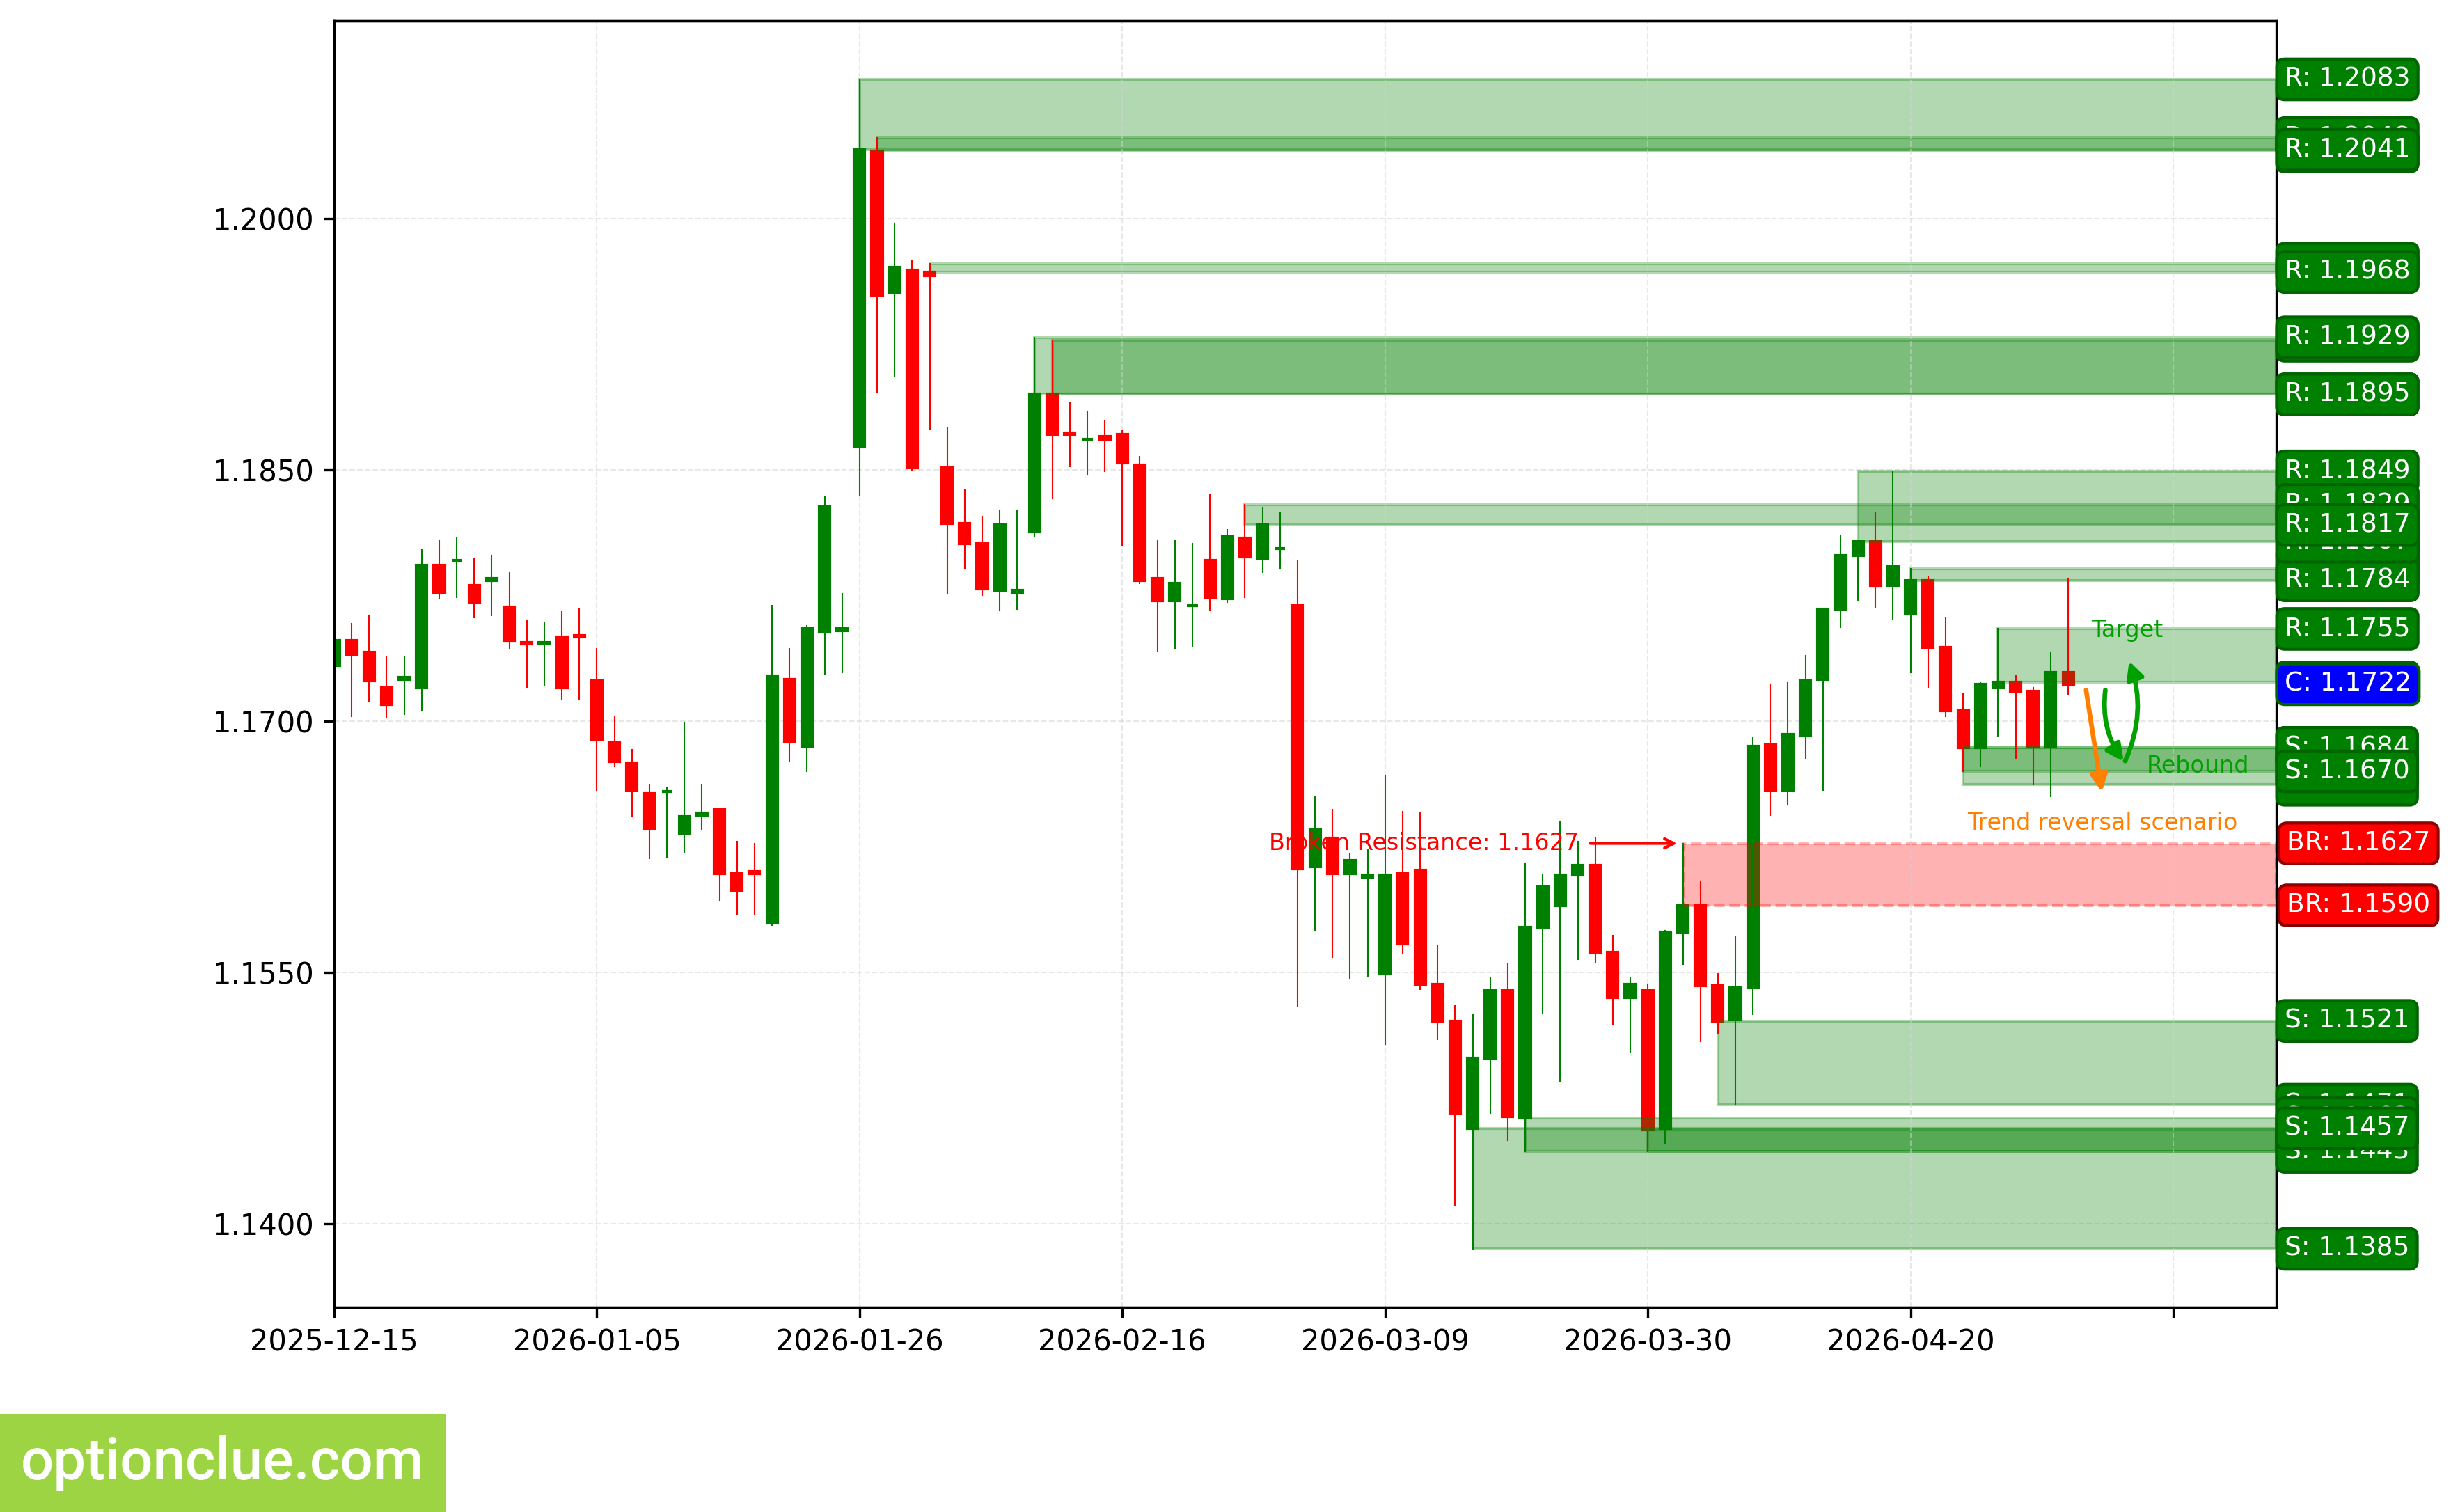
EURUSD. Technical analysis. D1.
British Pound (GBPUSD)
Bullish trend continues, impulse wave is developing. Entry point for buying on rebound may form after a full correction forms. Last broken level—resistance (1.3538 — 1.3576). Breakout happened 2 candlesticks ago, and price has returned to this last broken level.
Intermediate target for upward movement—resistance level with boundaries 1.3653 — 1.3662. In case of successful trend development, farther target will be at the resistance level with boundaries 1.3827 — 1.3848.
Potential profit/risk ratio from current prices when setting targets and fixing risks at daily timeframe levels may be small (around 0.4:1). When using farther target—approximately 1.2:1. If correction completes near the support level (1.3458 — 1.3488), potential profit/risk ratio may be approximately 1.8:1. When selecting farther target—over 3:1.
Long positions will remain relevant as long as the market stays above the nearest support level with boundaries 1.3458 — 1.3488. If the market successfully closes below this nearest support, the trend will reverse to the opposite (bearish).
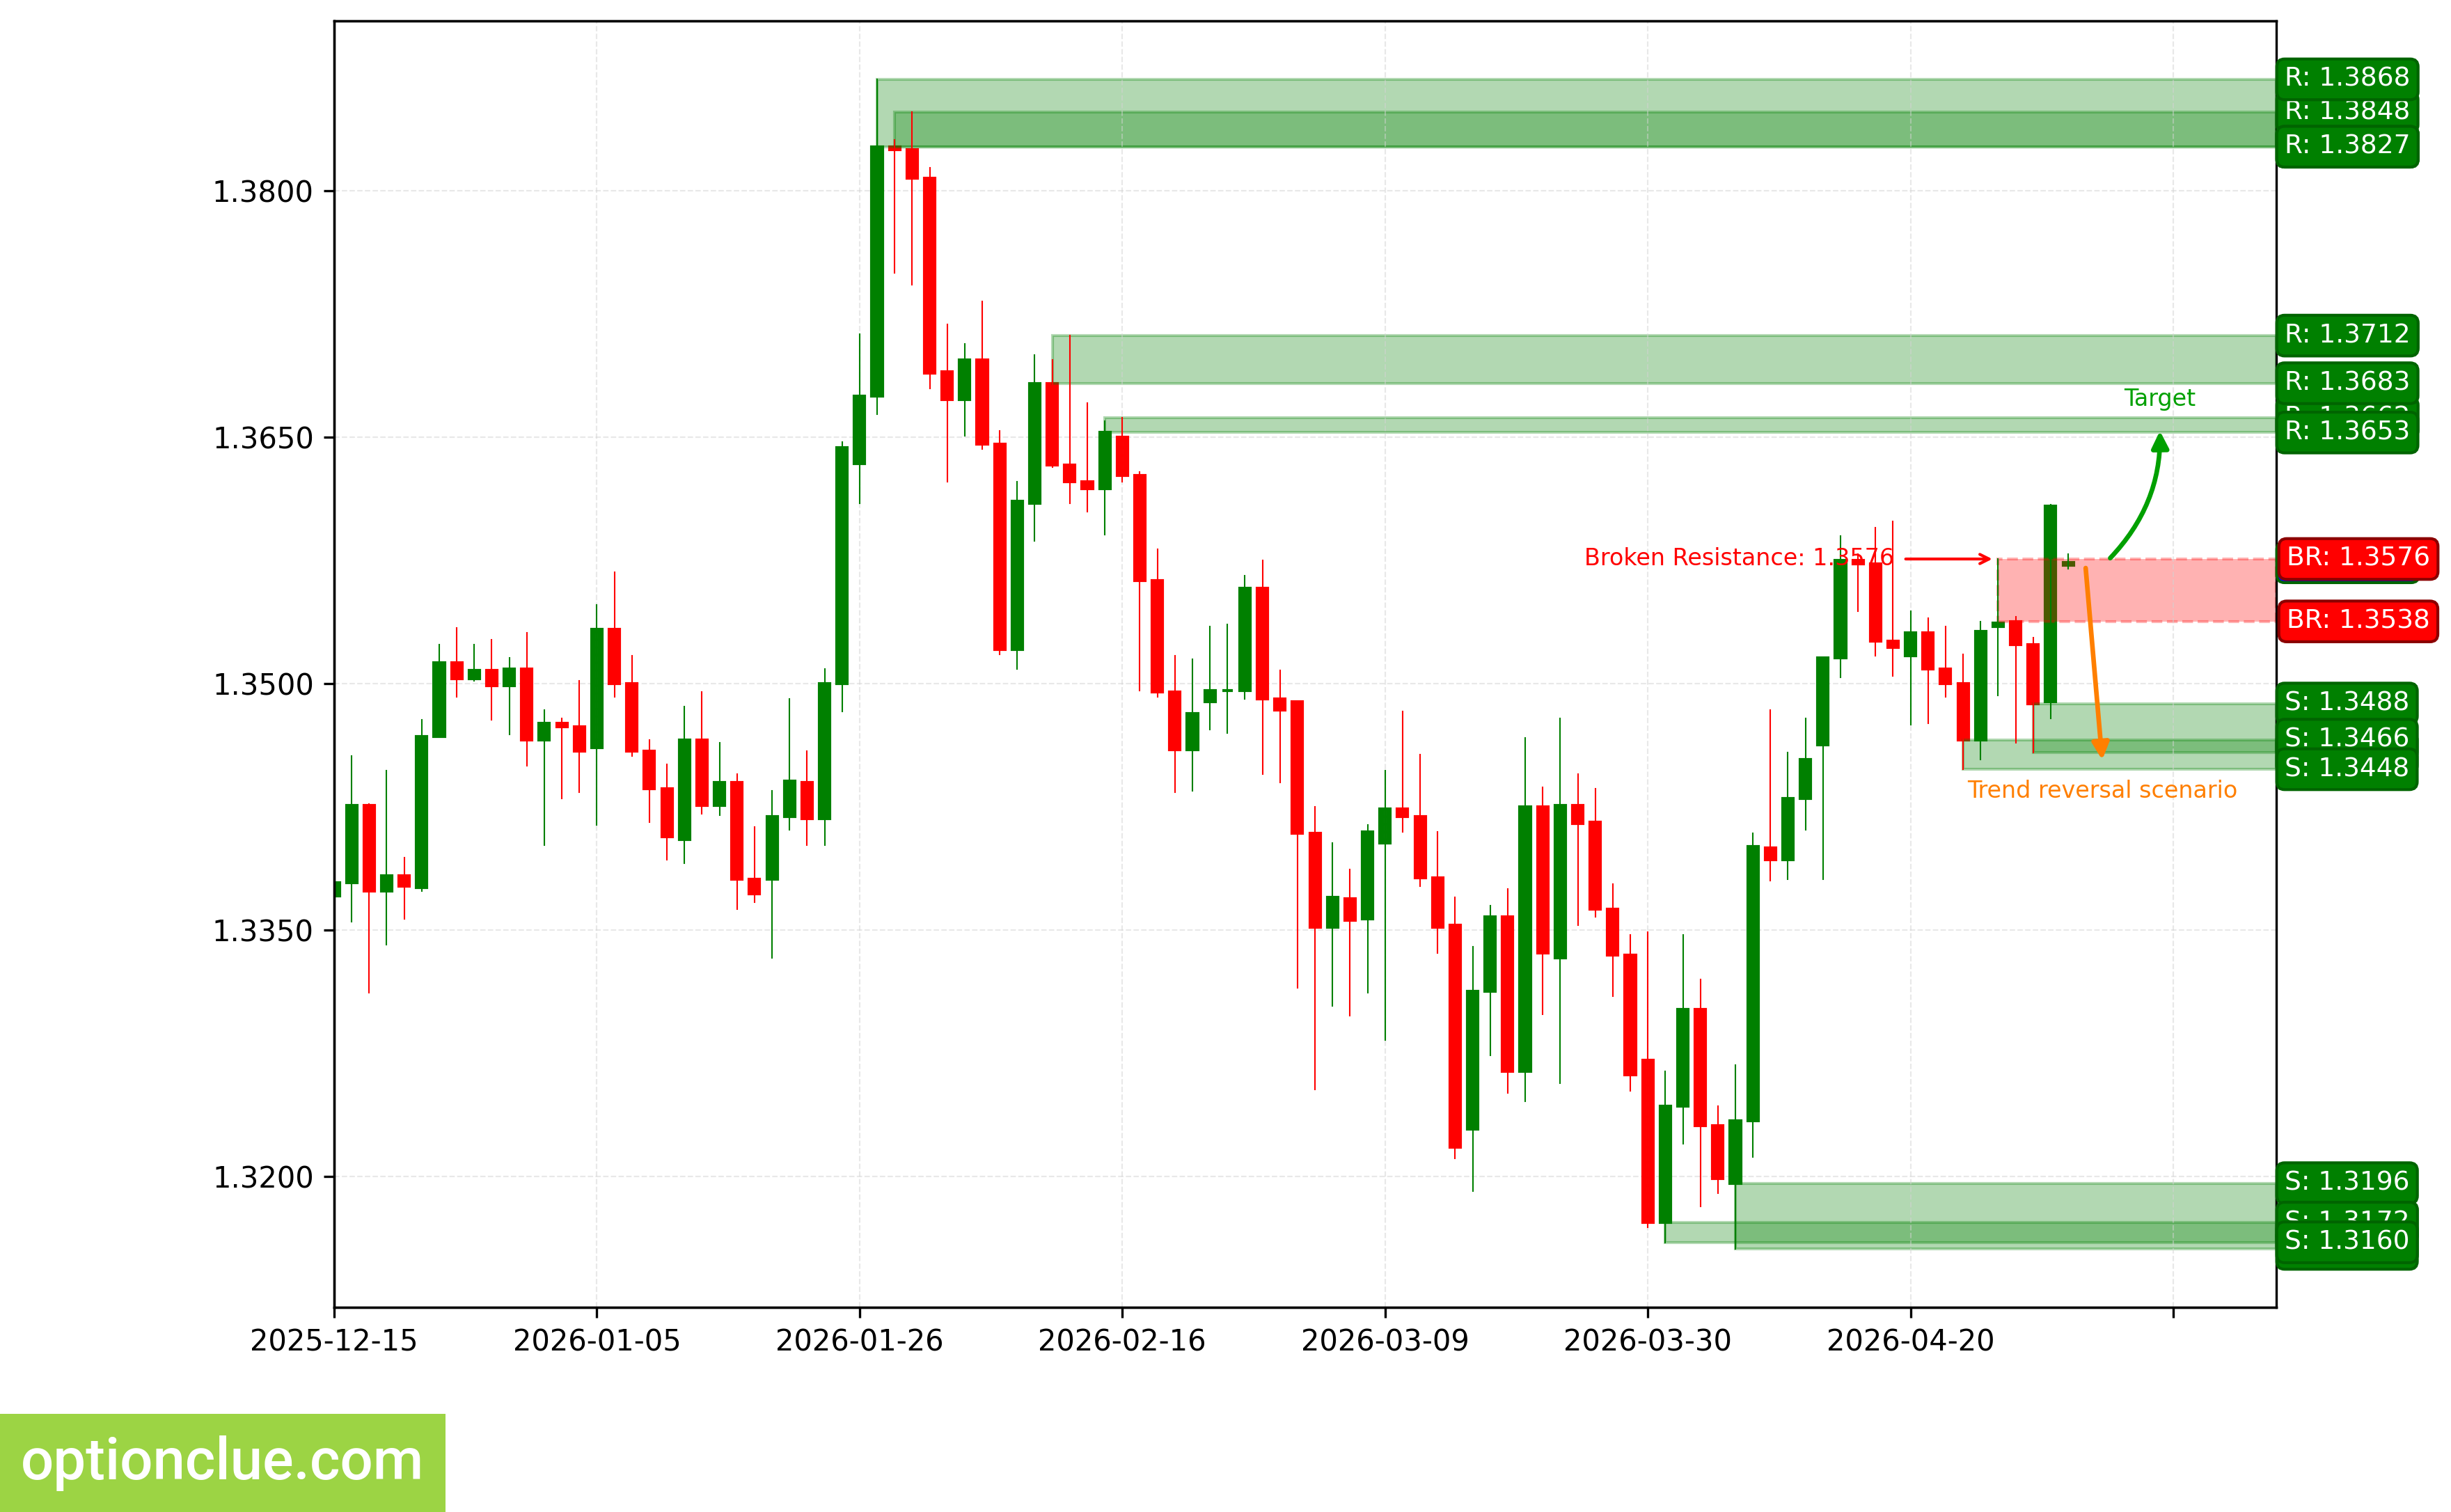
GBPUSD. Technical analysis. D1.
Swiss Franc (USDCHF)
Bearish trend continues. 2 candlesticks ago, support level (0.7828 — 0.7848) was broken, impulse wave is developing.
Intermediate target for downward movement is the support level with boundaries 0.7775 — 0.7782. In case of successful trend development, farther target will be at the support level with boundaries 0.7668 — 0.7689.
If new correction completes near the resistance level (0.7912 — 0.7924), potential profit/risk ratio may be approximately 2:1. When using farther target—around 3:1. If next correction completes near the last broken level (0.7828 — 0.7848), potential profit/risk ratio may be small (around 0.4:1). When selecting farther target—also small (approximately 1:1).
Short positions will remain relevant as long as the market stays below the nearest resistance level with boundaries 0.7912 — 0.7924. If the market successfully closes above this nearest resistance, the trend will reverse to the opposite (bullish).
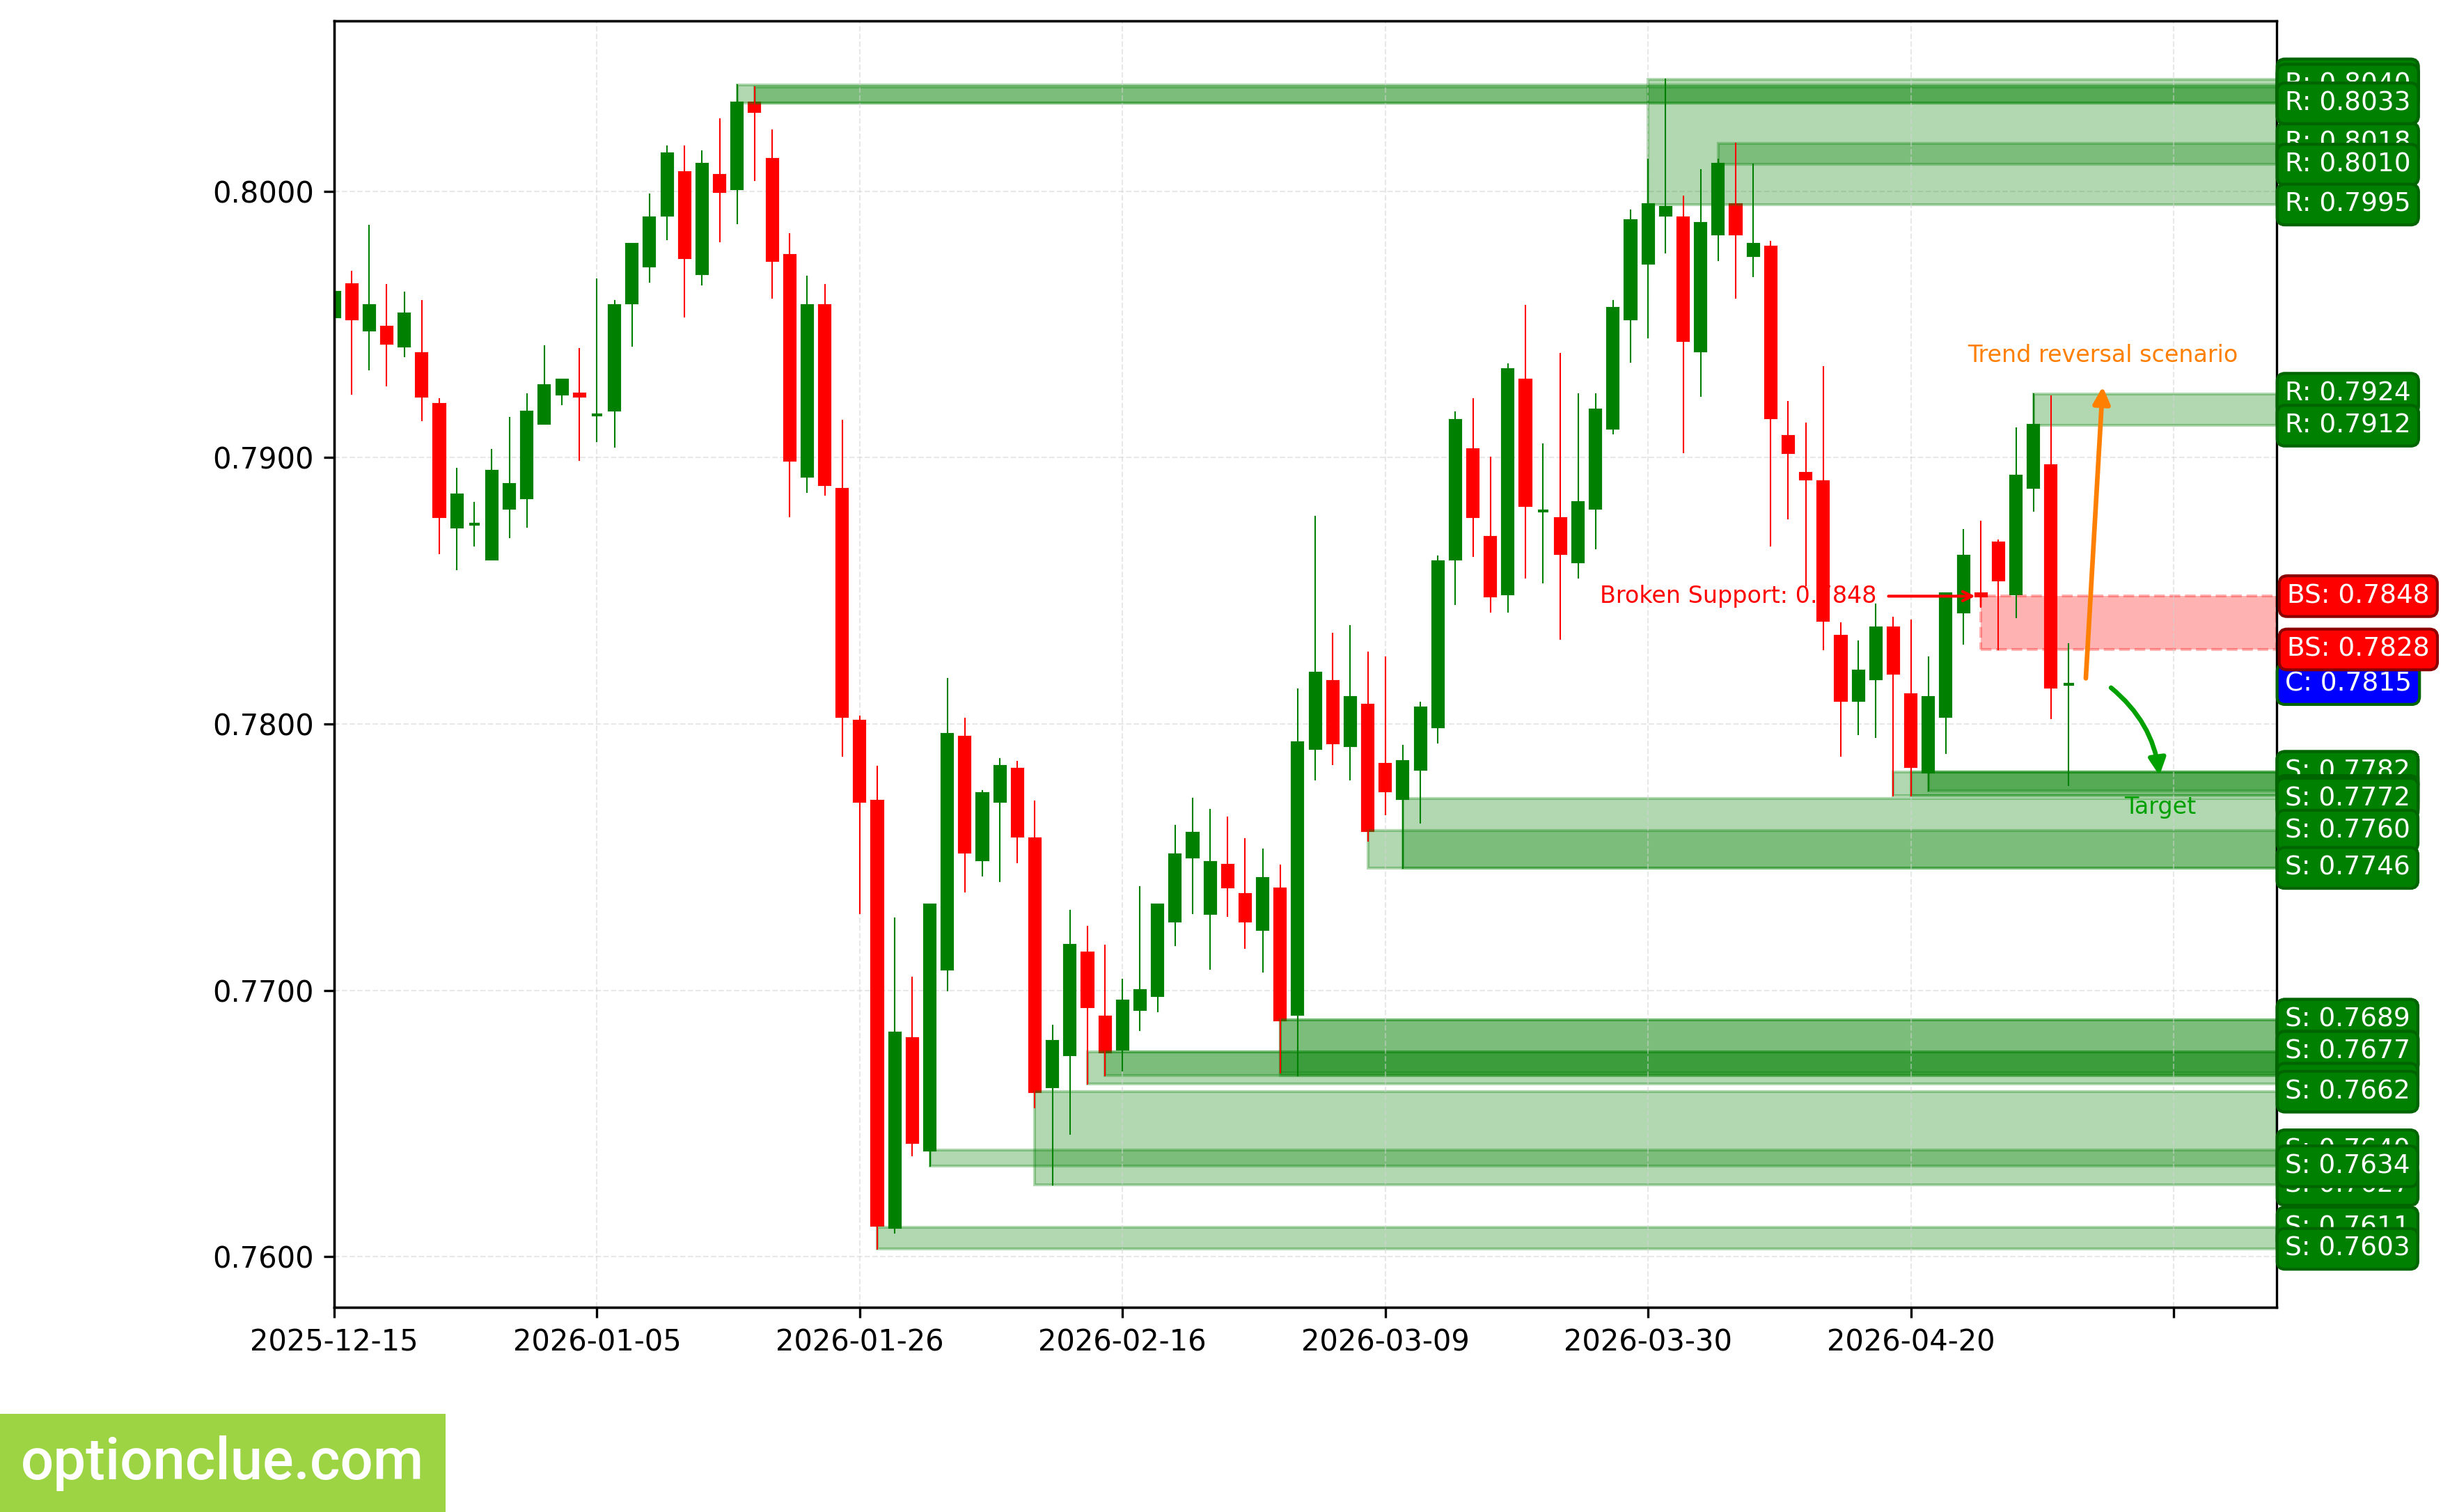
USDCHF. Technical analysis. D1.
Japanese Yen (USDJPY)
Trend has turned bearish when support level (158.90 — 159.35) was broken. Breakout happened 2 candlesticks ago. Corrective wave is developing. Entry point for selling on rebound may form after the current correction completes.
Intermediate target for downward movement is the support level with boundaries 156.47 — 156.98. In case of successful trend development, farther target will be at the support level with boundaries 154.01 — 154.66.
Potential profit/risk ratio from current prices when setting targets and fixing risks at daily timeframe levels may be less than 0.1:1. When using farther target—small (approximately 0.5:1). If correction completes near the resistance level (160.20 — 160.72), potential profit/risk ratio may be approximately 2:1. For farther target—over 3:1. If correction completes near the last broken level (158.90 — 159.35), potential profit/risk ratio may be small (around 0.7:1). When selecting farther target—around 1.5:1.
Short positions will remain relevant as long as the market stays below the nearest resistance level with boundaries 160.20 — 160.72. If the market successfully closes above this nearest resistance, the trend will reverse to the opposite (bullish).
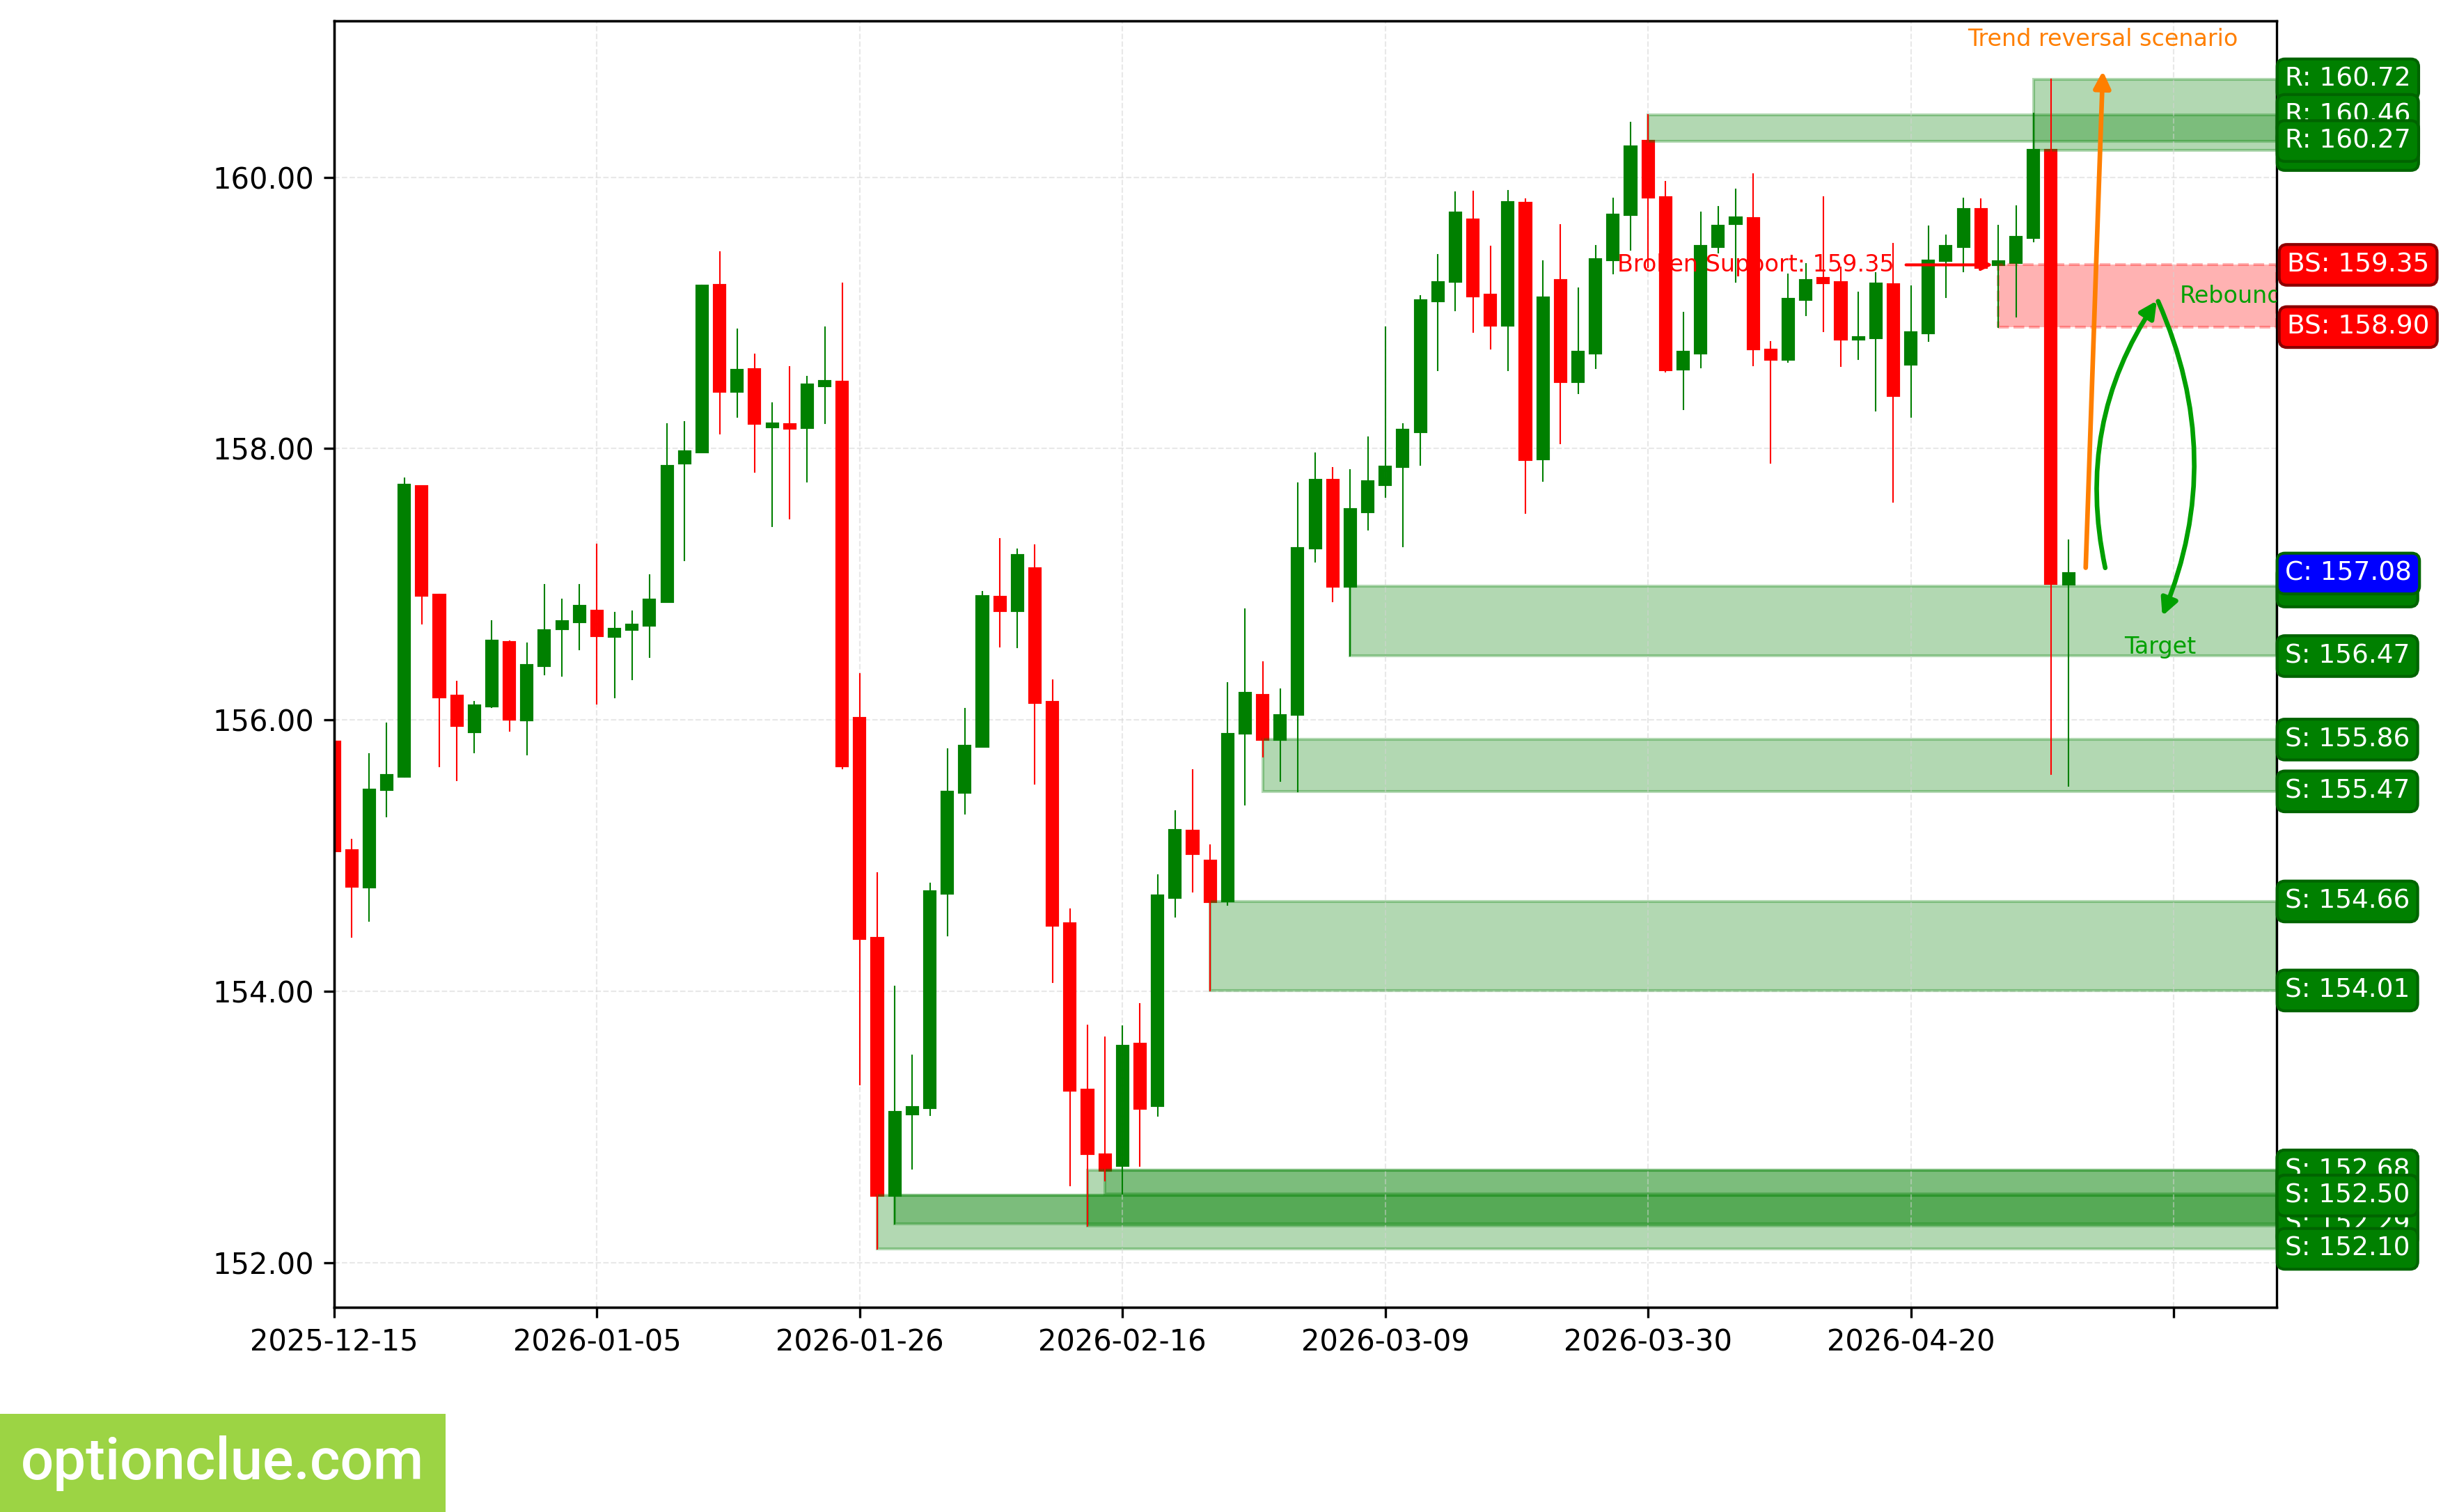
USDJPY. Technical analysis. D1.
Canadian Dollar (USDCAD)
Bearish trend continues, corrective wave is developing. Entry point for selling on rebound may form after the current correction completes. Last broken level—support (1.3595 — 1.3626). Breakout happened 2 candlesticks ago.
Intermediate target for downward movement is the support level with boundaries 1.3523 — 1.3578.
Potential profit/risk ratio from current prices when setting targets and fixing risks at daily timeframe levels may be less than 0.1:1. If new correction completes near the resistance level (1.3688 — 1.3710), potential profit/risk ratio may be approximately 1.4:1. If correction completes near the last broken level (1.3595 — 1.3626), potential profit/risk ratio may be small (around 0.2:1).
Short positions will remain relevant as long as the market stays below the nearest resistance level with boundaries 1.3688 — 1.3710. If the market successfully closes above this nearest resistance, the trend will reverse to the opposite (bullish).
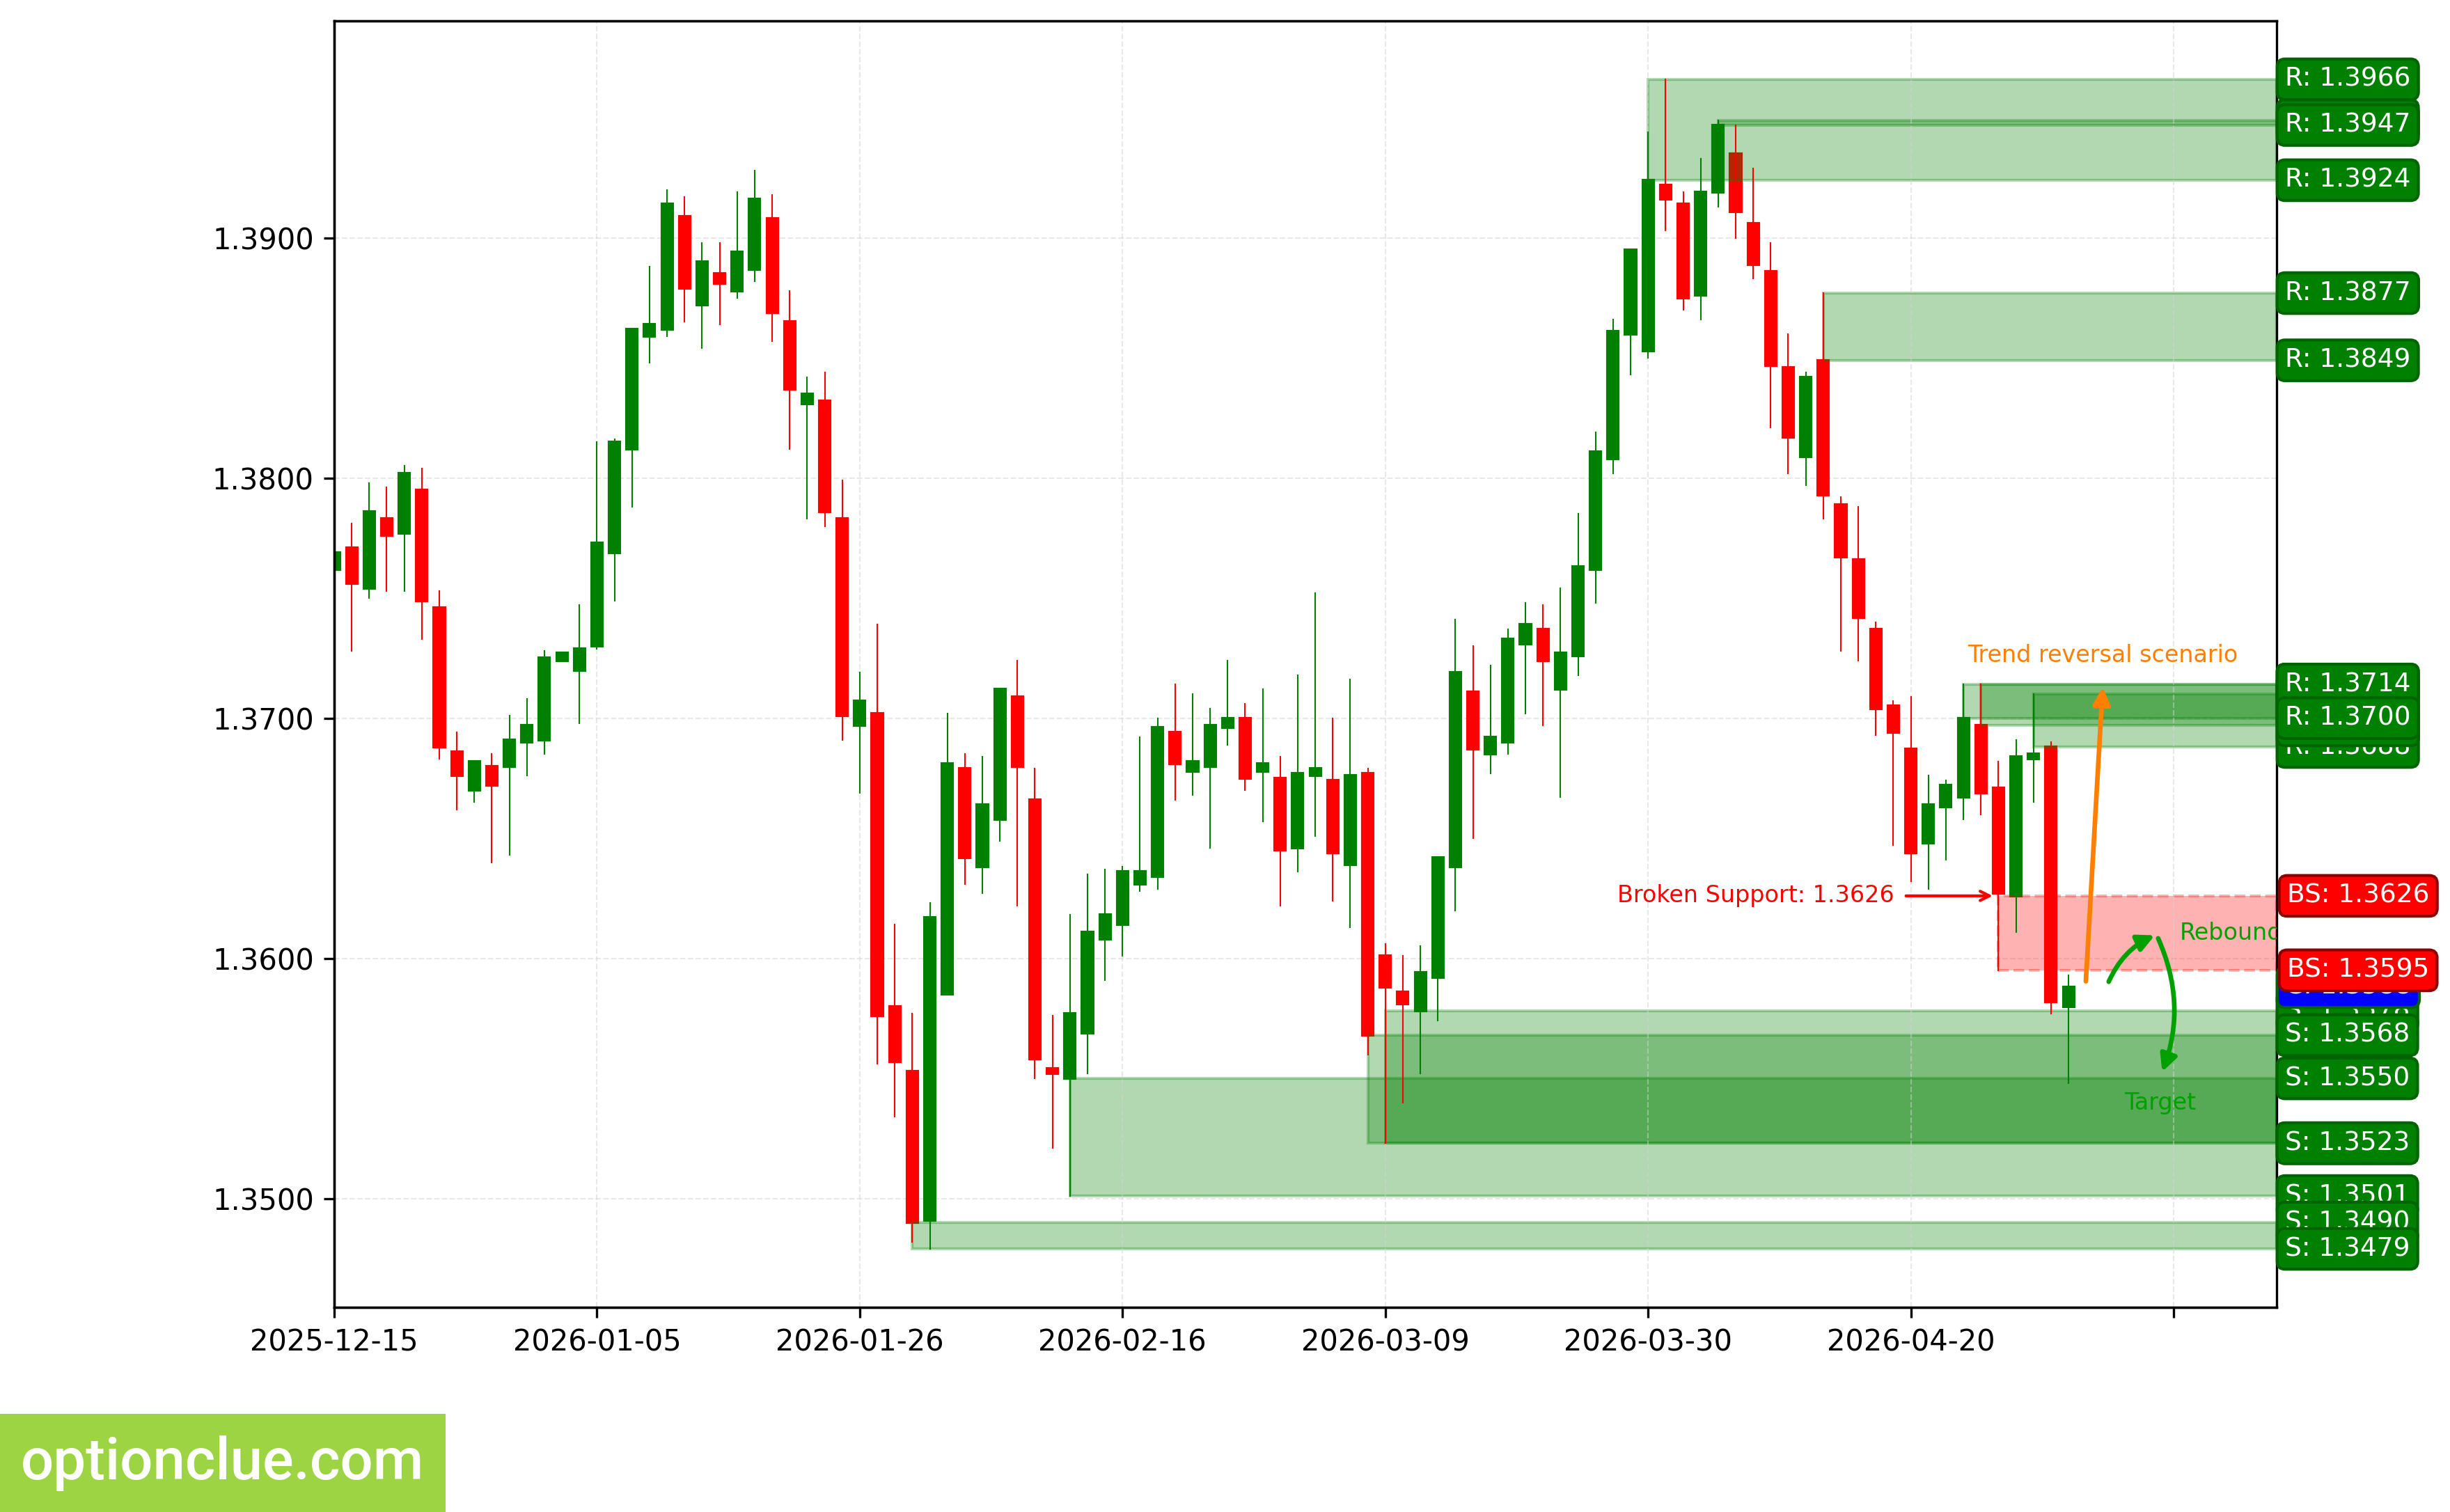
USDCAD. Technical analysis. D1.
Australian Dollar (AUDUSD)
Bullish trend continues, impulse wave is developing after recent breakout. Last broken level—resistance (0.7187 — 0.7199). Breakout happened 2 candlesticks ago.
Long positions will remain relevant as long as the market stays above the nearest support level with boundaries 0.7100 — 0.7114. If the market successfully closes below this support, the trend will reverse to the opposite (bearish).
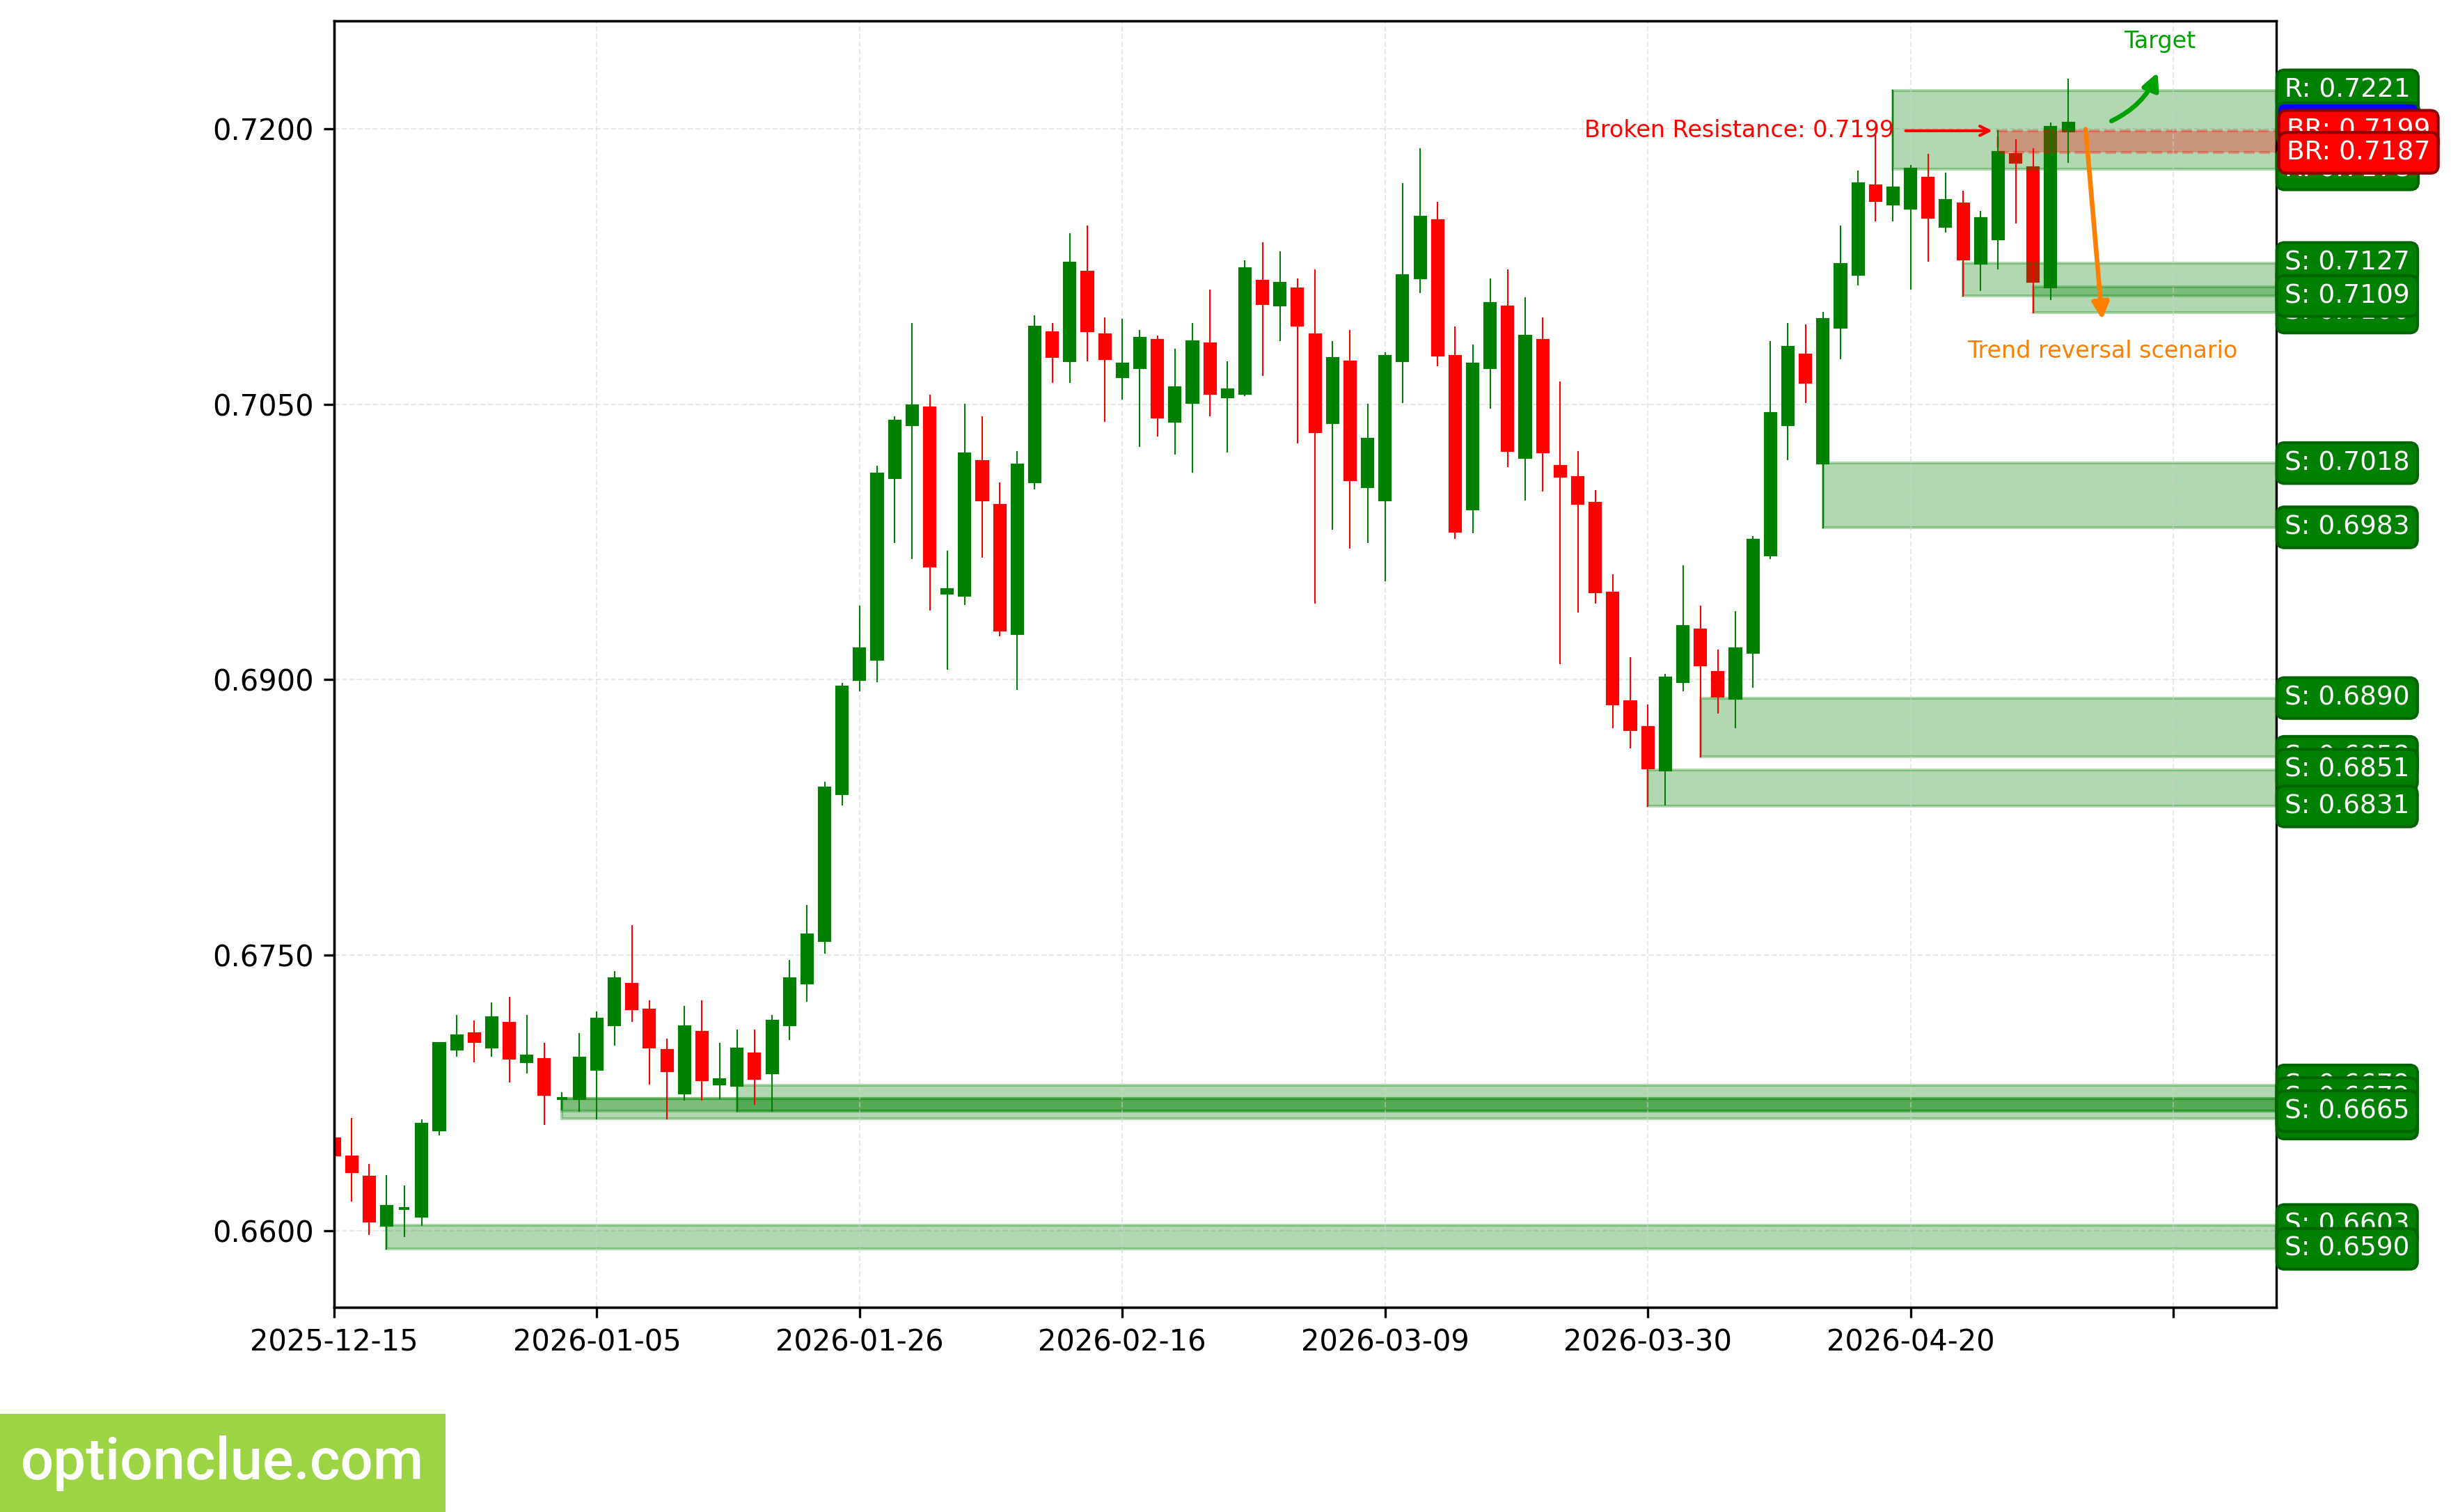
AUDUSD. Technical analysis. D1.
Bitcoin (BTC)
Trend has turned bearish, when 4 candlesticks ago support level (77185 — 77455) was broken. Corrective wave is developing. Entry point for selling on rebound may form after the current correction completes.
Intermediate target for downward movement is the support level with boundaries 74959 — 75776. In case of successful trend development, farther target will be at the support level with boundaries 70589 — 70758.
Potential profit/risk ratio from current prices when setting targets and fixing risks at daily timeframe levels may be small (approximately 0.7:1). When using farther target—approximately 2:1. If correction completes near the resistance level (78661 — 79488), potential profit/risk ratio may be around 1.3:1. When using farther target—around 3:1.
Short positions will remain relevant as long as the market stays below the nearest resistance level with boundaries 78661 — 79488. If the market successfully closes above this nearest resistance, the trend will reverse to the opposite (bullish).
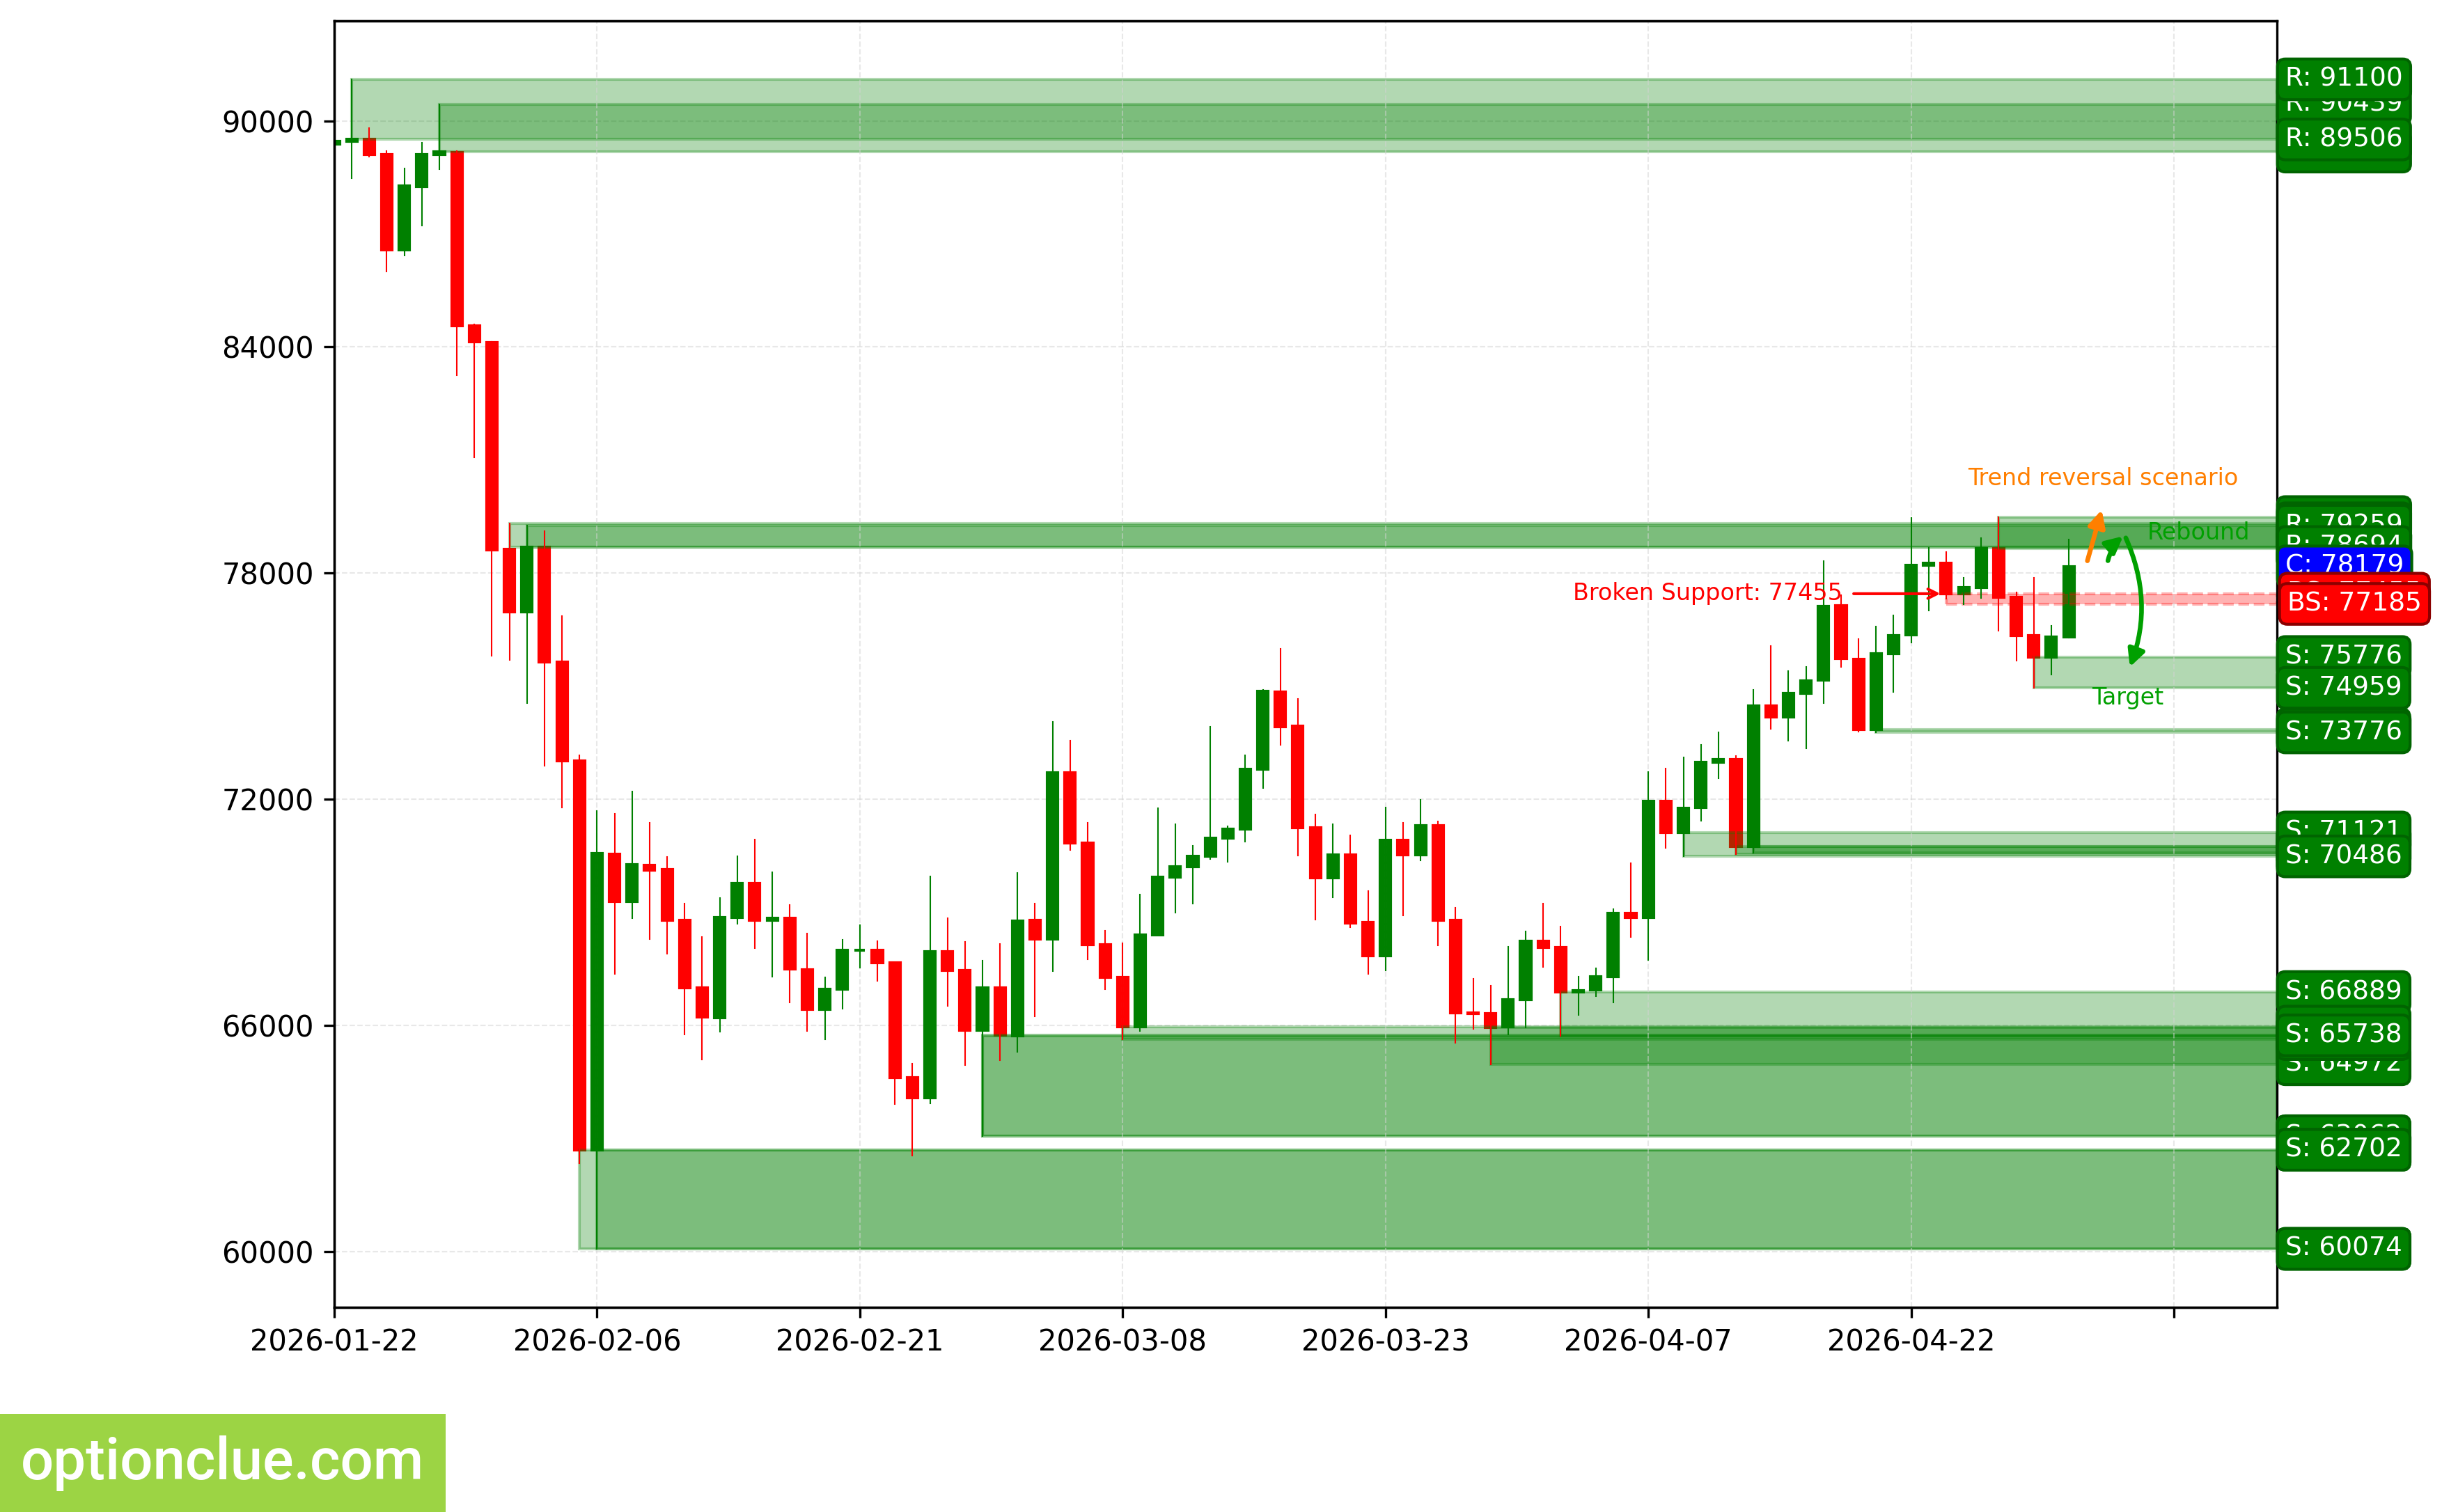
BTC. Technical analysis. D1.
Ether (ETH)
Trend has turned bearish 4 candlesticks ago, when support level (2302 — 2316) was broken. Corrective wave is developing. Entry point for selling on rebound may form after the current correction completes.
Intermediate target for downward movement is the support level with boundaries 2221 — 2253. In case of successful trend development, farther target will be at the support level with boundaries 2023 — 2053.
Potential profit/risk ratio from current prices when setting targets and fixing risks at daily timeframe levels may be small (around 0.2:1). When using farther target—approximately 1.3:1. If correction completes near the resistance level (2370 — 2404), potential profit/risk ratio may be approximately 1.3:1. When using farther target—over 3:1.
Short positions will remain relevant as long as the market stays below the nearest resistance level with boundaries 2370 — 2404. If the market successfully closes above this nearest resistance, the trend will reverse to the opposite (bullish).
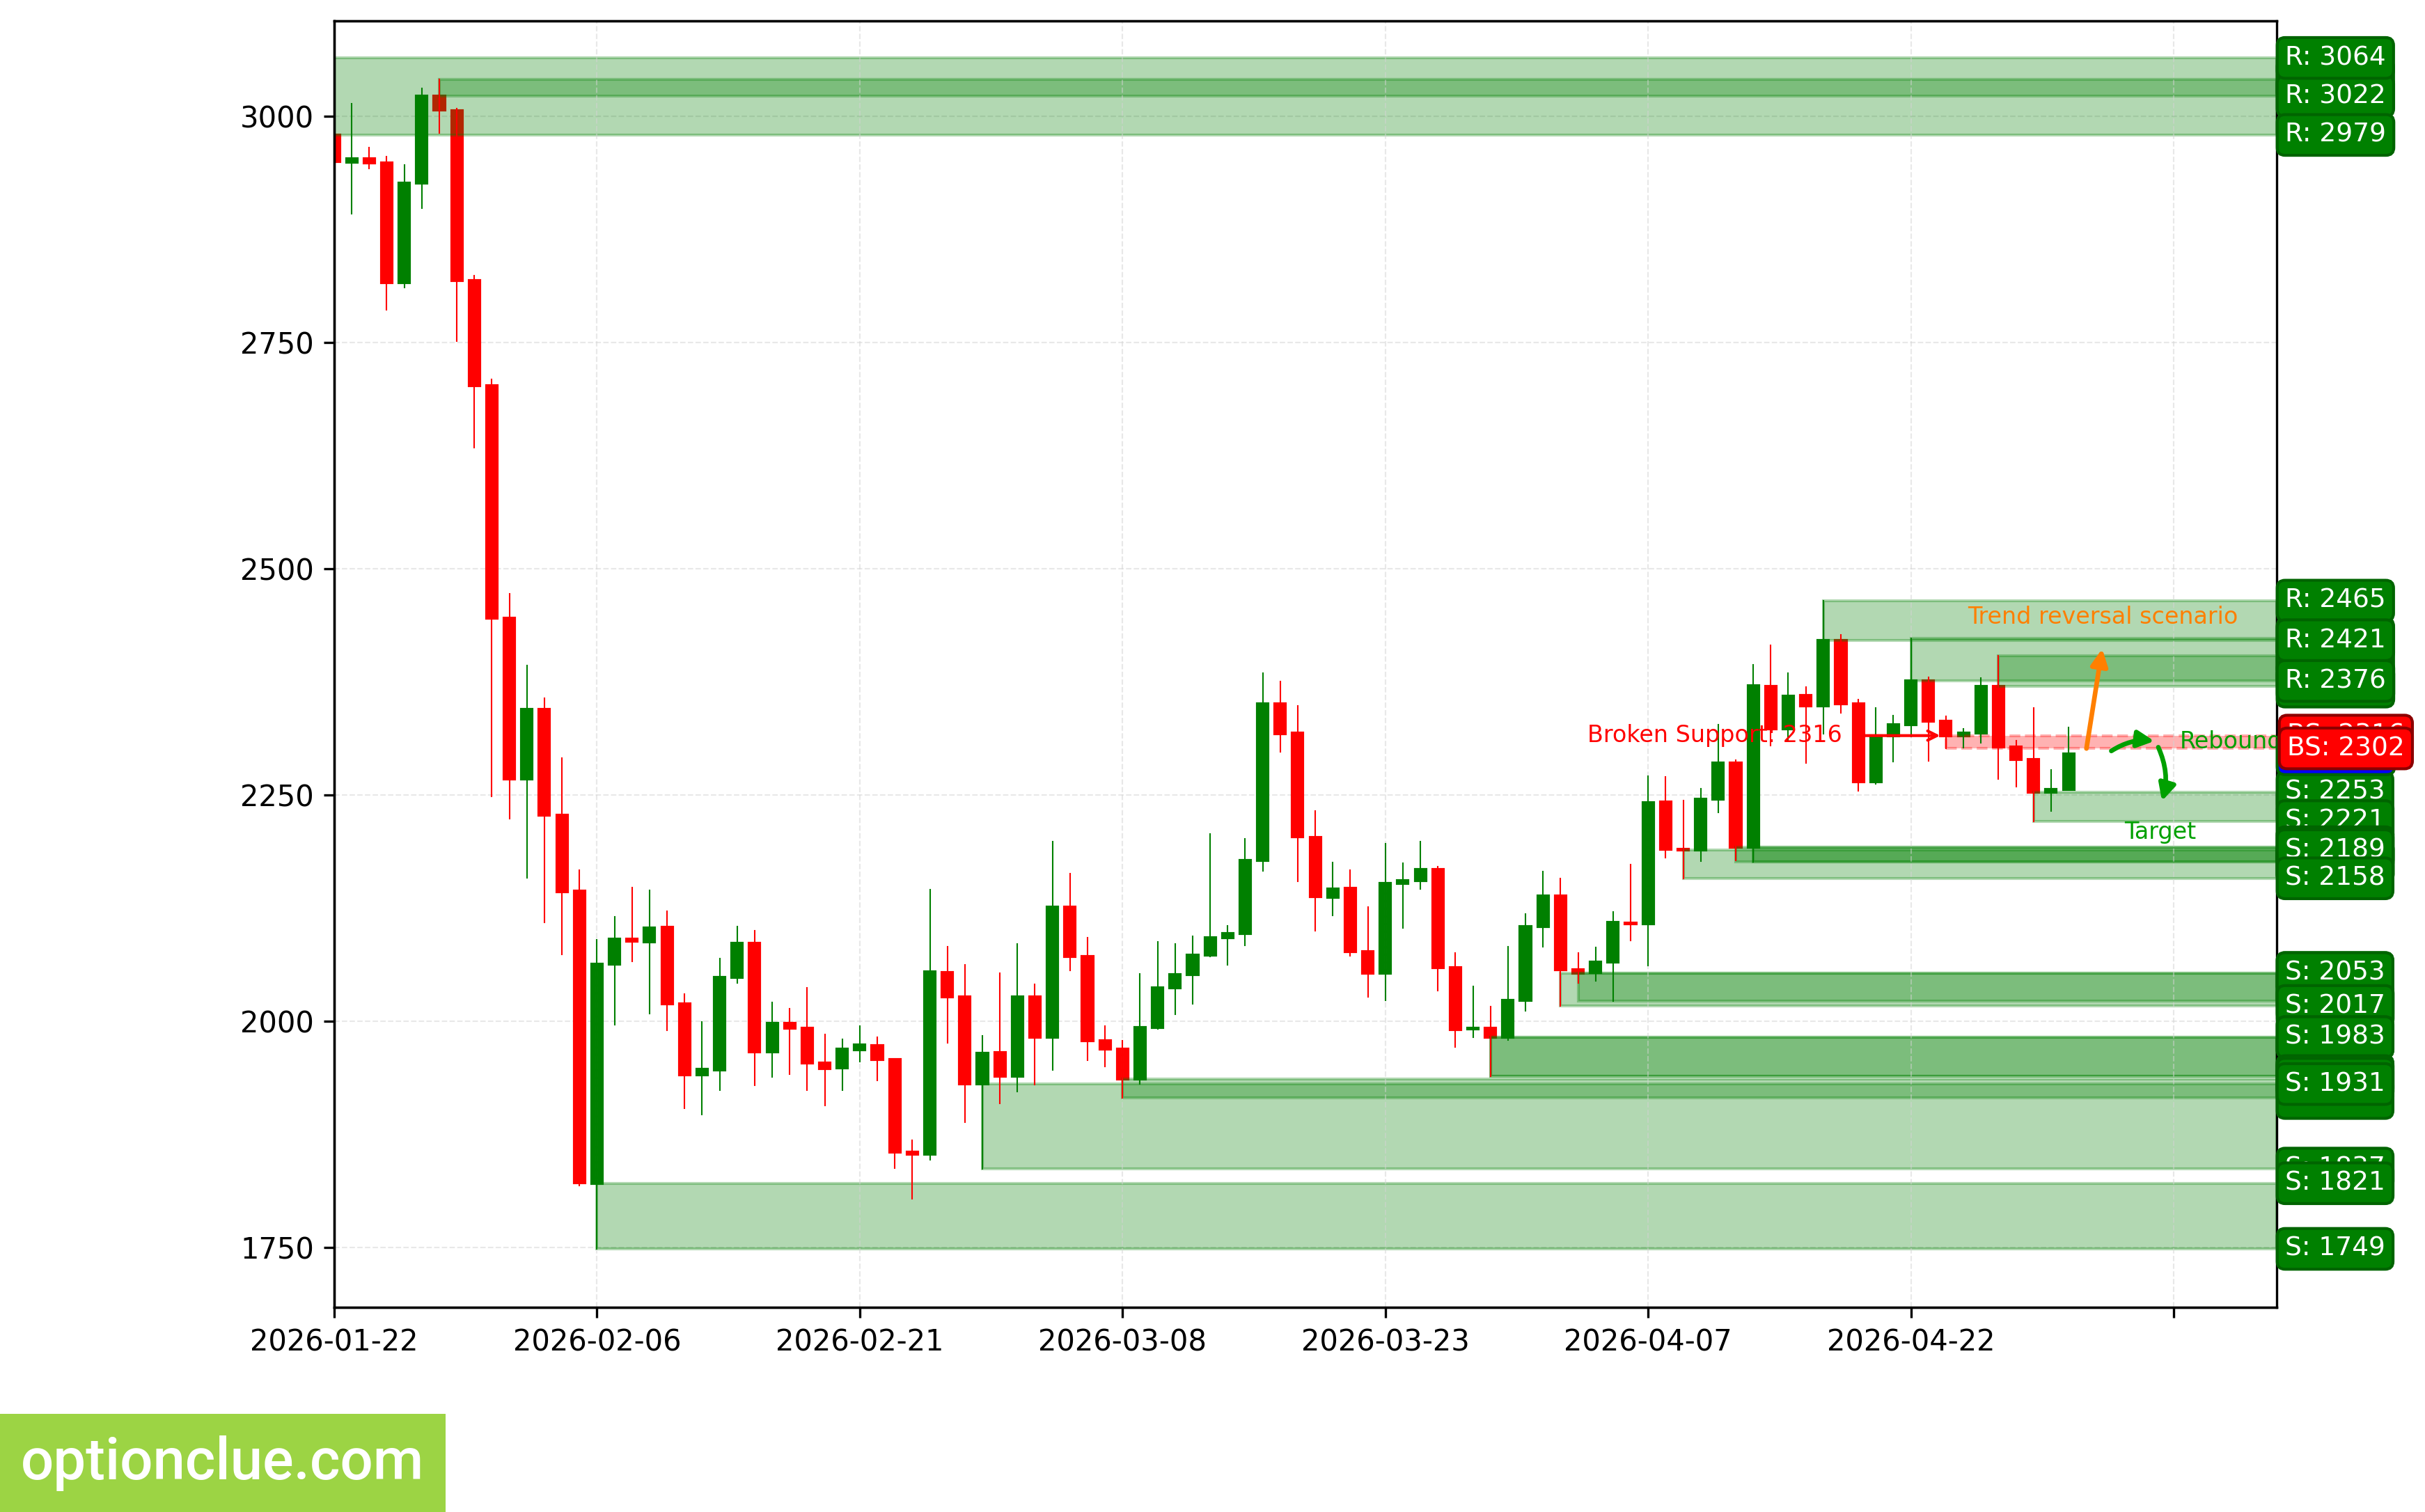
ETH. Technical analysis. D1.
Apple Inc (AAPL)
Bullish trend continues, impulse wave is developing after fresh breakout. Last broken level—resistance (275.05 — 275.77). Breakout happened on the last closed candlestick. Entry point for buying on rebound may appear after correction forms.
Intermediate target for upward movement is the resistance level with boundaries 280.15 — 280.15.
If new correction completes near the support level (267.04 — 267.55), potential profit/risk ratio may be approximately 1.8:1. If correction completes near the last broken level (275.05 — 275.77), potential profit/risk ratio may be small (around 0.3:1).
Long positions will remain relevant as long as the market stays above the nearest support level with boundaries 267.04 — 267.55. If the market successfully closes below this support, the trend will reverse to the opposite (bearish).
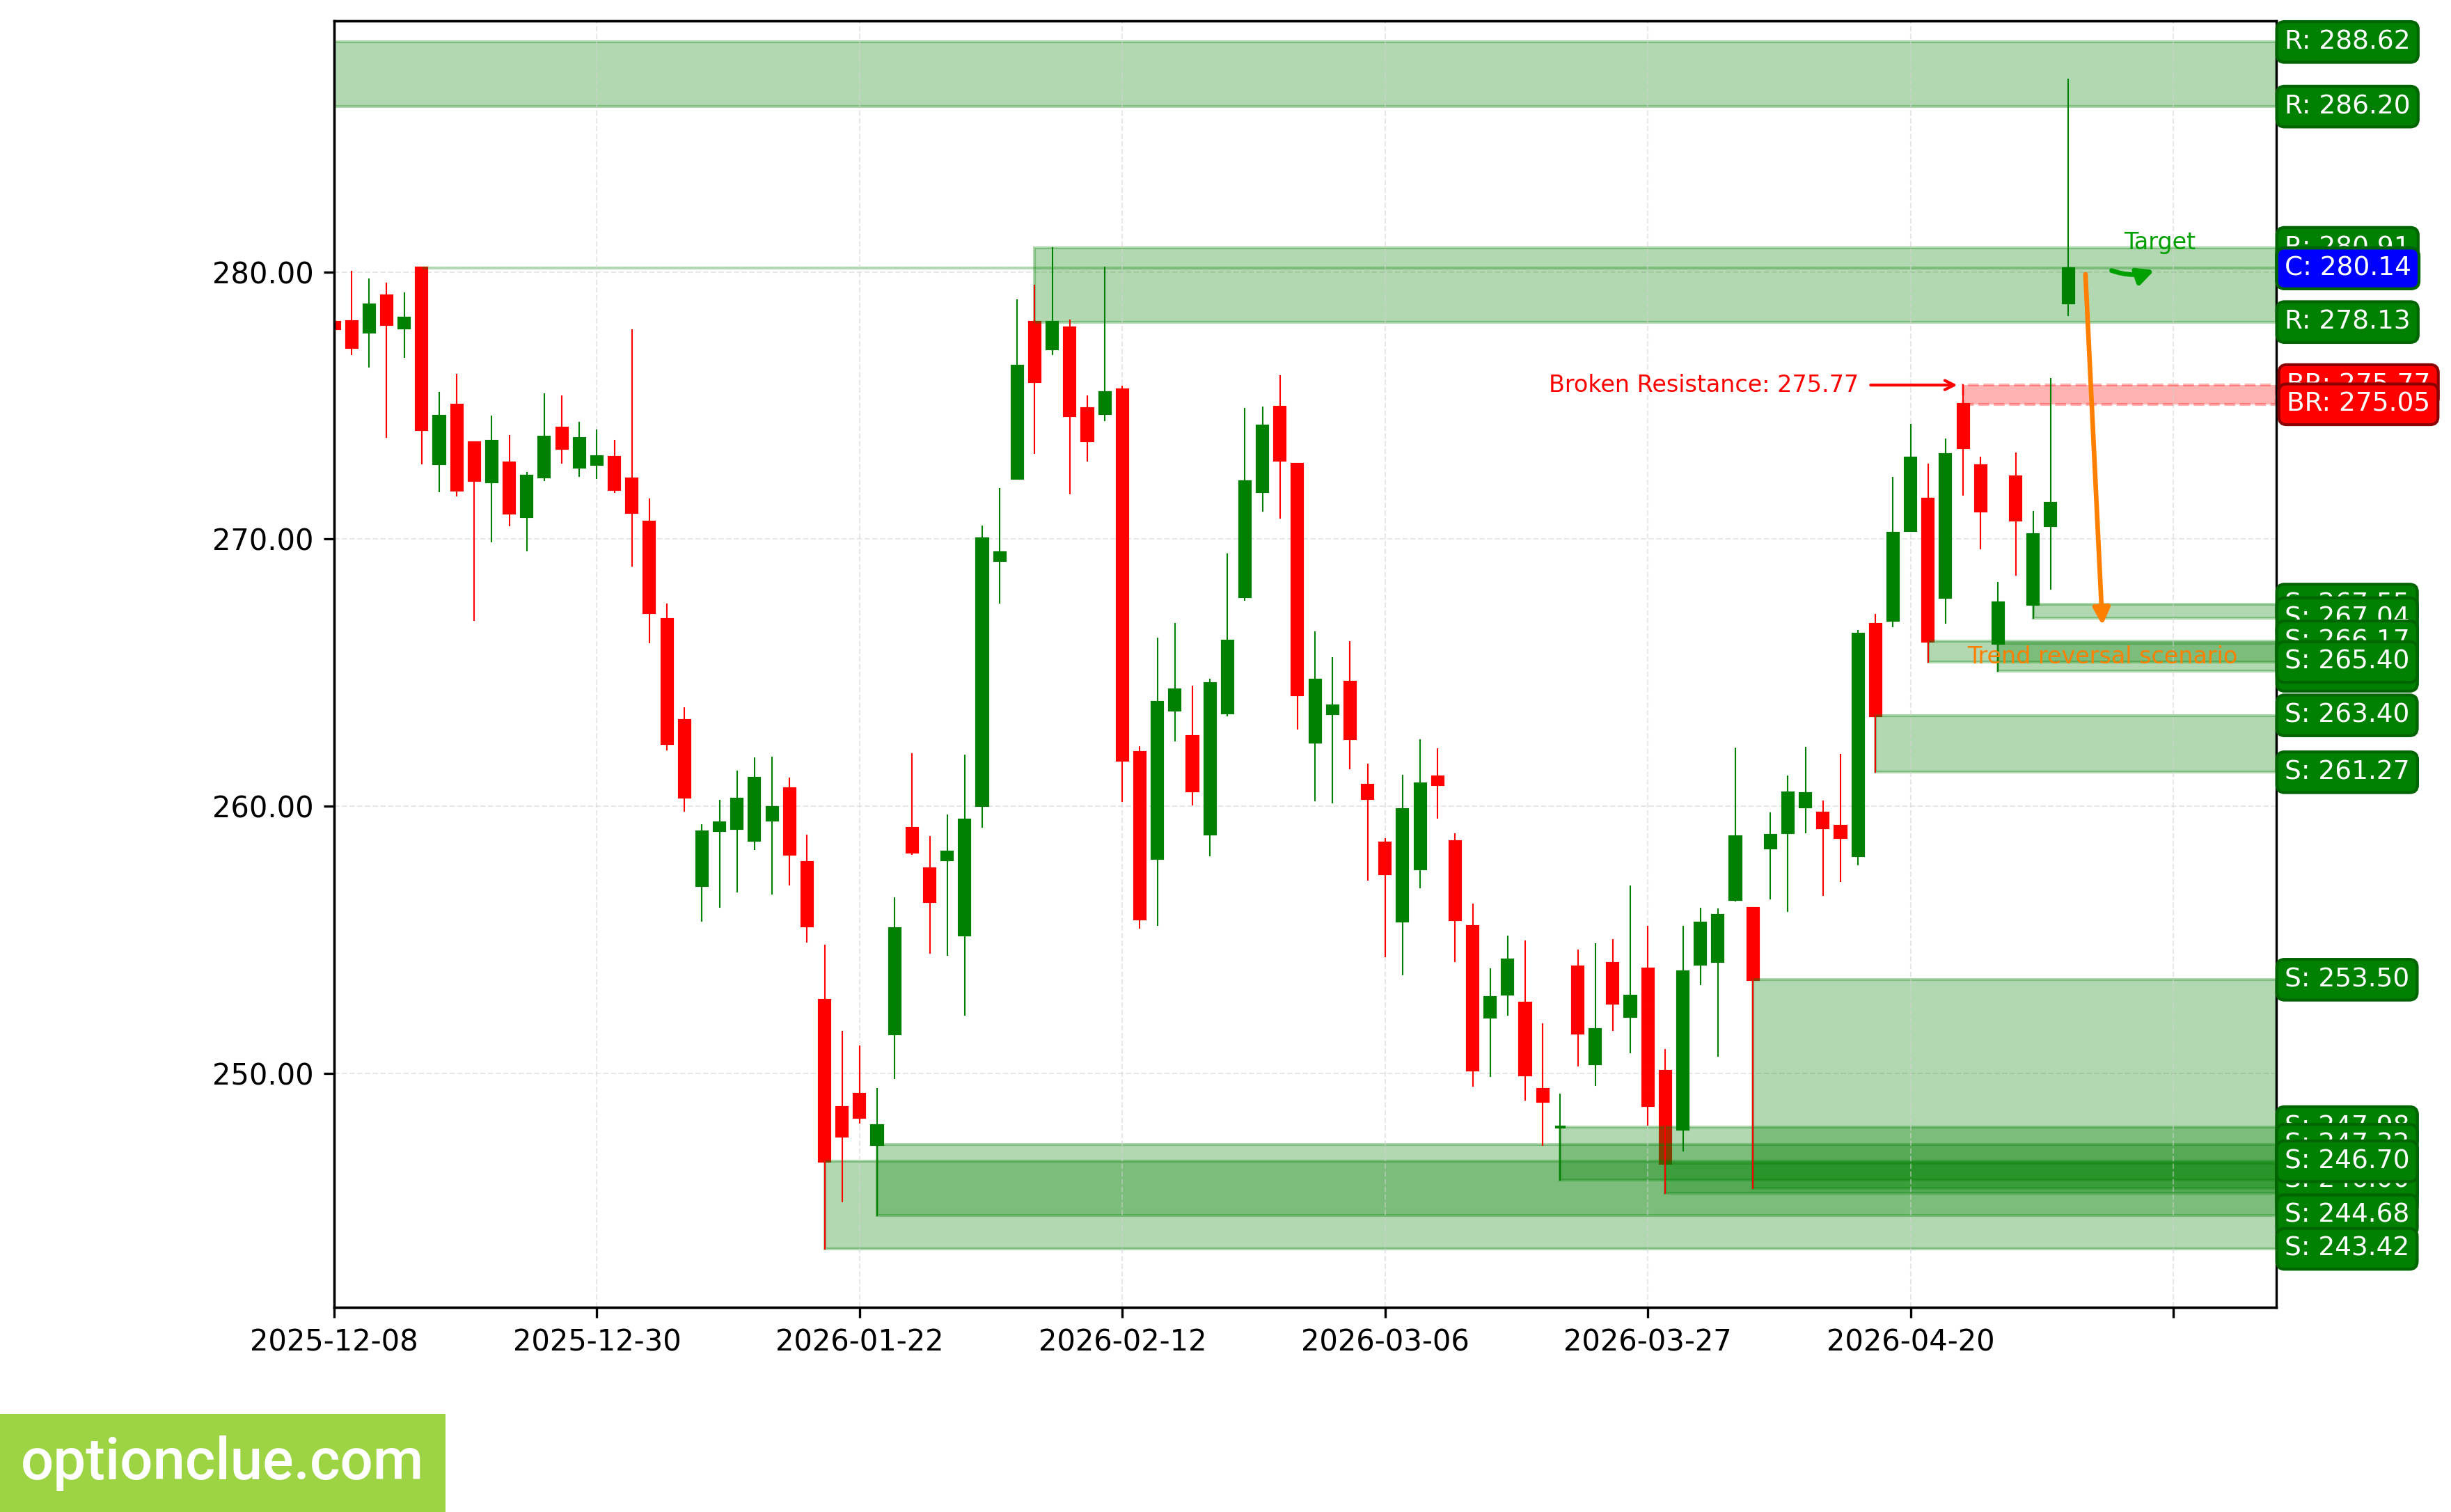
AAPL. Technical analysis. D1.
Tesla Inc (TSLA)
Bullish trend continues, price has rebounded from support zone, impulse wave is developing. Last broken level—resistance (363.79 — 364.50). Breakout happened 13 candlesticks ago.
Intermediate target for upward movement—resistance level with boundaries 402.58 — 409.28. In case of successful trend development, farther target will be at the resistance level with boundaries 430.30 — 436.35.
Potential profit/risk ratio from current prices when setting targets and fixing risks at daily timeframe levels may be small (around 0.3:1). When using farther target—also small (approximately 0.9:1). If next correction completes near the support level (364.02 — 372.09), potential profit/risk ratio may be around 1.8:1. When selecting farther target—around 3.2:1.
Long positions will remain relevant as long as the market stays above the nearest support level with boundaries 364.02 — 372.09. If the market successfully closes below this support, the trend will reverse to the opposite (bearish).
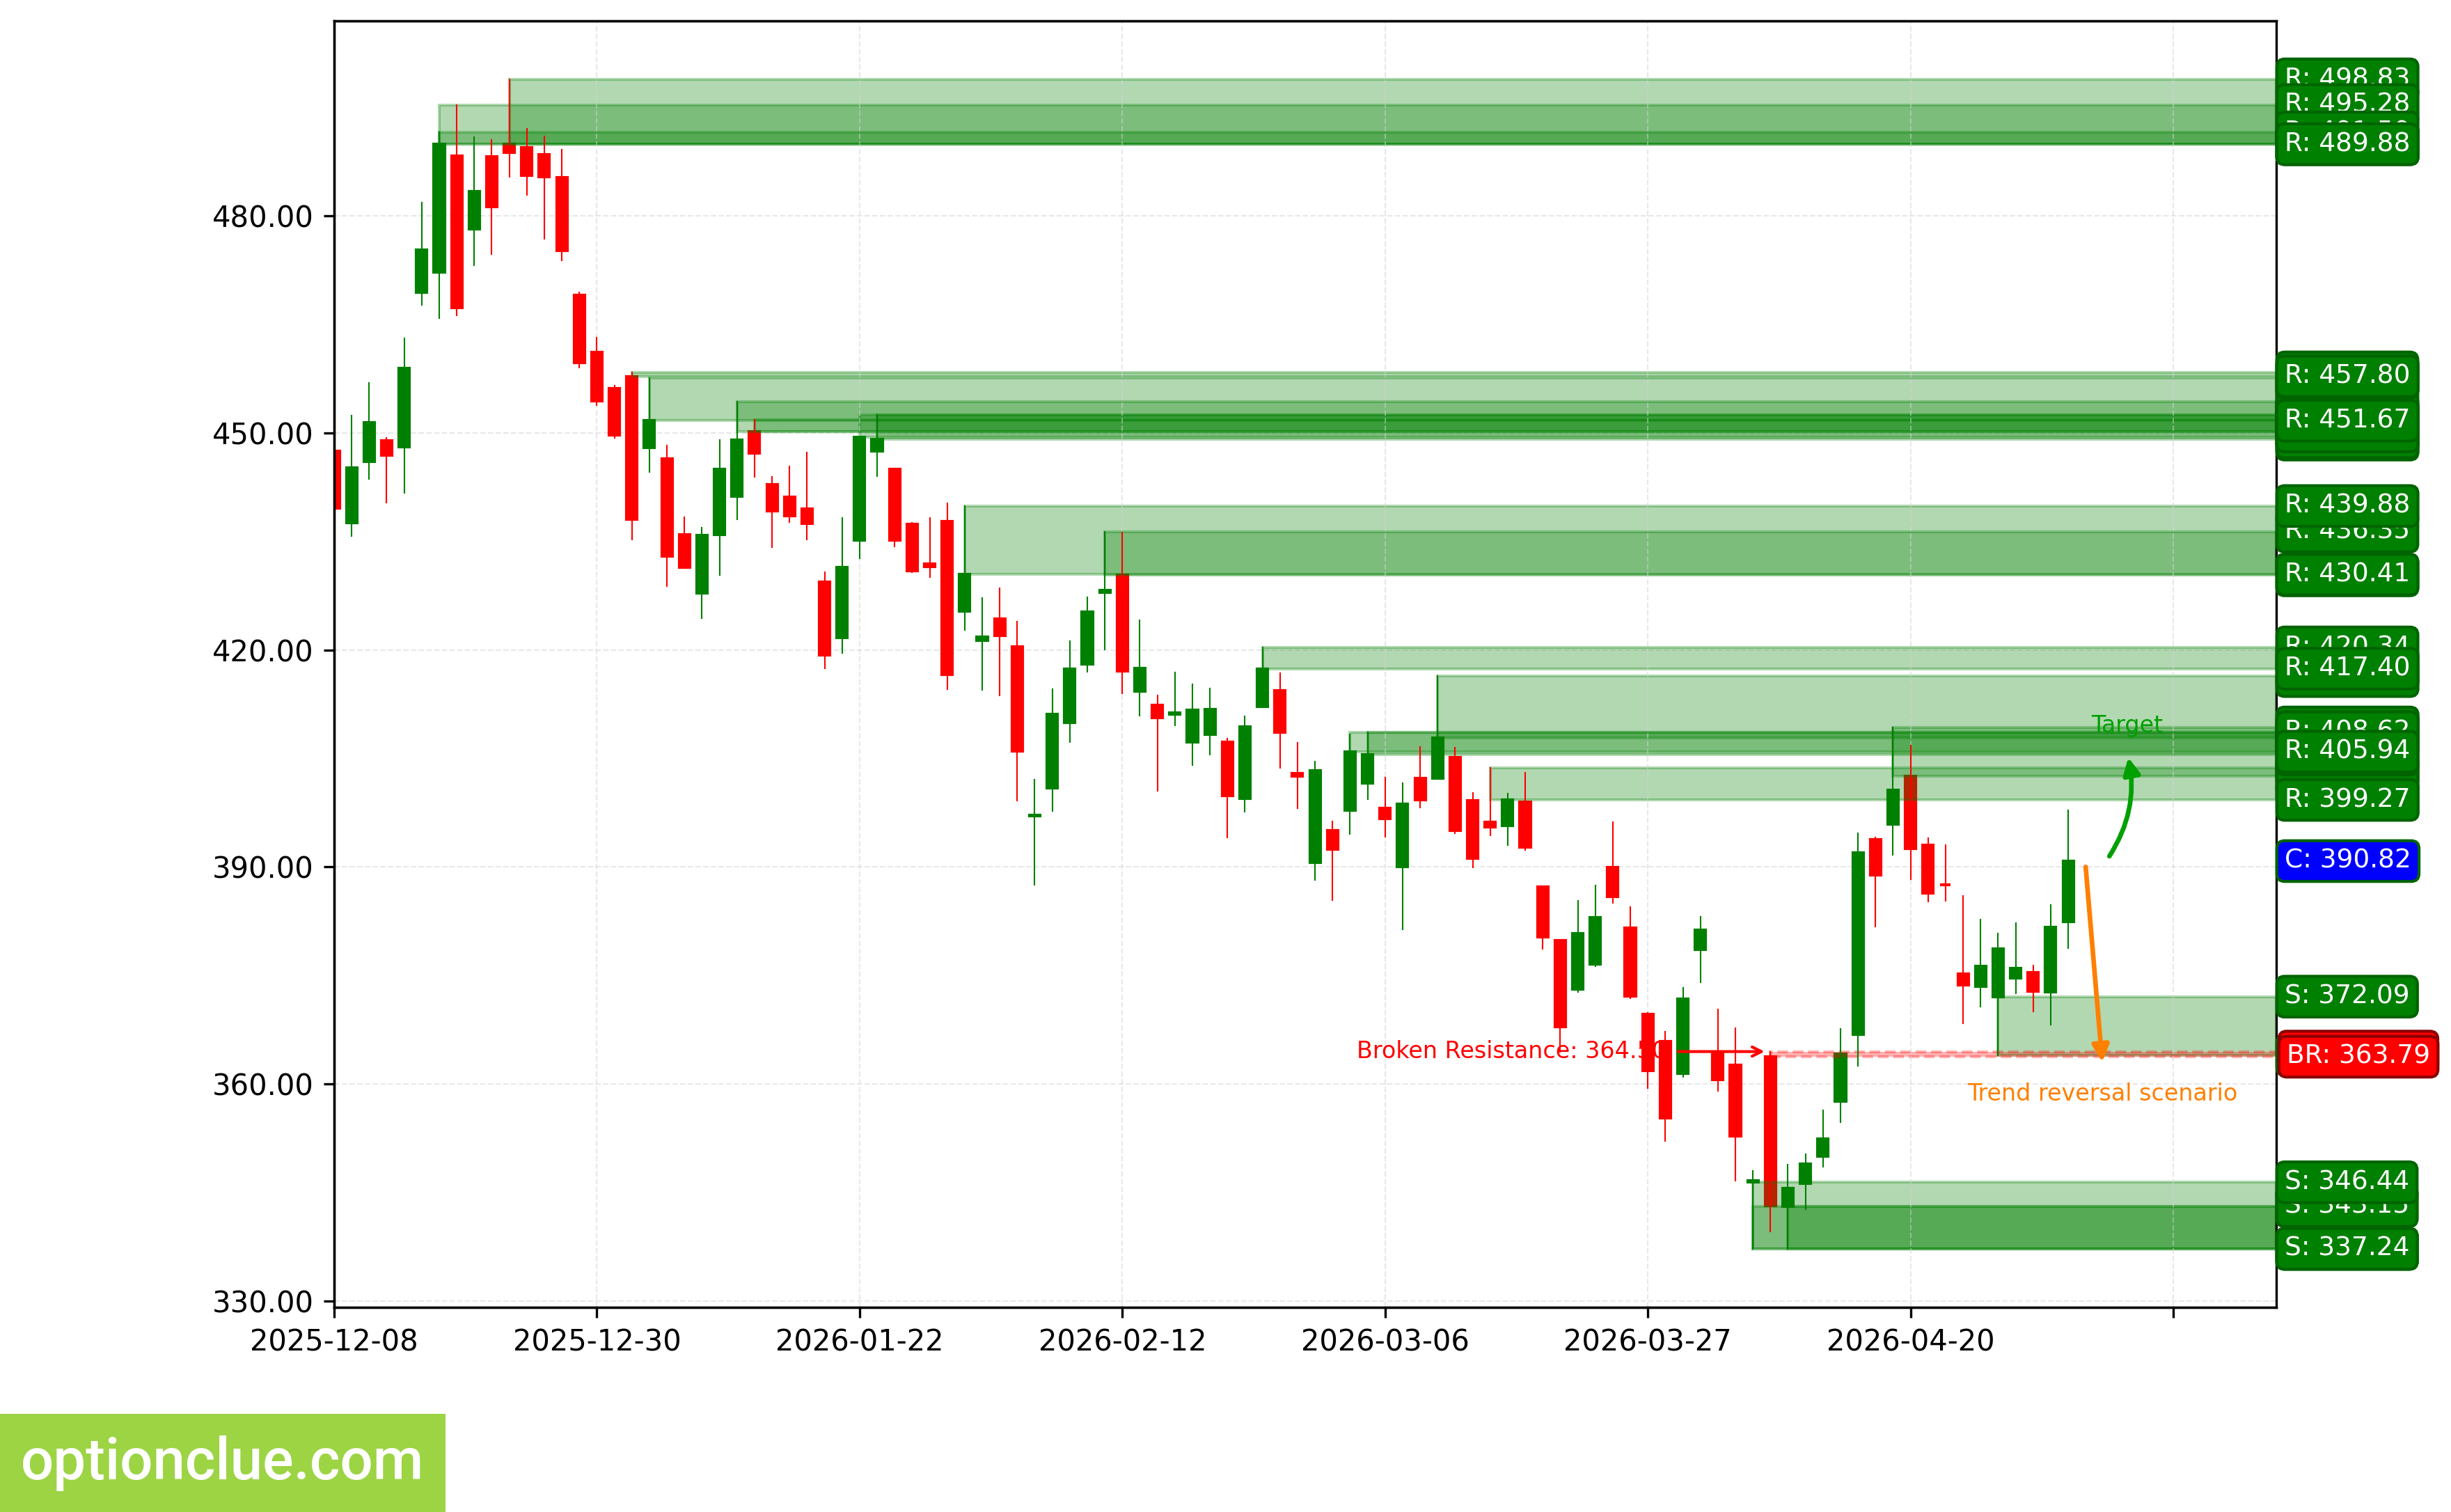
TSLA. Technical analysis. D1.
Summary
From a medium-term trading perspective, financial instruments with correction nearing completion on Daily and/or potentially most promising profit/risk ratios include: ETH, BTC. Soon may deserve attention depending on market correction depth: GBPUSD, USDCHF, USDJPY, USDCAD.
Other financial instruments on the trading list may also be interesting, but rebound signals on Daily are likely to appear no earlier than in a week.