
Weekly levels map: where the market might accelerate, and where it might lose momentum. Scenarios are based on the probable reaction at demand and supply zones.
Key topics
- Euro (EURUSD)
- British Pound (GBPUSD)
- Swiss Franc (USDCHF)
- Japanese Yen (USDJPY)
- Canadian Dollar (USDCAD)
- Australian Dollar (AUDUSD)
- New Zealand Dollar (NZDUSD)
- Bitcoin (BTC)
- Ether (ETH)
- Apple Inc (AAPL)
- NVIDIA Corp (NVDA)
- Tesla Inc (TSLA)
- Summary
Euro (EURUSD)
The bearish trend continues, the support level (1.1576 — 1.1598) was broken on the last closed candlestick, and an impulse wave is developing.
The intermediate target for the downward movement is the support level with boundaries at 1.1389 — 1.1404. If the trend develops successfully, a more distant target will be at the support level with boundaries at 1.1369 — 1.1391.
New short entry points on a rebound may appear after a correction forms. If the correction ends near the last broken level (1.1576 — 1.1598), the potential reward/risk ratio could be approximately 2:1.
Short positions will remain relevant as long as the market stays below the nearest resistance level with boundaries at 1.1650 — 1.1668.
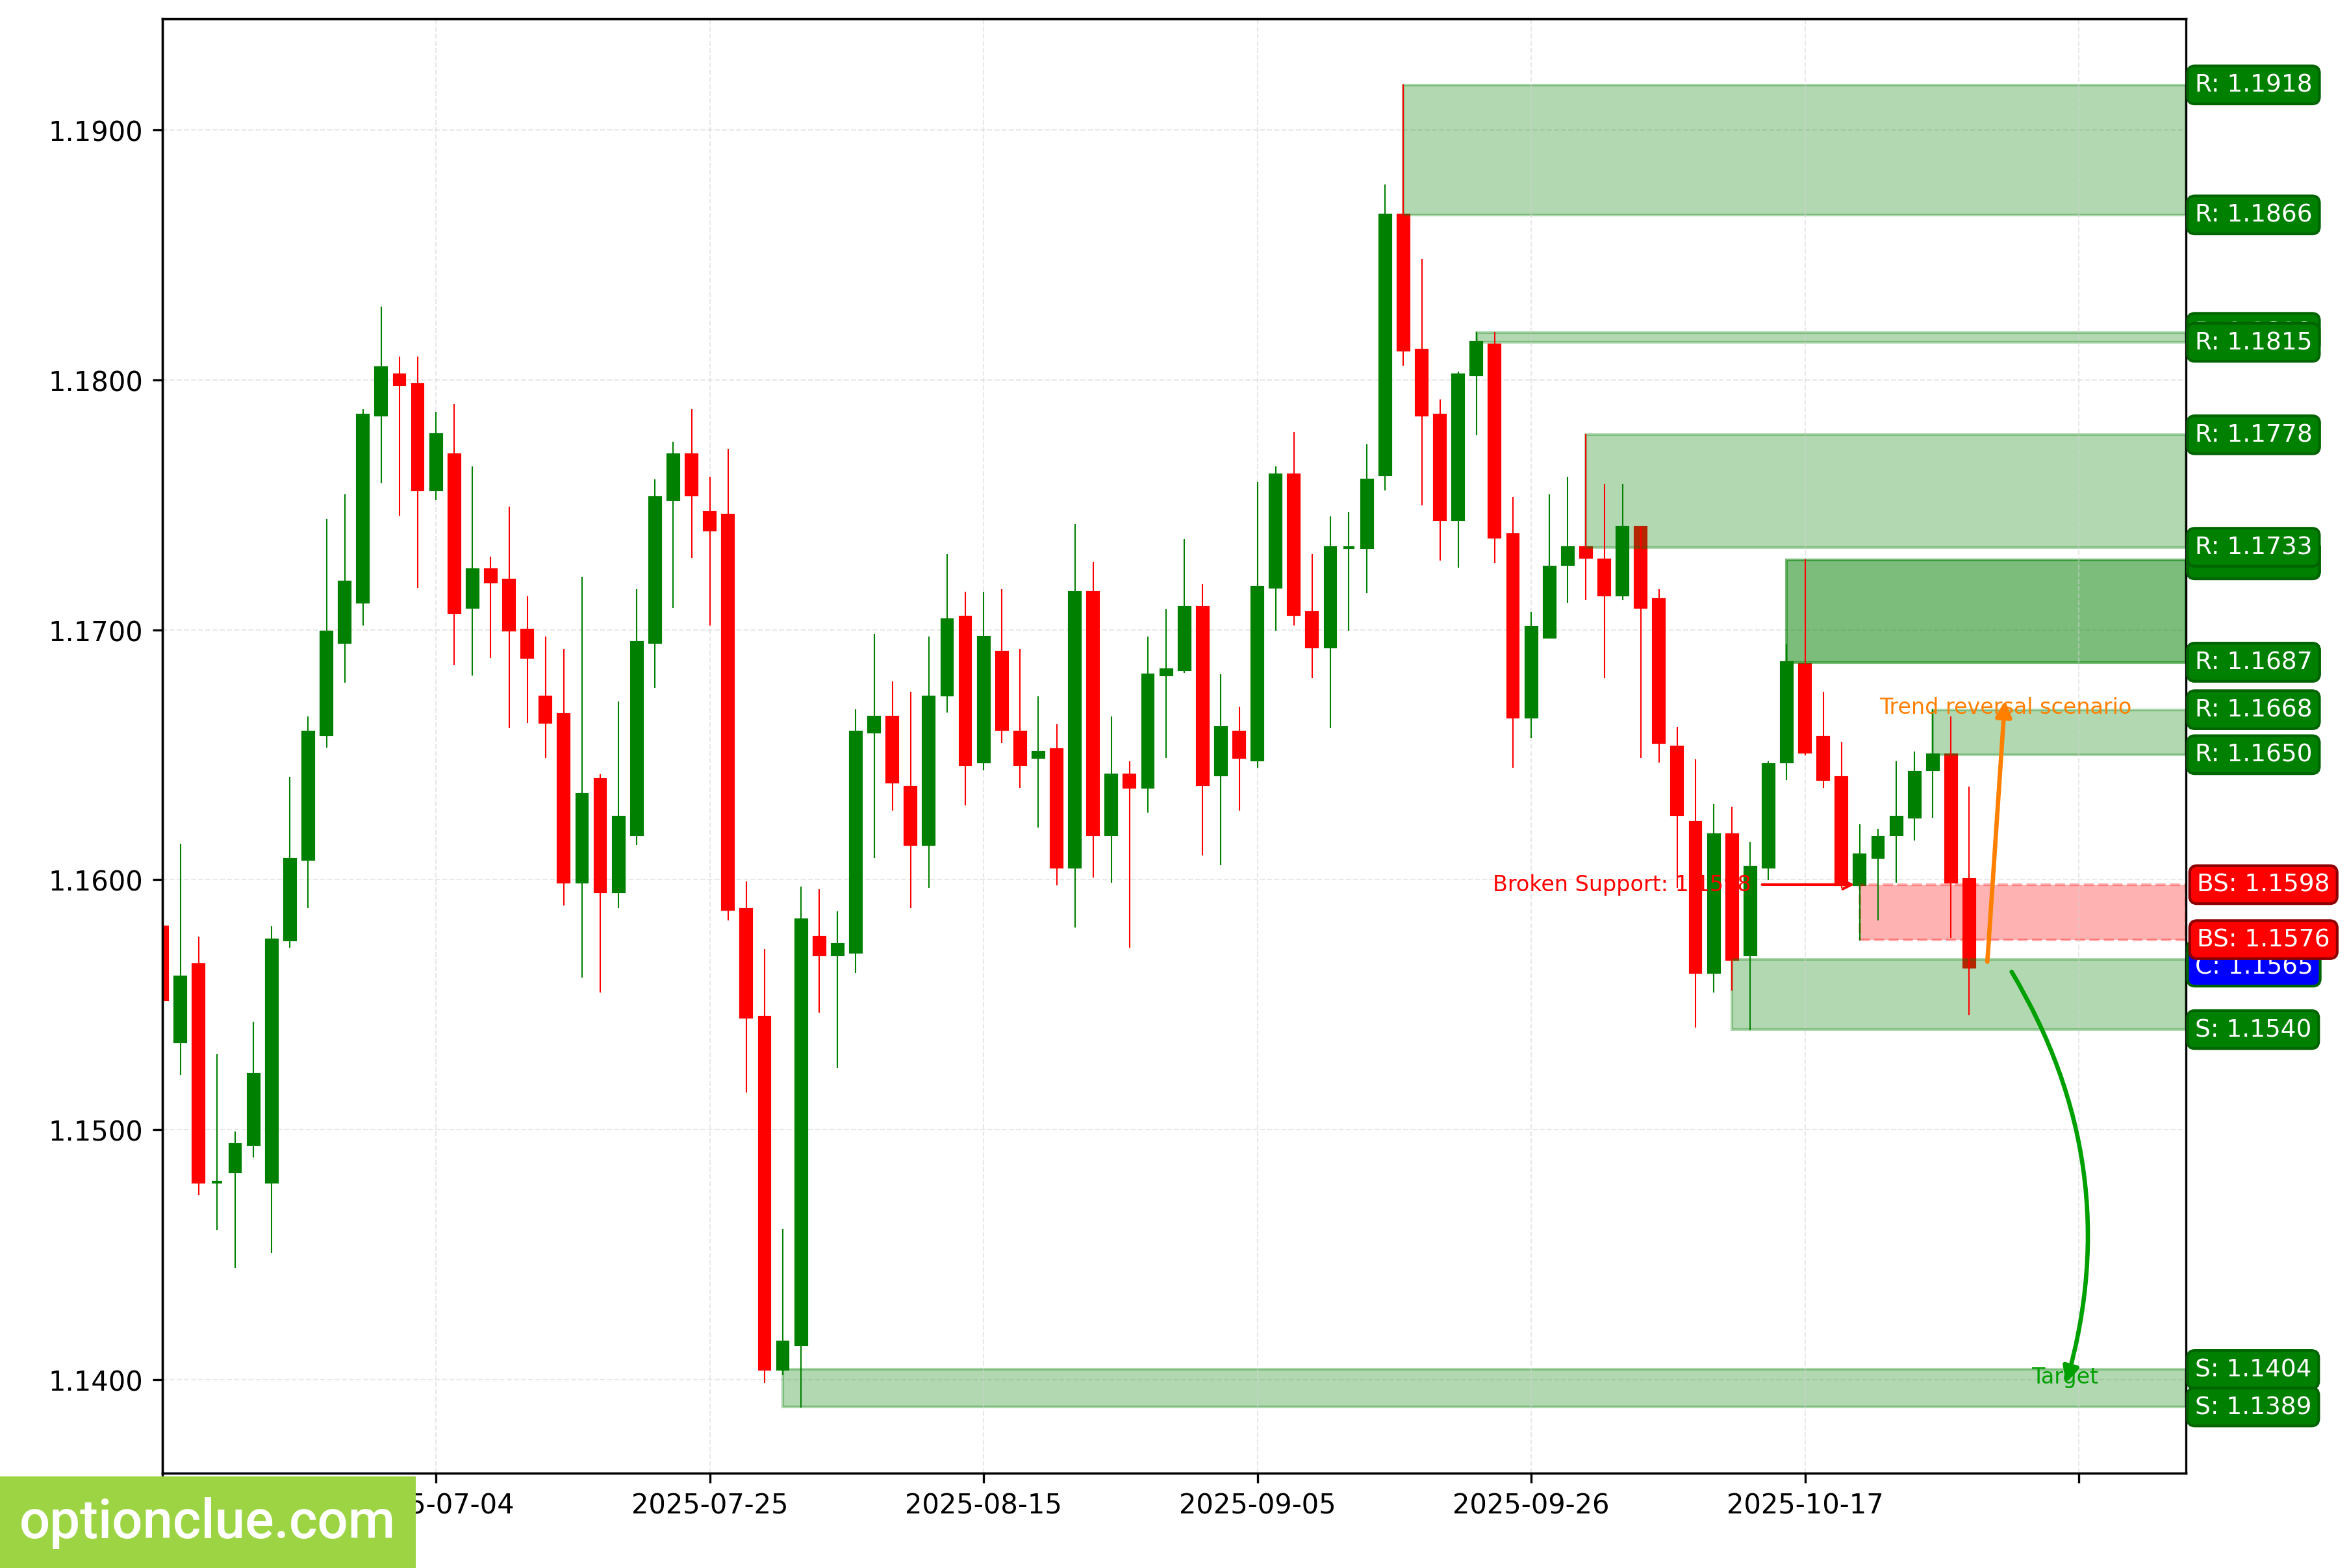
EURUSD. Technical analysis. D1.
British Pound (GBPUSD)
The trend has changed to bearish since the support level (1.3245 — 1.3316) was broken last week. An impulse wave is developing. A short entry point on a rebound on the daily timeframe may appear after a correction forms.
The intermediate target for the downward movement is the support level with boundaries at 1.2708 — 1.2720. If the trend develops successfully, a more distant target will be at the support level with boundaries at 1.2559 — 1.2574.
If the correction ends near the last broken level (1.3245 — 1.3316), the potential reward/risk ratio could be 2:1.
Short positions will remain relevant as long as the market stays below the nearest resistance level with boundaries at 1.3436 — 1.3471.
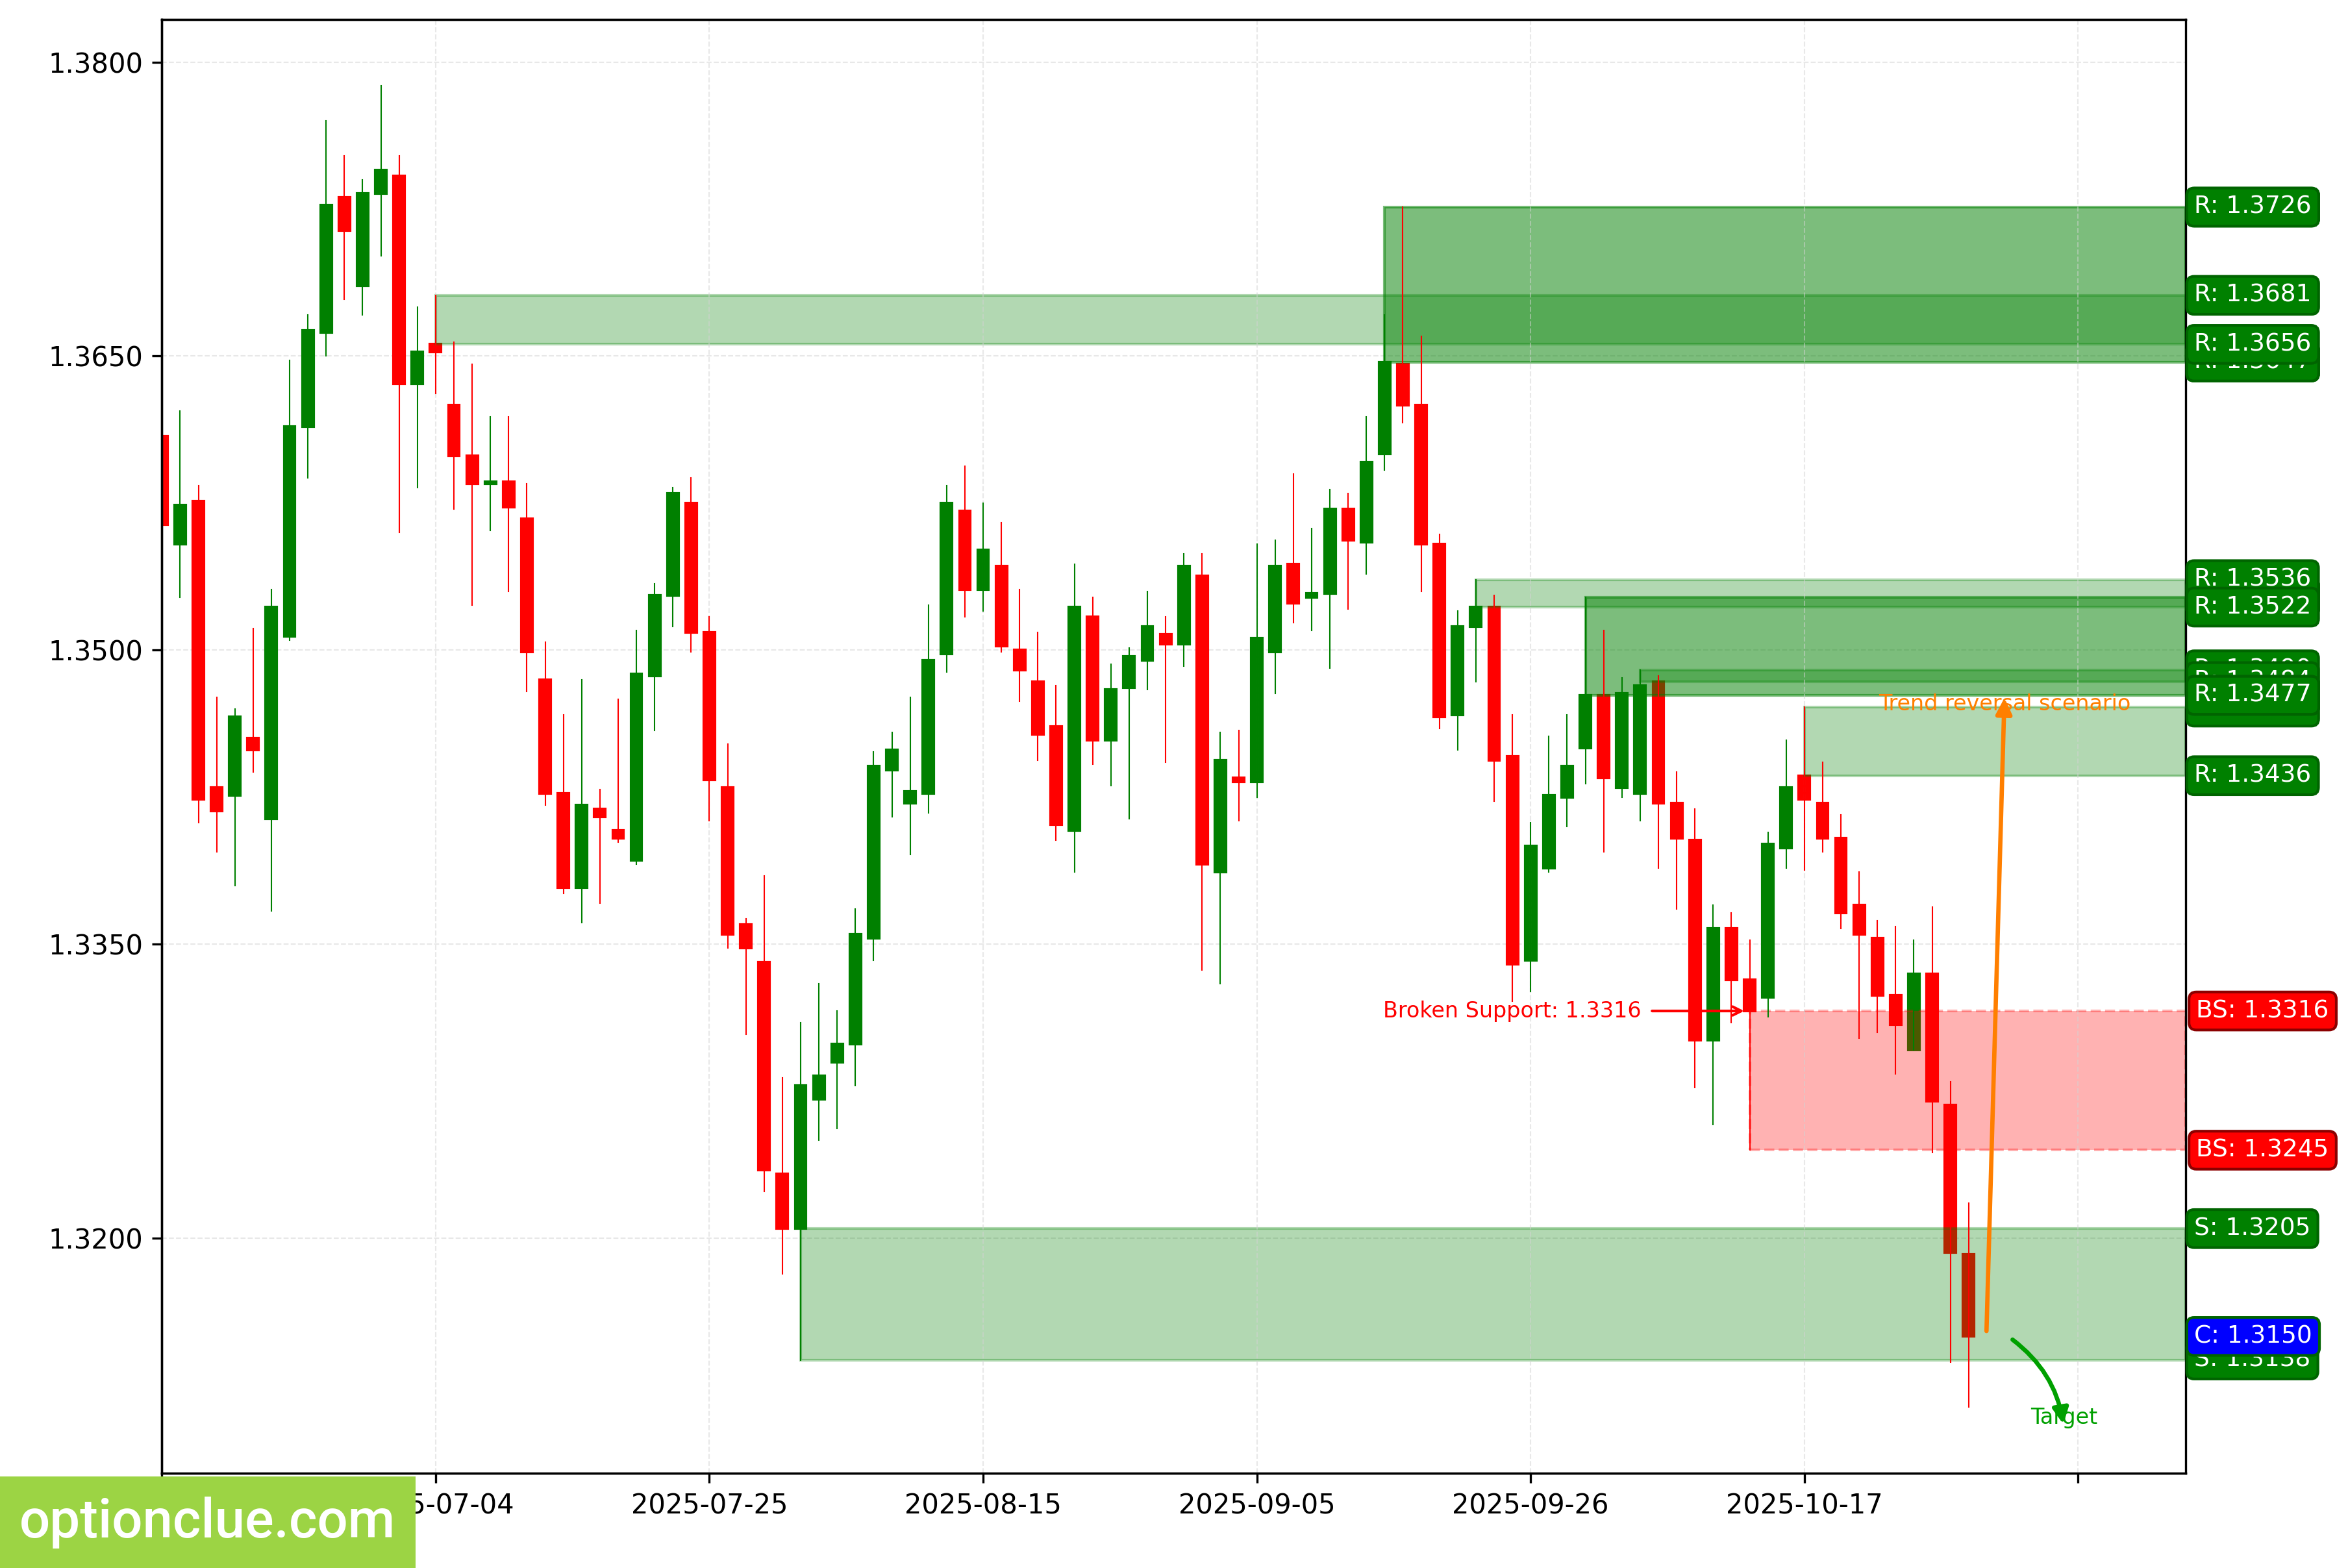
GBPUSD. Technical analysis. D1.
Swiss Franc (USDCHF)
The trend has changed to bullish since the resistance level (0.7961 — 0.7986) was broken last week.
An impulse wave is developing. New long entry points on a rebound on the daily timeframe may appear after a correction forms.
The intermediate target for the upward movement is the resistance level with boundaries at 0.8053 — 0.8072. If the market successfully consolidates above this resistance, it will open the way for a price move to target #2 — the resistance level with boundaries at 0.8058 — 0.8076.
If the correction ends near the last broken level (0.7961 — 0.7986), the potential reward/risk ratio could be small (approximately 1:1). If a correction to the support level (0.7923 — 0.7931) occurs, the potential reward/risk ratio will be significantly higher.
Long positions will remain relevant as long as the market stays above the nearest daily timeframe support level with boundaries at 0.7923 — 0.7931.
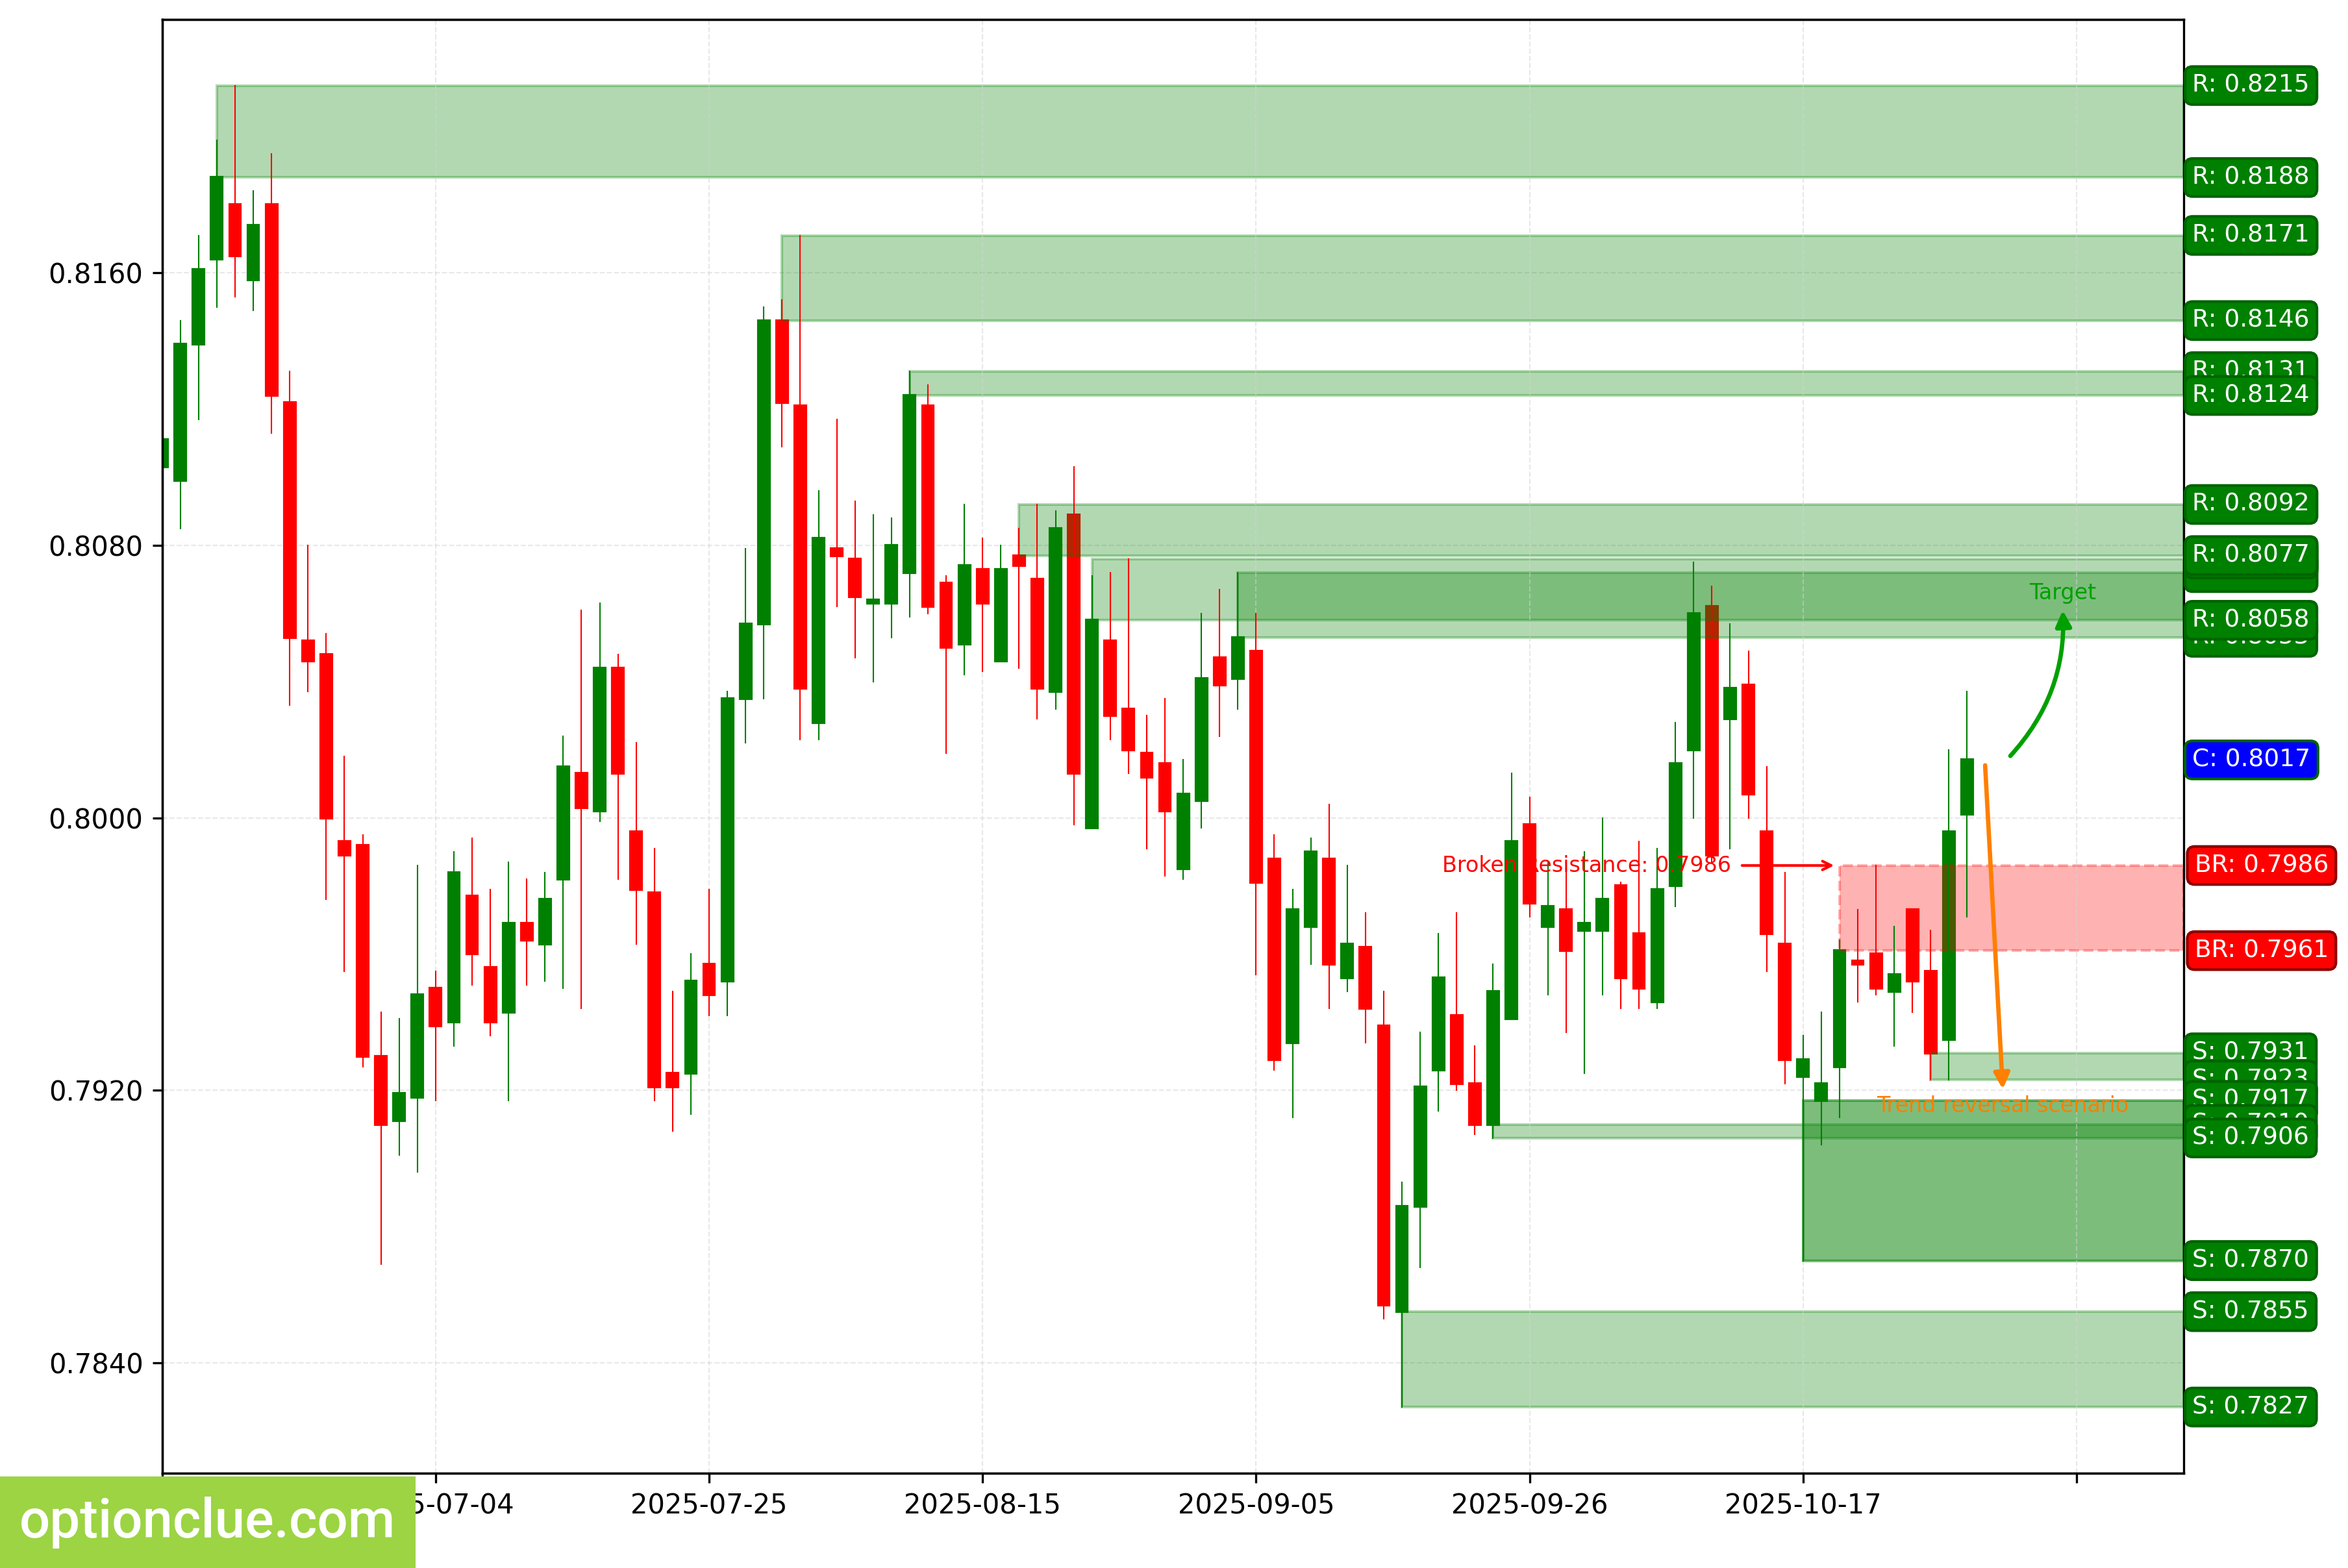
USDCHF. Technical analysis. D1.
Japanese Yen (USDJPY)
The bullish trend continues, the last broken level was the resistance at (153.02 — 153.25). On the second-to-last closed candlestick, the correction ended and a new impulse wave began to develop. The intermediate target for the upward movement is the resistance level with boundaries at 154.41 — 154.80.
If the market successfully consolidates above this resistance, it will open the way for a price move to target #2 — the resistance level with boundaries at 155.18 — 155.89.
If the correction ends near the last broken level (153.02 — 153.25), the potential reward/risk ratio could be small (less than 1:1). If a correction to the support level (151.53 — 152.10) occurs, the potential reward/risk ratio could be 5:1 or higher.
Long positions will remain relevant as long as the market stays above the nearest daily timeframe support level with boundaries at 151.53 — 152.10.
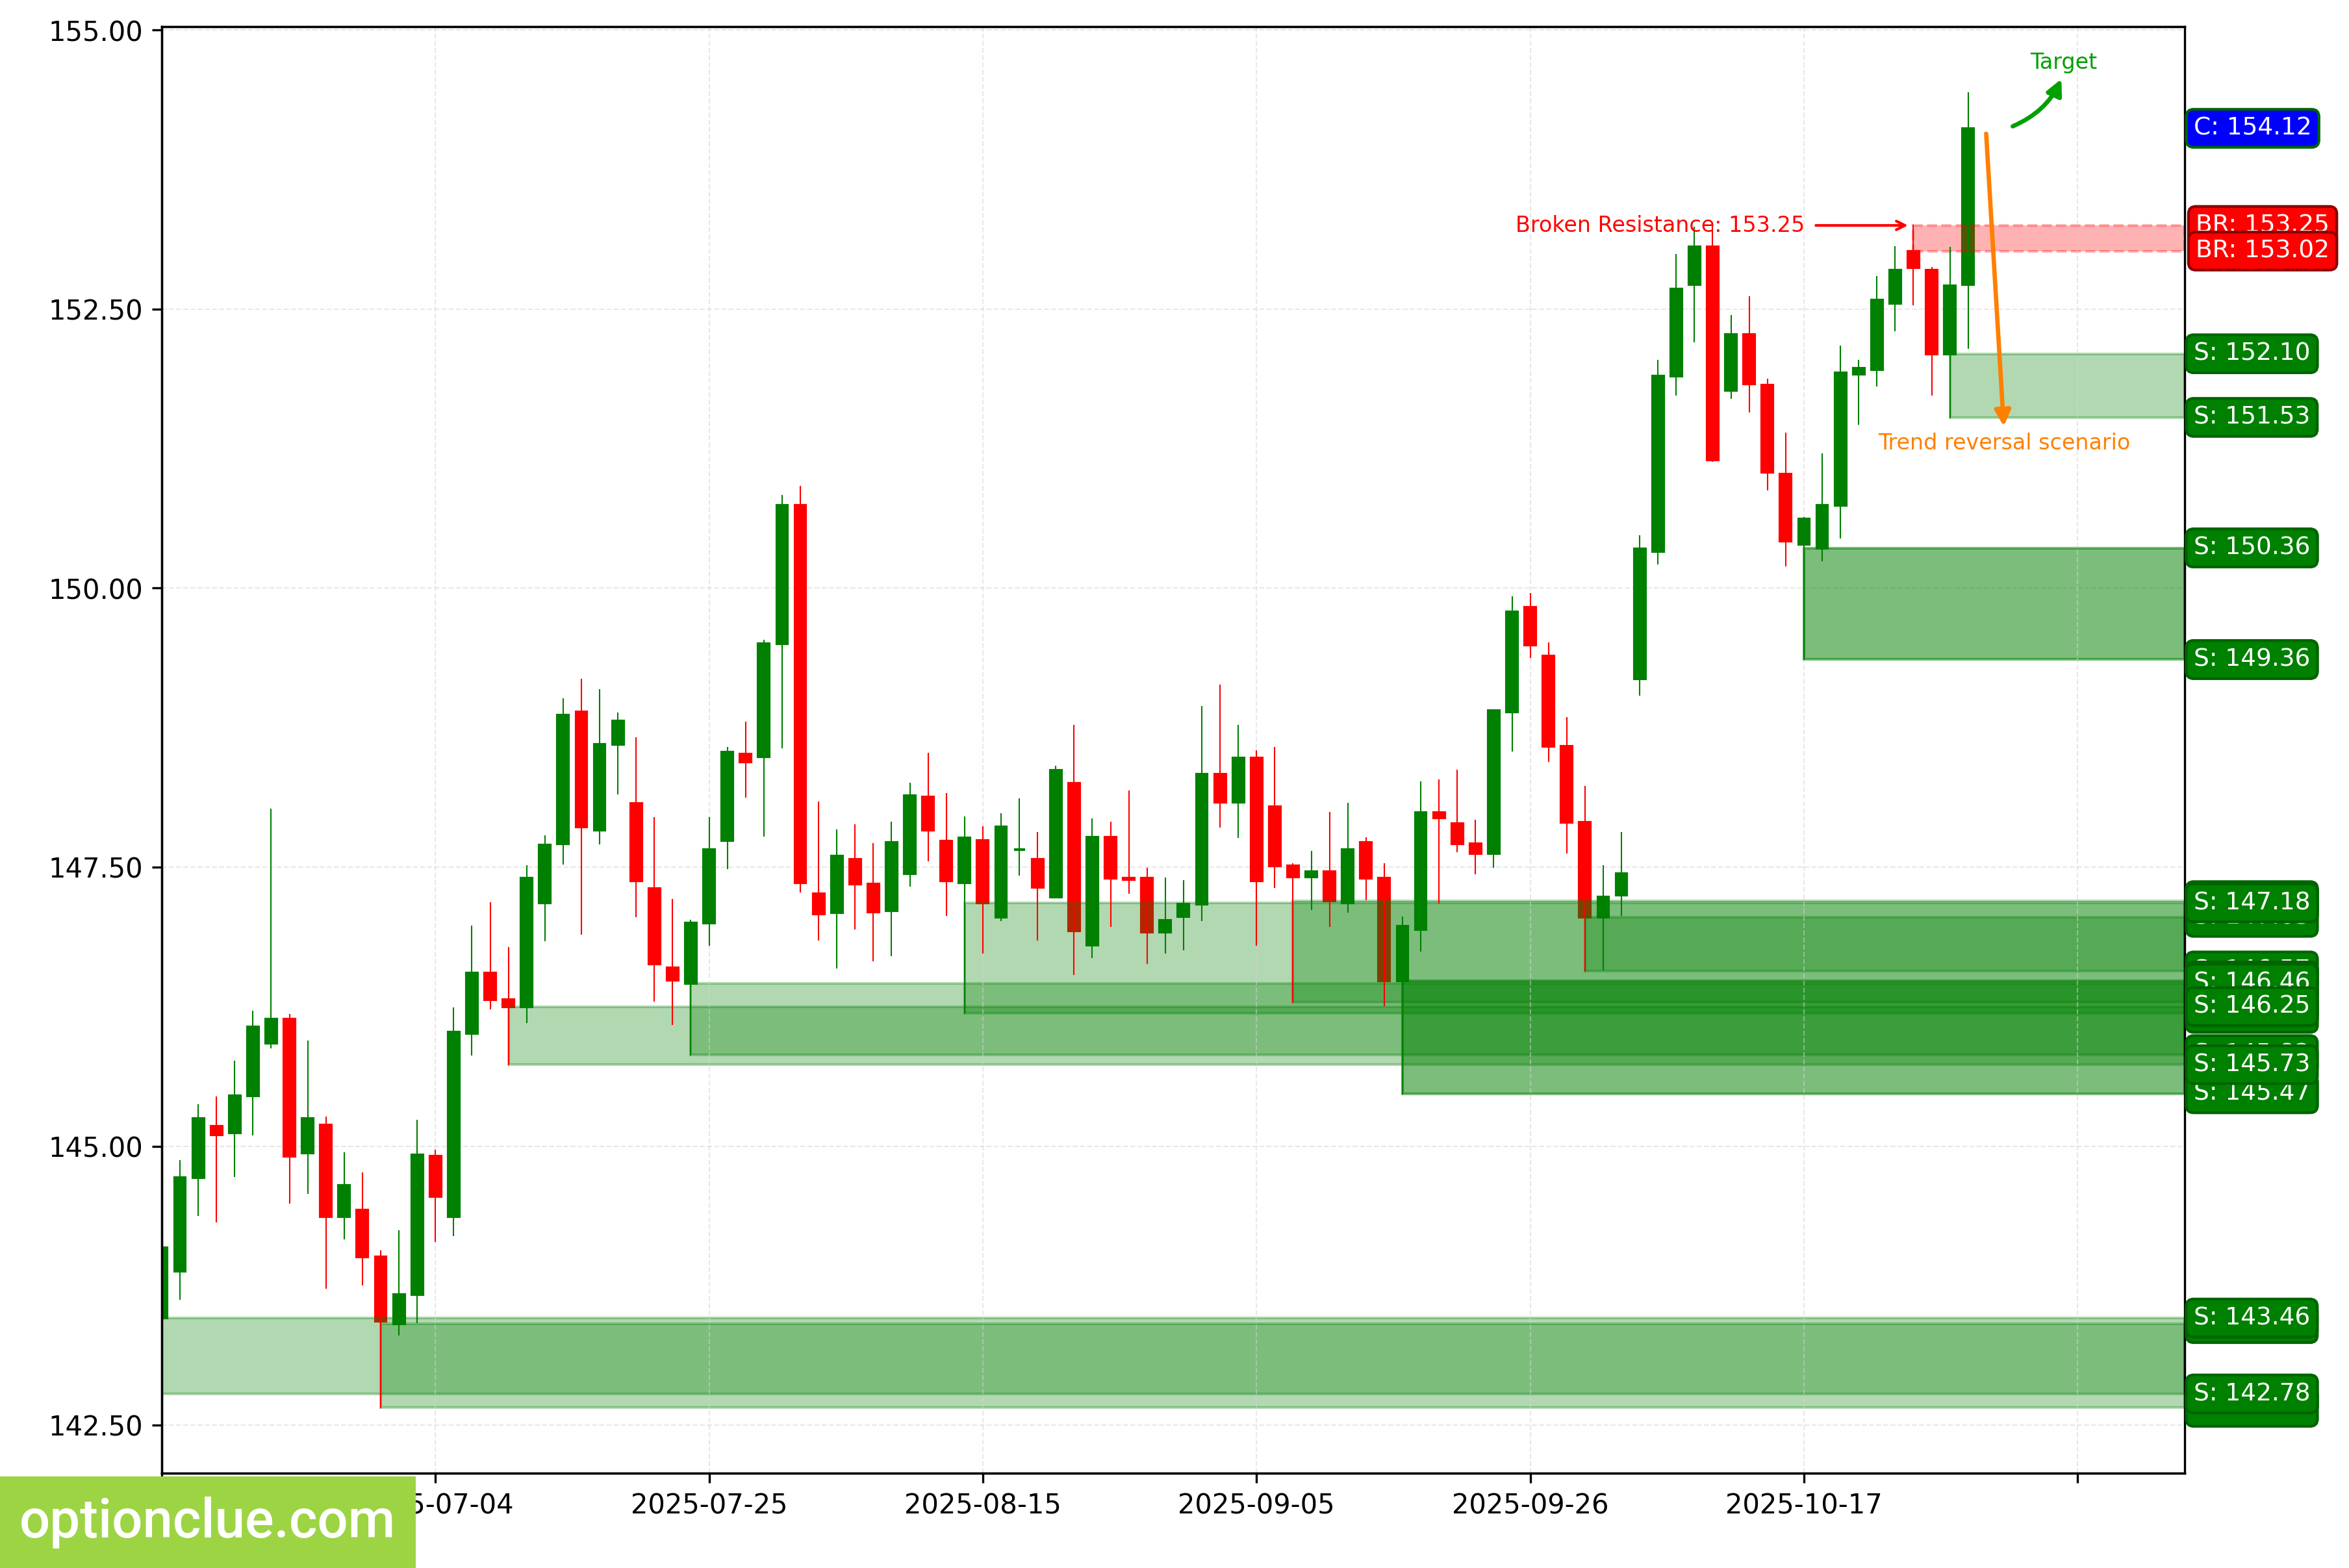
USDJPY. Technical analysis. D1.
Canadian Dollar (USDCAD)
The bullish trend continues; on the last closed candlestick, the correction likely ended, forming a long entry point on a rebound. An impulse wave is now developing.
The intermediate target for the upward movement is the resistance level with boundaries at 1.4036 — 1.4065. If the market successfully consolidates above this resistance, it will open the way for a price move to target #2 — the resistance level with boundaries at 1.4385 — 1.4415.
The potential reward/risk ratio from current prices, when setting targets and managing risk based on daily timeframe levels, could be small (0.7:1).
Long positions will remain relevant as long as the market stays above the nearest daily timeframe support level with boundaries at 1.3930 — 1.3941.
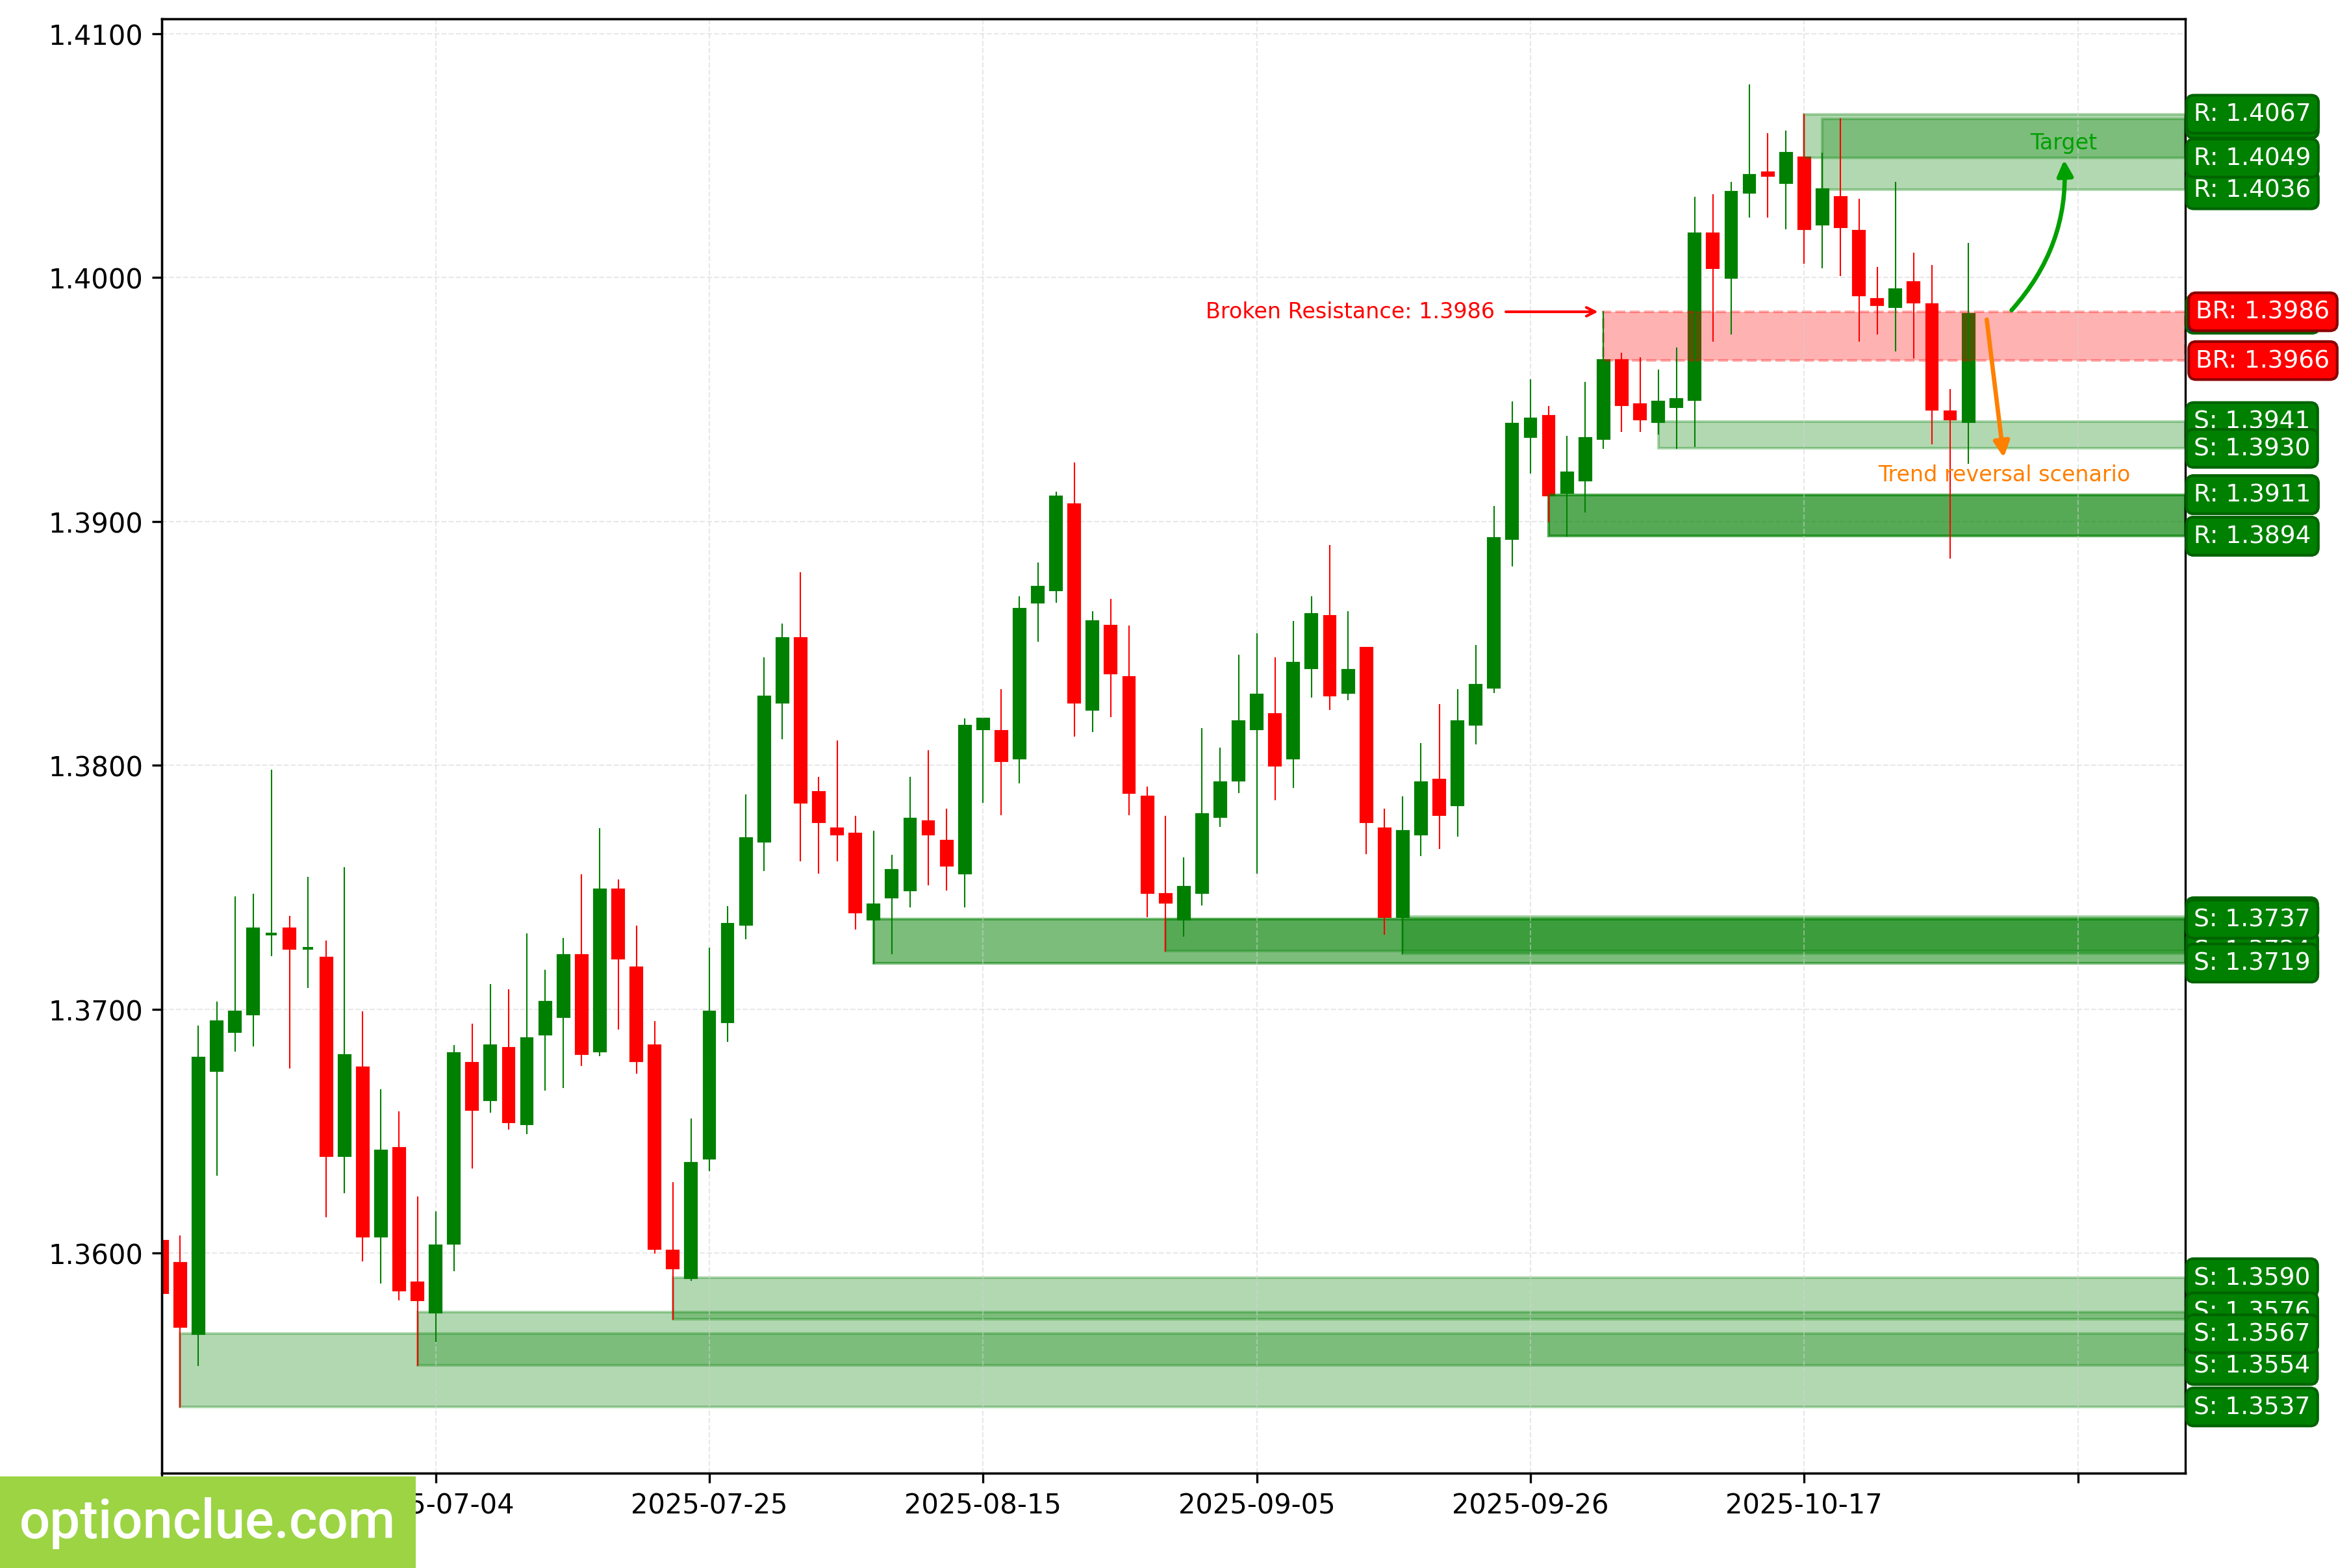
USDCAD. Technical analysis. D1.
Australian Dollar (AUDUSD)
The trend has changed to bullish since the resistance level (0.6512 — 0.6525) was broken last week. A corrective wave is developing. A long entry point on a rebound may form after the correction on the daily timeframe is complete.
If the uptrend resumes, the first target will be the resistance level with boundaries at 0.6584 — 0.6617. If the trend develops successfully, a more distant target will be at the resistance level with boundaries at 0.6598 — 0.6628.
If the correction ends near the last broken level (0.6512 — 0.6525), the potential reward/risk ratio could be small (slightly more than 1:1). If a correction to the support level (0.6471 — 0.6485) occurs, the potential reward/risk ratio could be around 4:1.
Long positions will remain relevant as long as the market stays above the nearest daily timeframe support level with boundaries at 0.6471 — 0.6485.
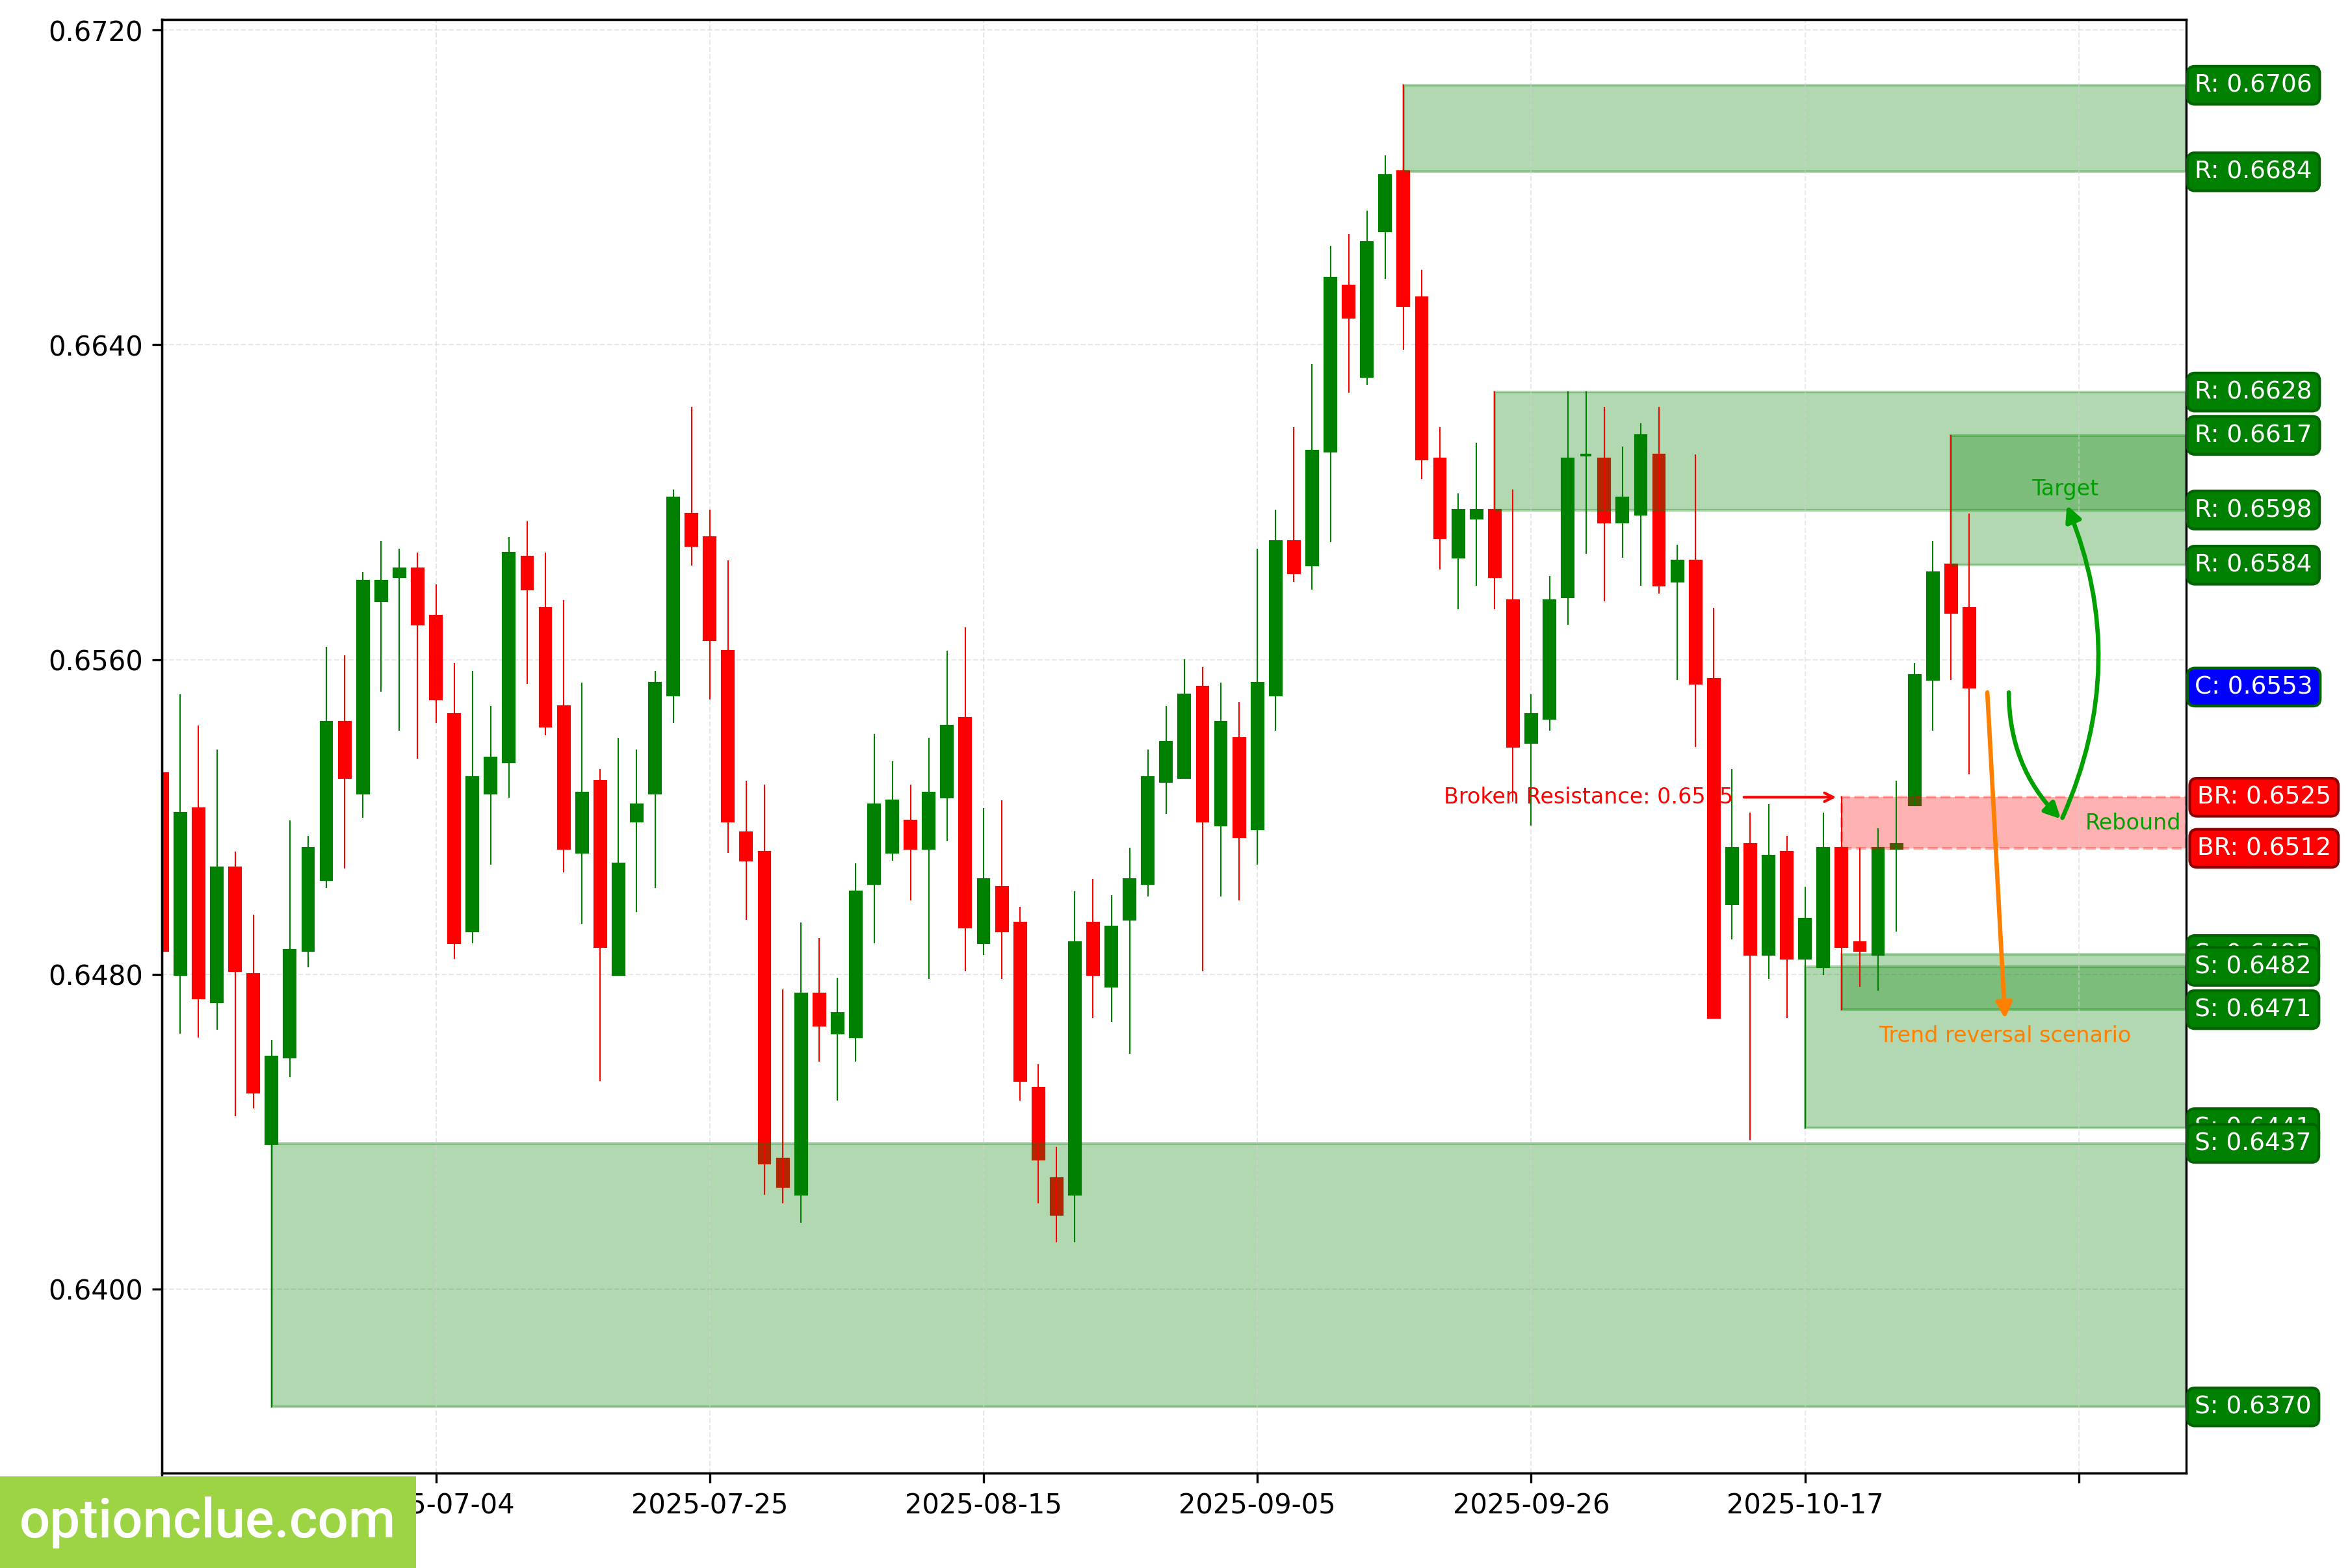
AUDUSD. Technical analysis. D1.
New Zealand Dollar (NZDUSD)
The trend has changed to bullish since the resistance level (0.5744 — 0.5760) was broken last week. A corrective wave is developing. A long entry point on a rebound may form after the current correction is complete.
The intermediate target for the upward movement is the resistance level with boundaries at 0.5781 — 0.5801. If the trend develops successfully, a more distant target will be at the resistance level with boundaries at 0.5842 — 0.5844.
If the correction ends near the support level (0.5681 — 0.5713), the potential reward/risk ratio could be approximately 2:1. For the more distant target — 3:1.
Long positions will remain relevant as long as the market stays above the nearest daily timeframe support level with boundaries at 0.5681 — 0.5713.
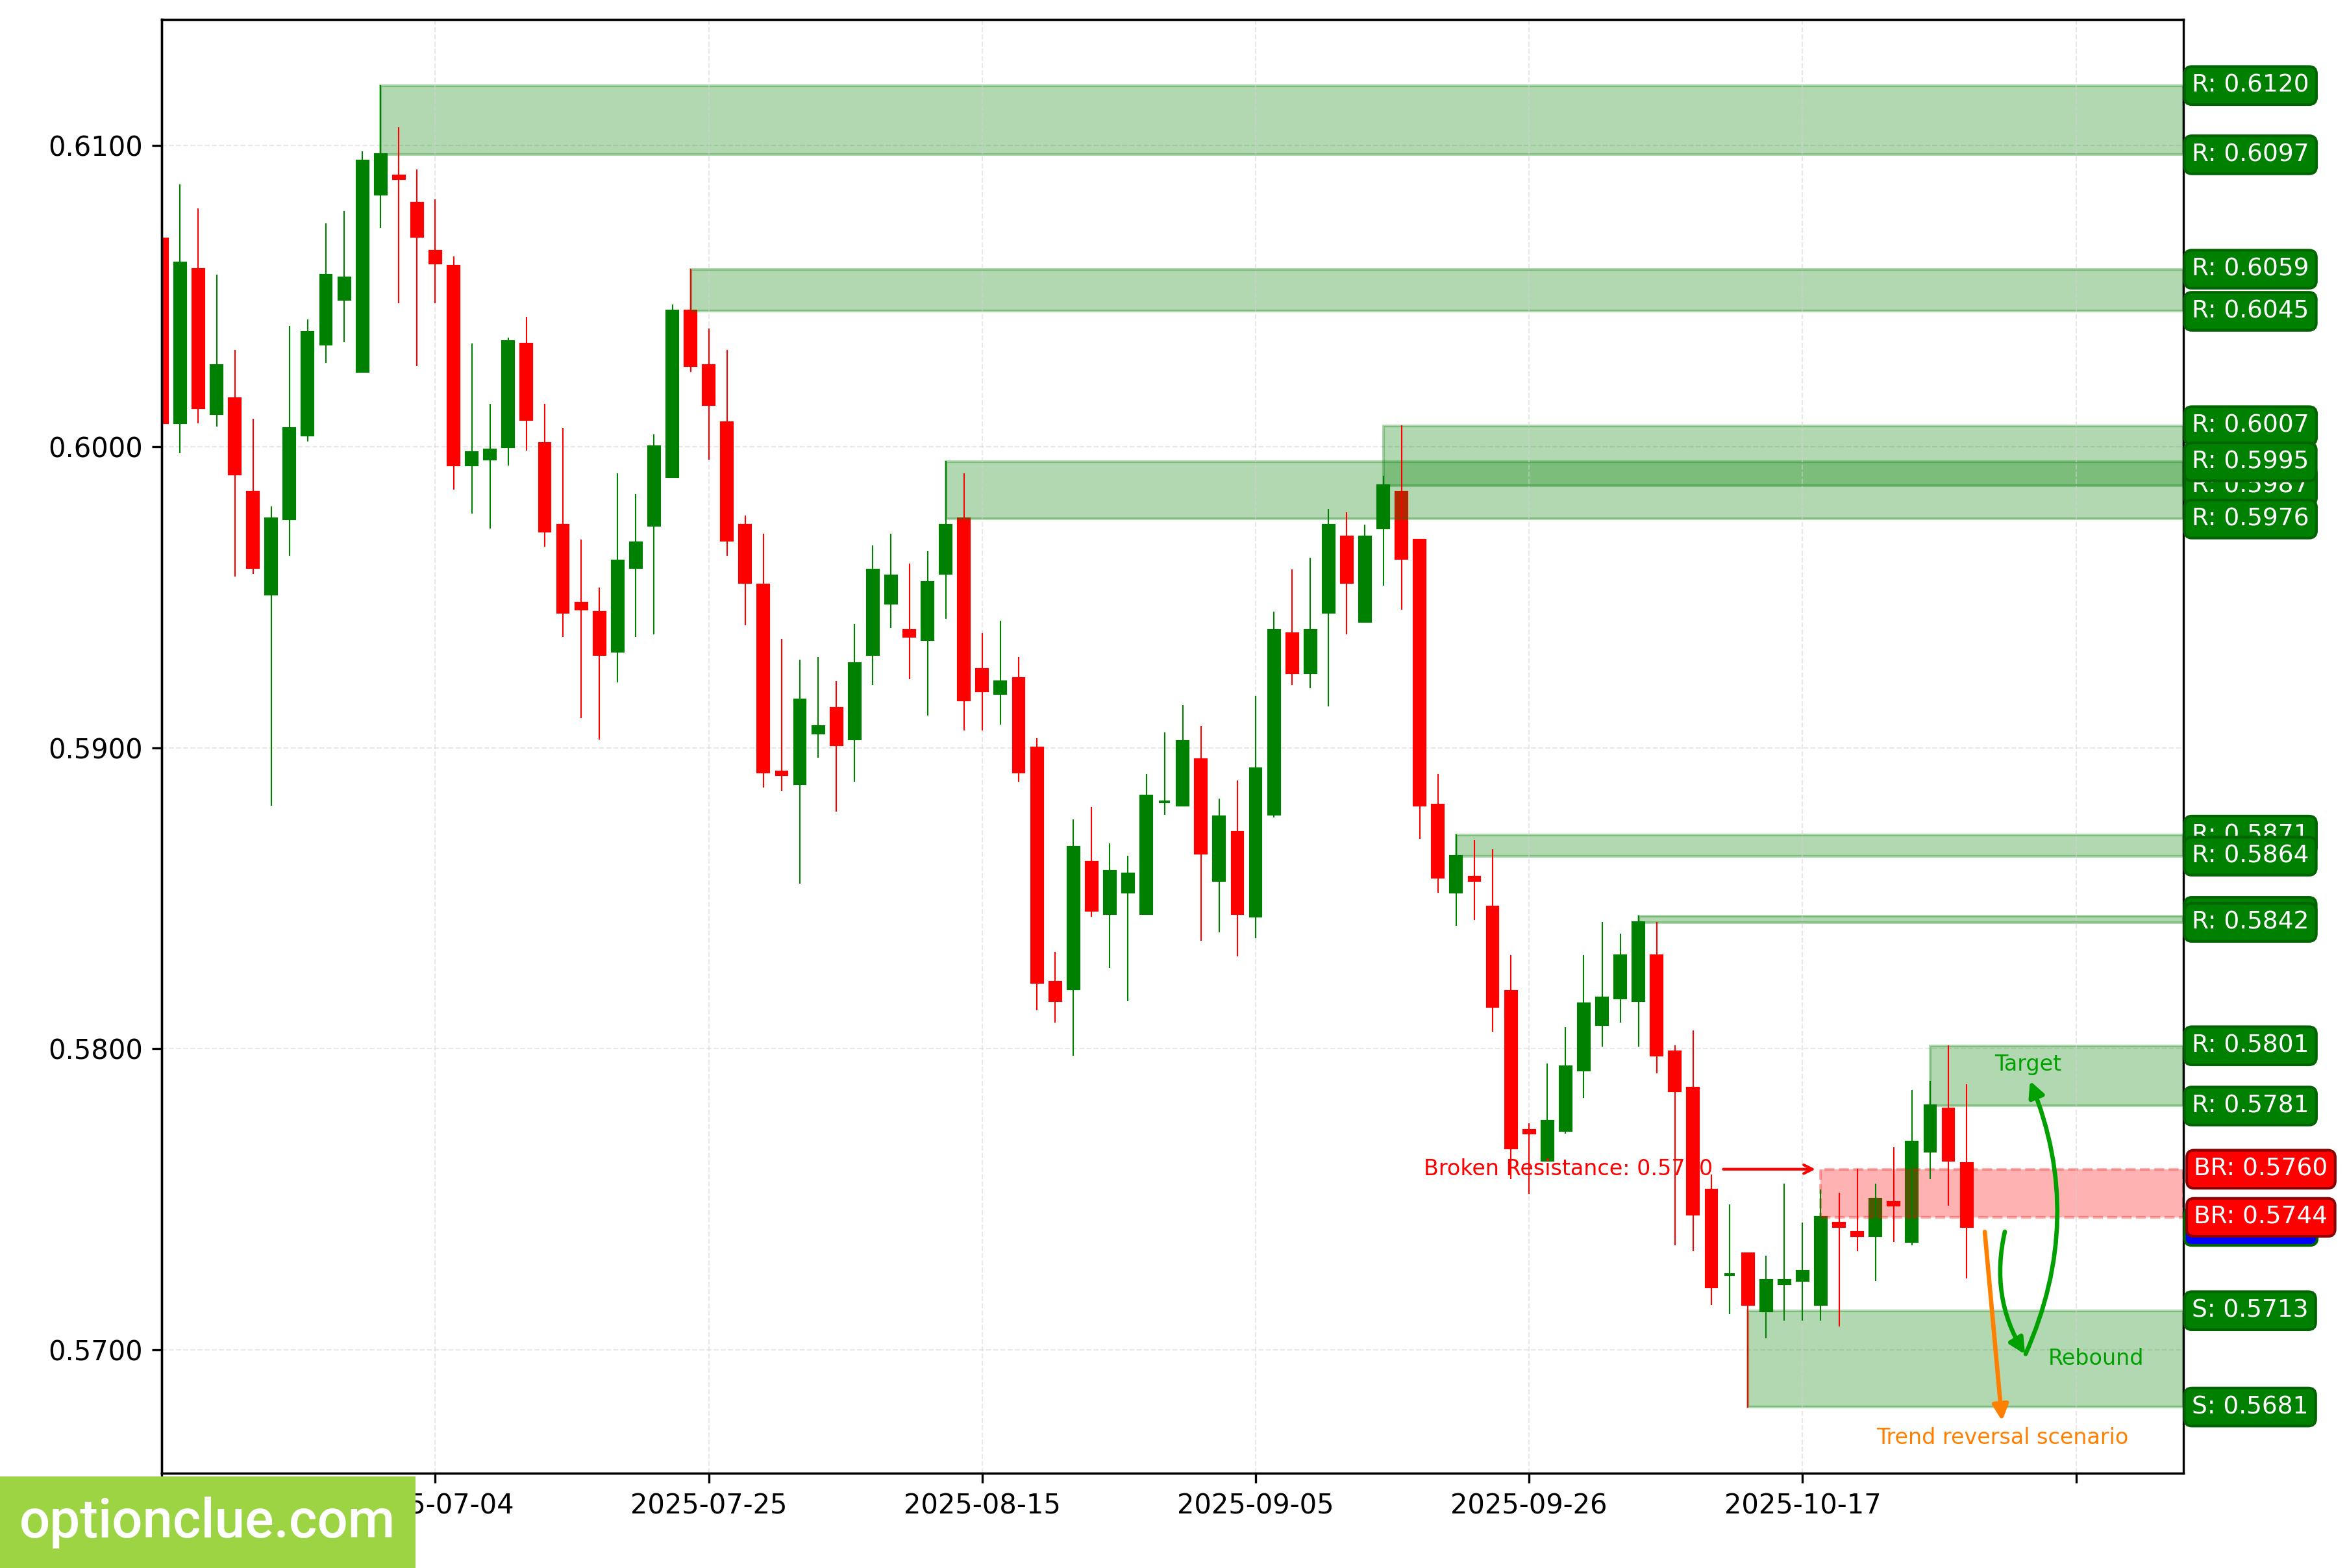
NZDUSD. Technical analysis. D1.
Bitcoin (BTC)
The trend has changed to bullish since the resistance level (110568 — 114082) was broken last week. Two candlesticks ago, the correction likely ended and a long entry point on a rebound was formed; an impulse wave is now developing.
The intermediate target for the upward movement is the resistance level with boundaries at 114562 — 116410. If the market successfully consolidates above this resistance, it will open the way for a price move to target #2 — the resistance level with boundaries at 123343 — 124254.
The potential reward/risk ratio from current prices, when setting targets and managing risk based on daily timeframe levels, could be around 2:1.
Long positions will remain relevant as long as the market stays above the nearest daily timeframe support level with boundaries at 106639 — 107586.
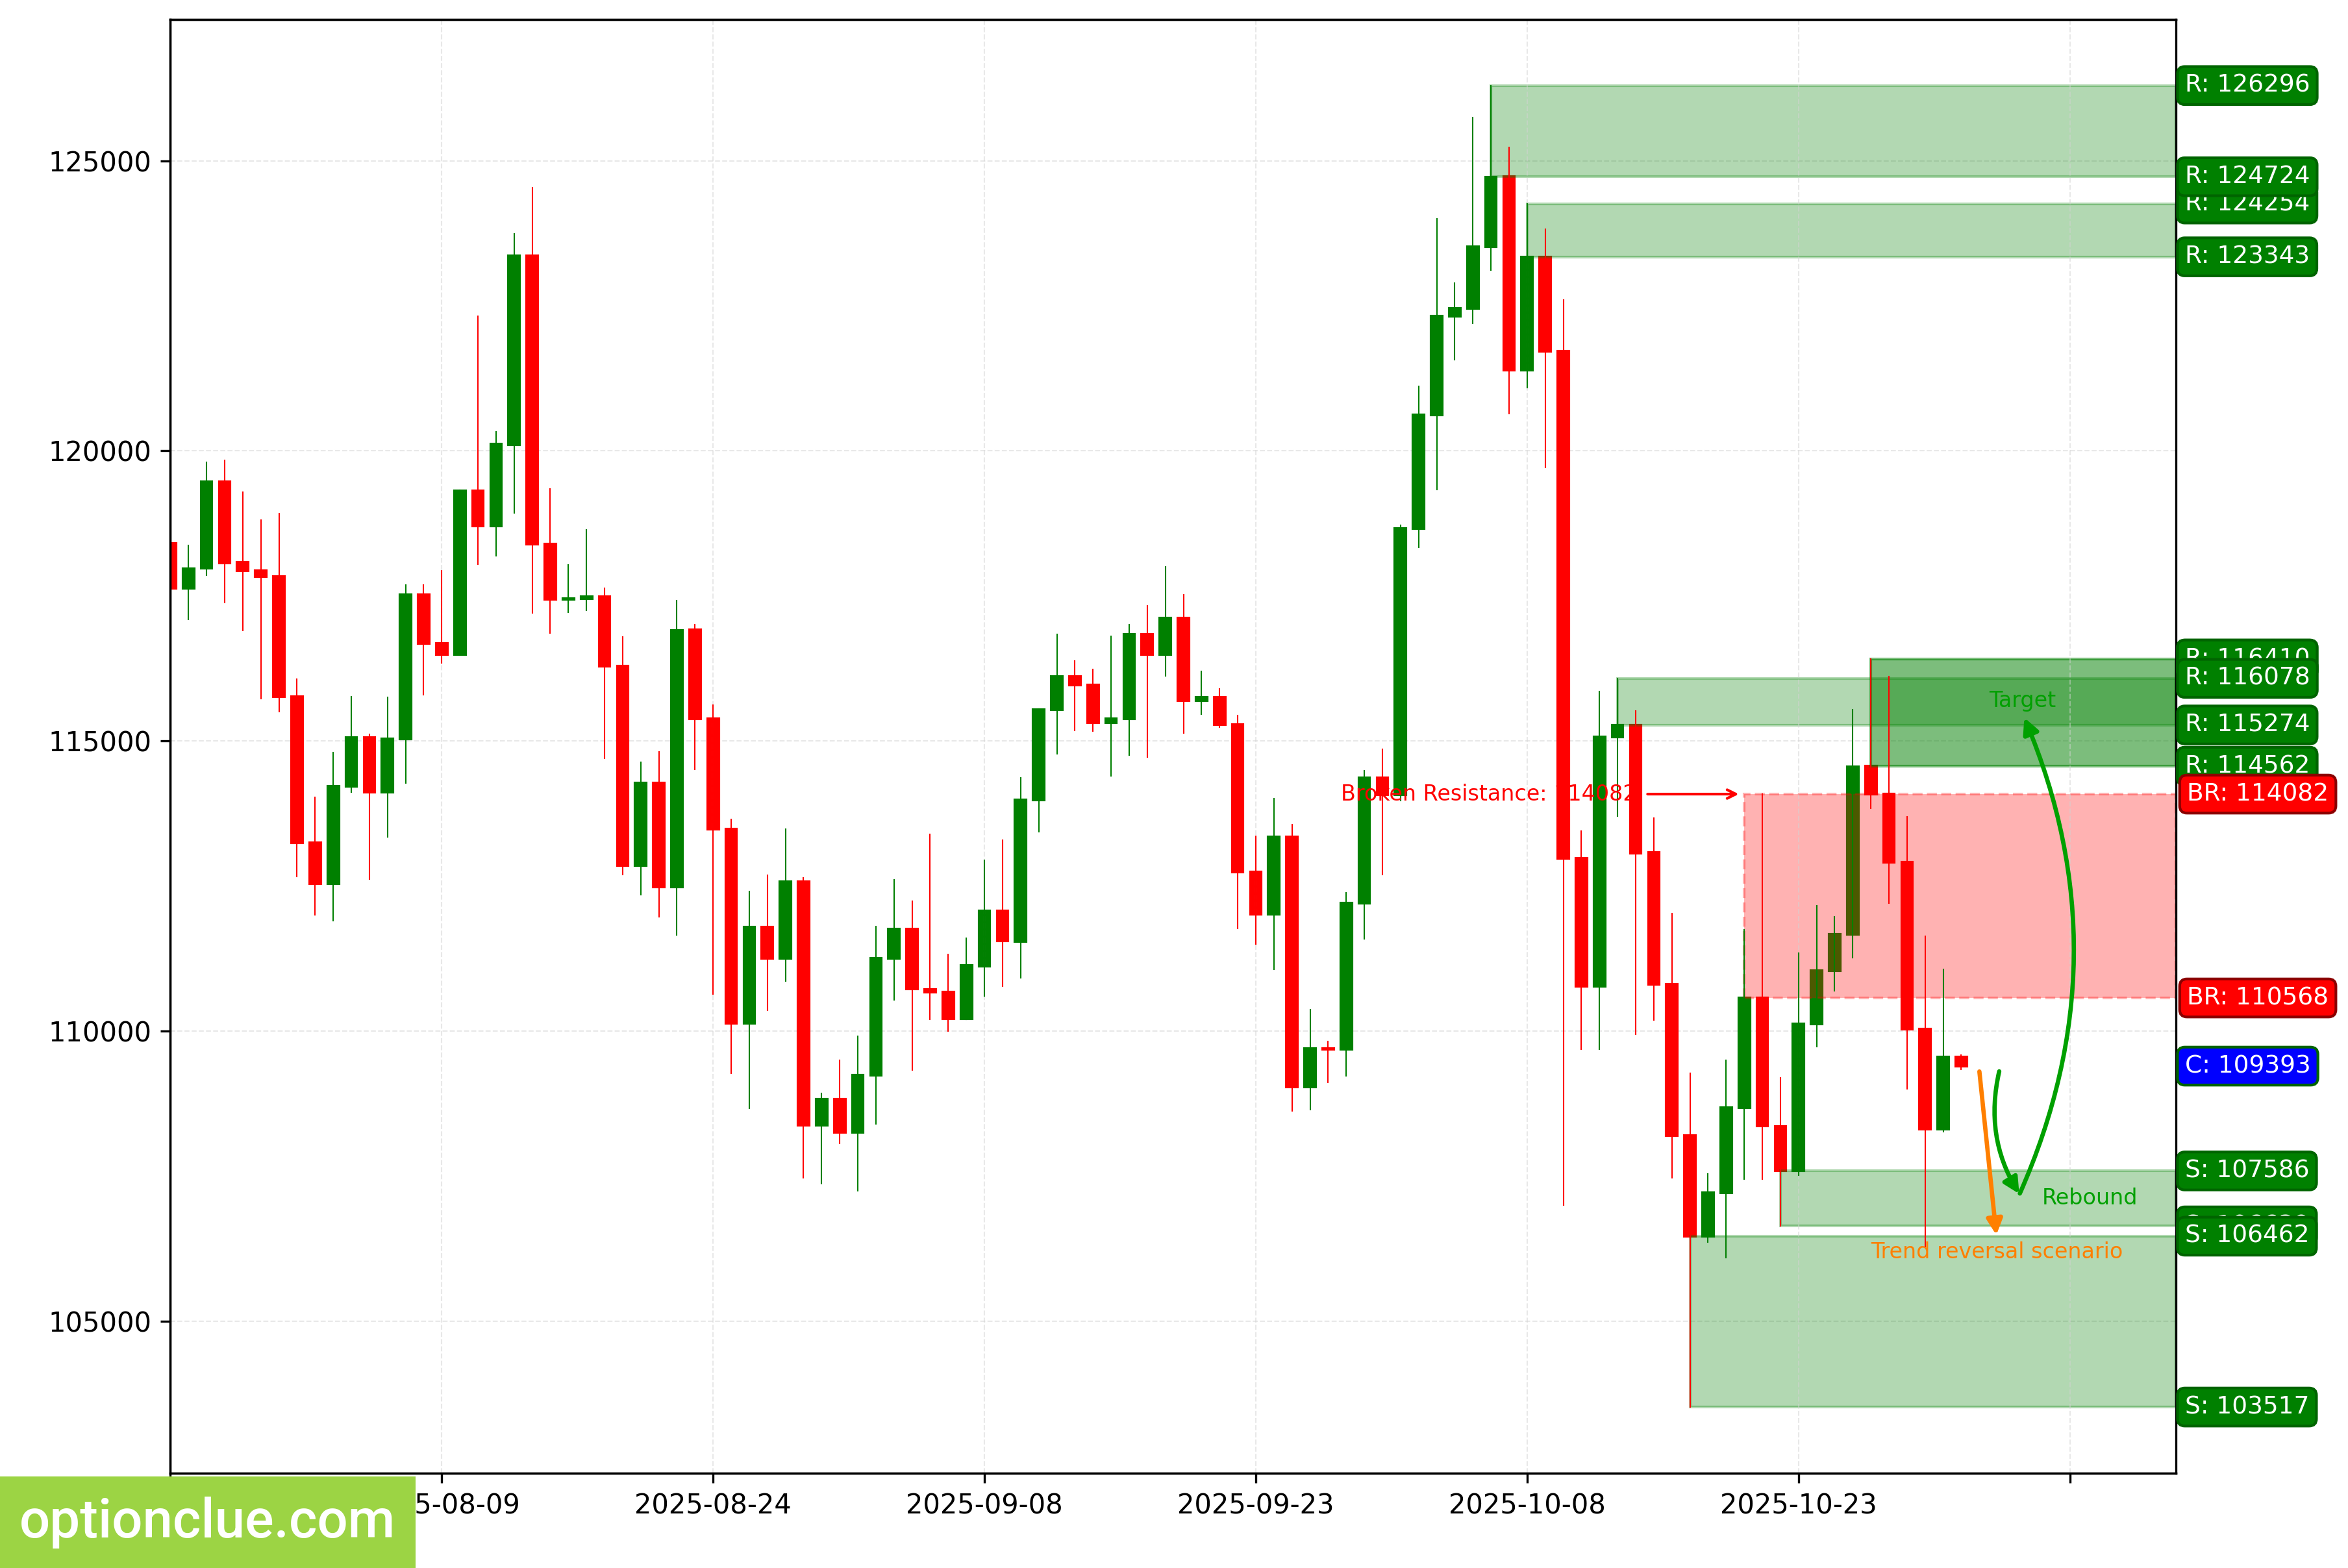
BTC. Technical analysis. D1.
Ether (ETH)
The trend has changed to bullish since the resistance level (3984 — 4113) was broken last week. A corrective wave is developing. A long entry point on a rebound may form after the current correction is complete.
The intermediate target for the upward movement is the resistance level with boundaries at 4159 — 4254. If the market successfully consolidates above this resistance, it will open the way for a price move to target #2 — the resistance level with boundaries at 4245 — 4296.
If a new correction ends near the support level (3674 — 3833), the potential reward/risk ratio will be approximately 2:1.
Long positions will remain relevant as long as the market stays above the daily timeframe support level with boundaries at 3674 — 3833.
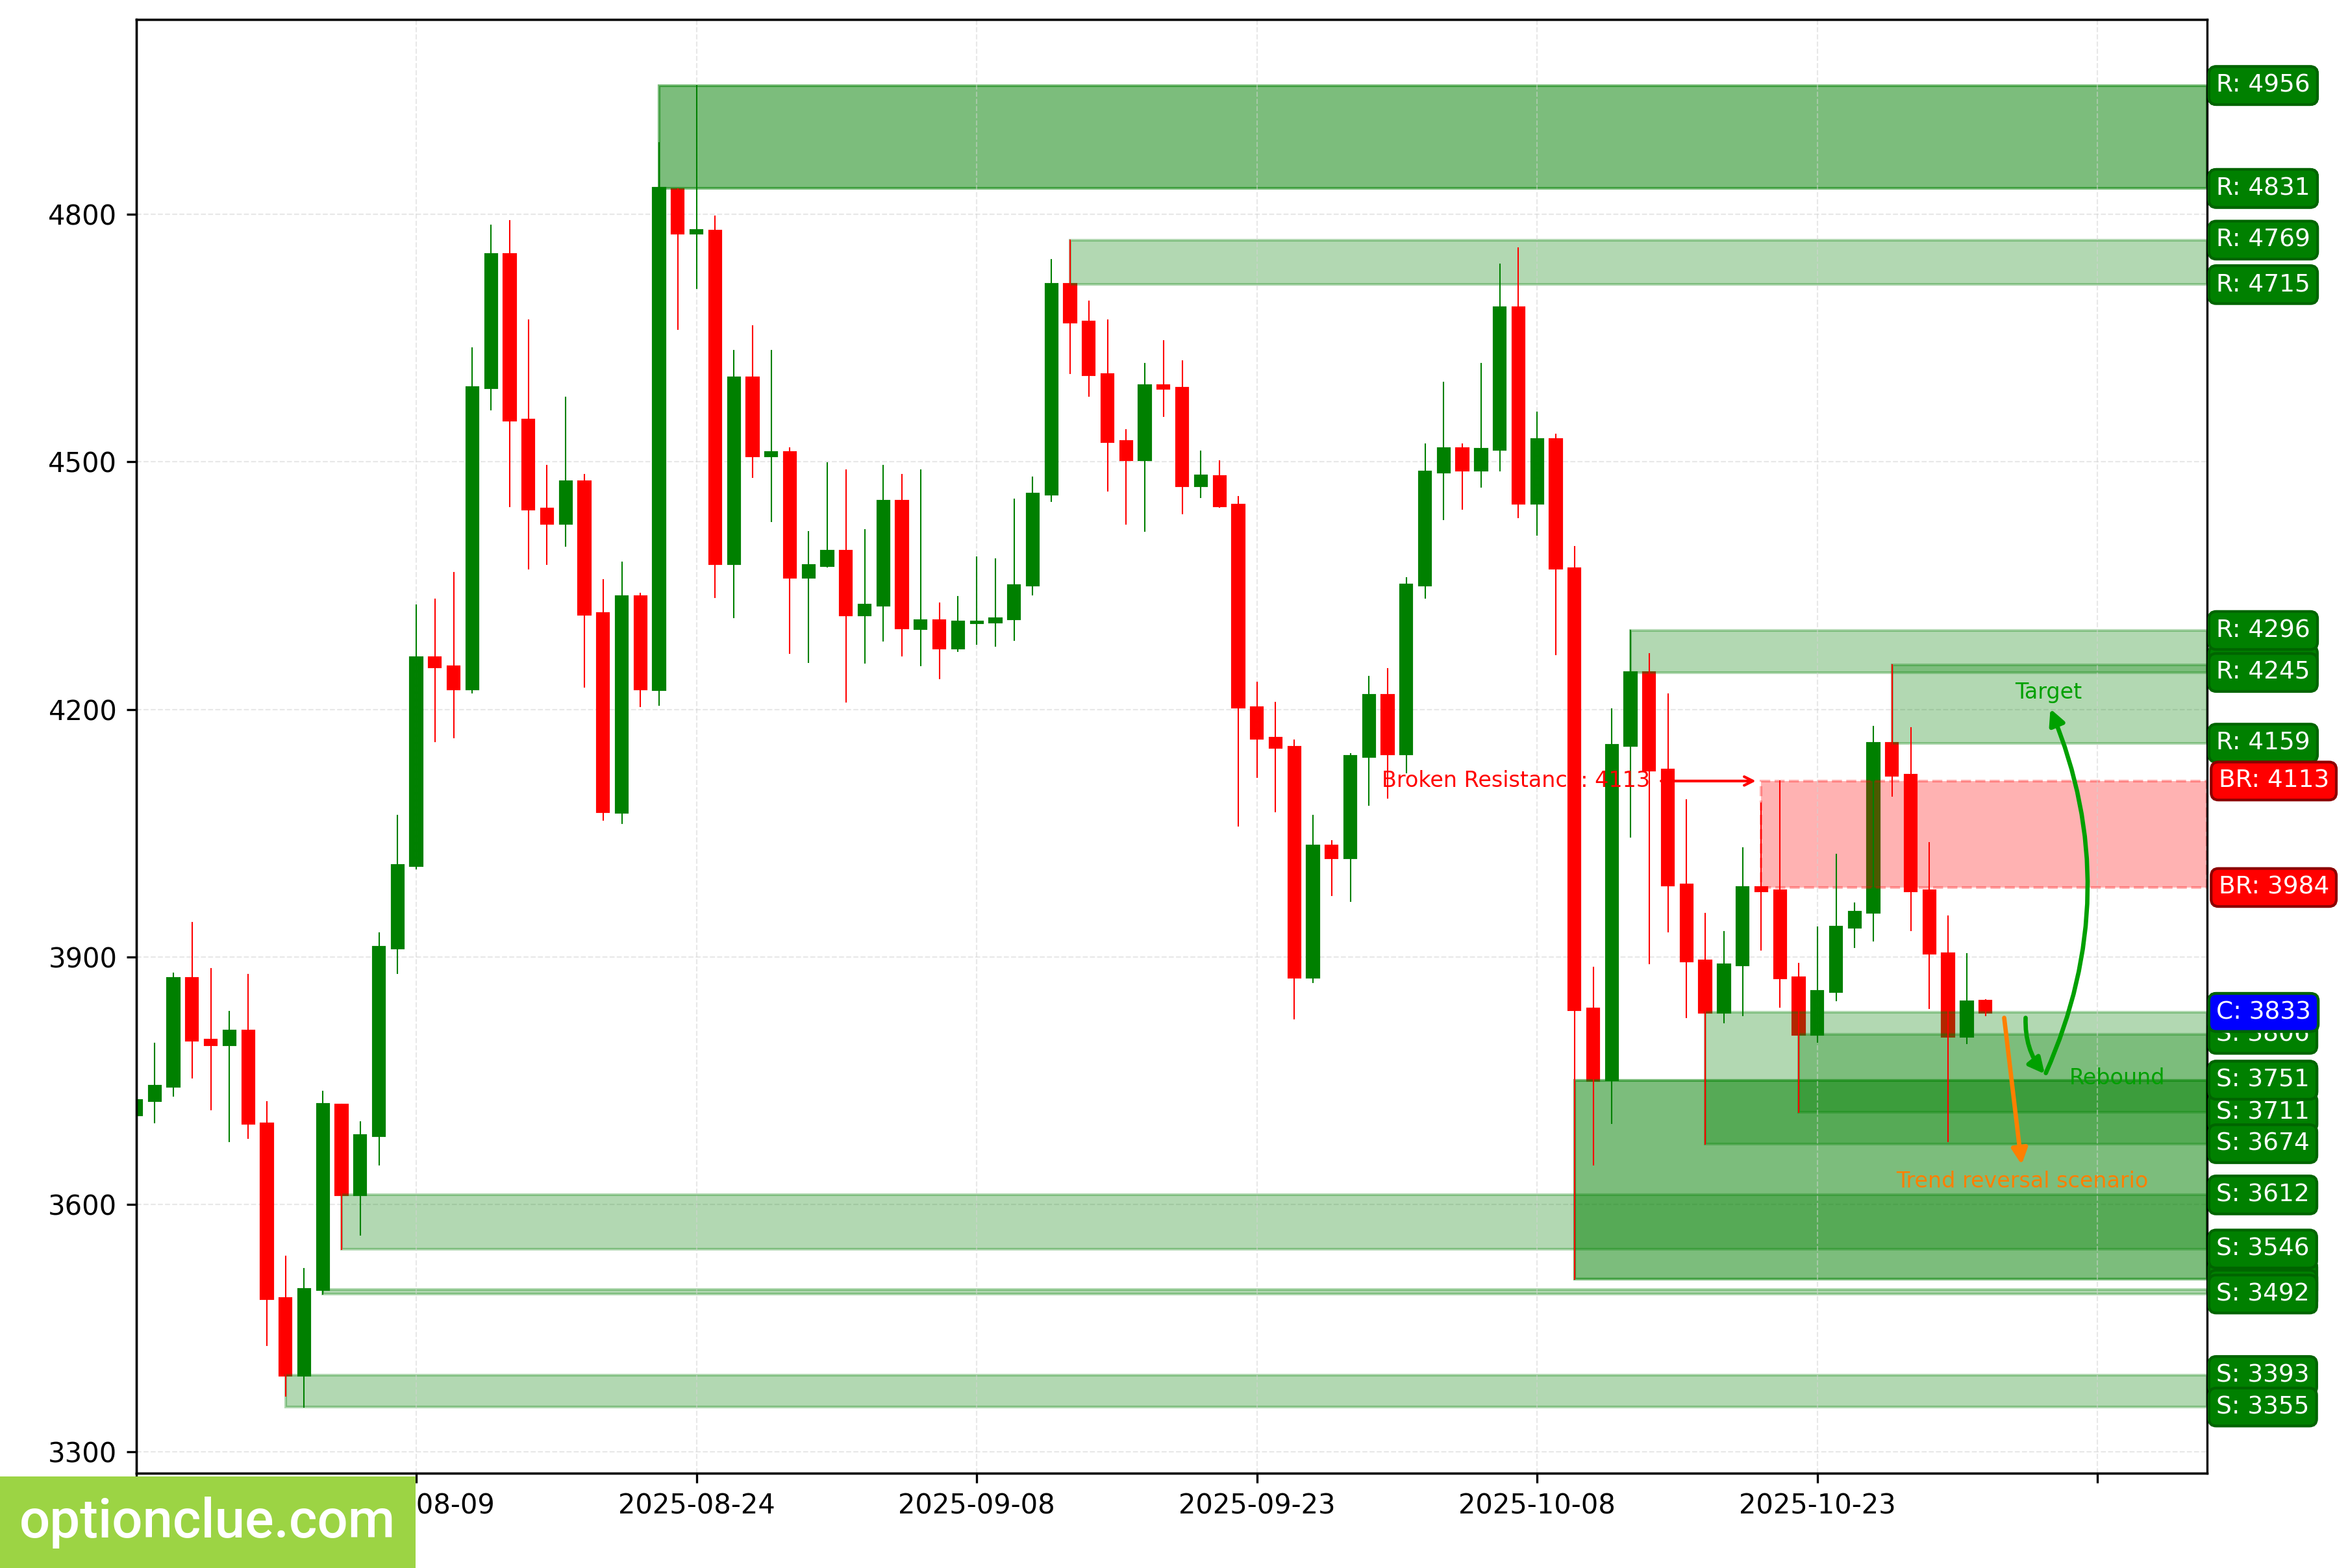
ETH. Technical analysis. D1.
Apple Inc (AAPL)
The bullish trend continues, and a corrective wave is developing. A long entry point on a rebound may form after the current correction is complete.
The last broken level was the resistance at (262.77 — 265.29). The breakout occurred 4 days ago.
Long positions will remain relevant as long as the market stays above the nearest support level with boundaries at 258.01 — 259.58.
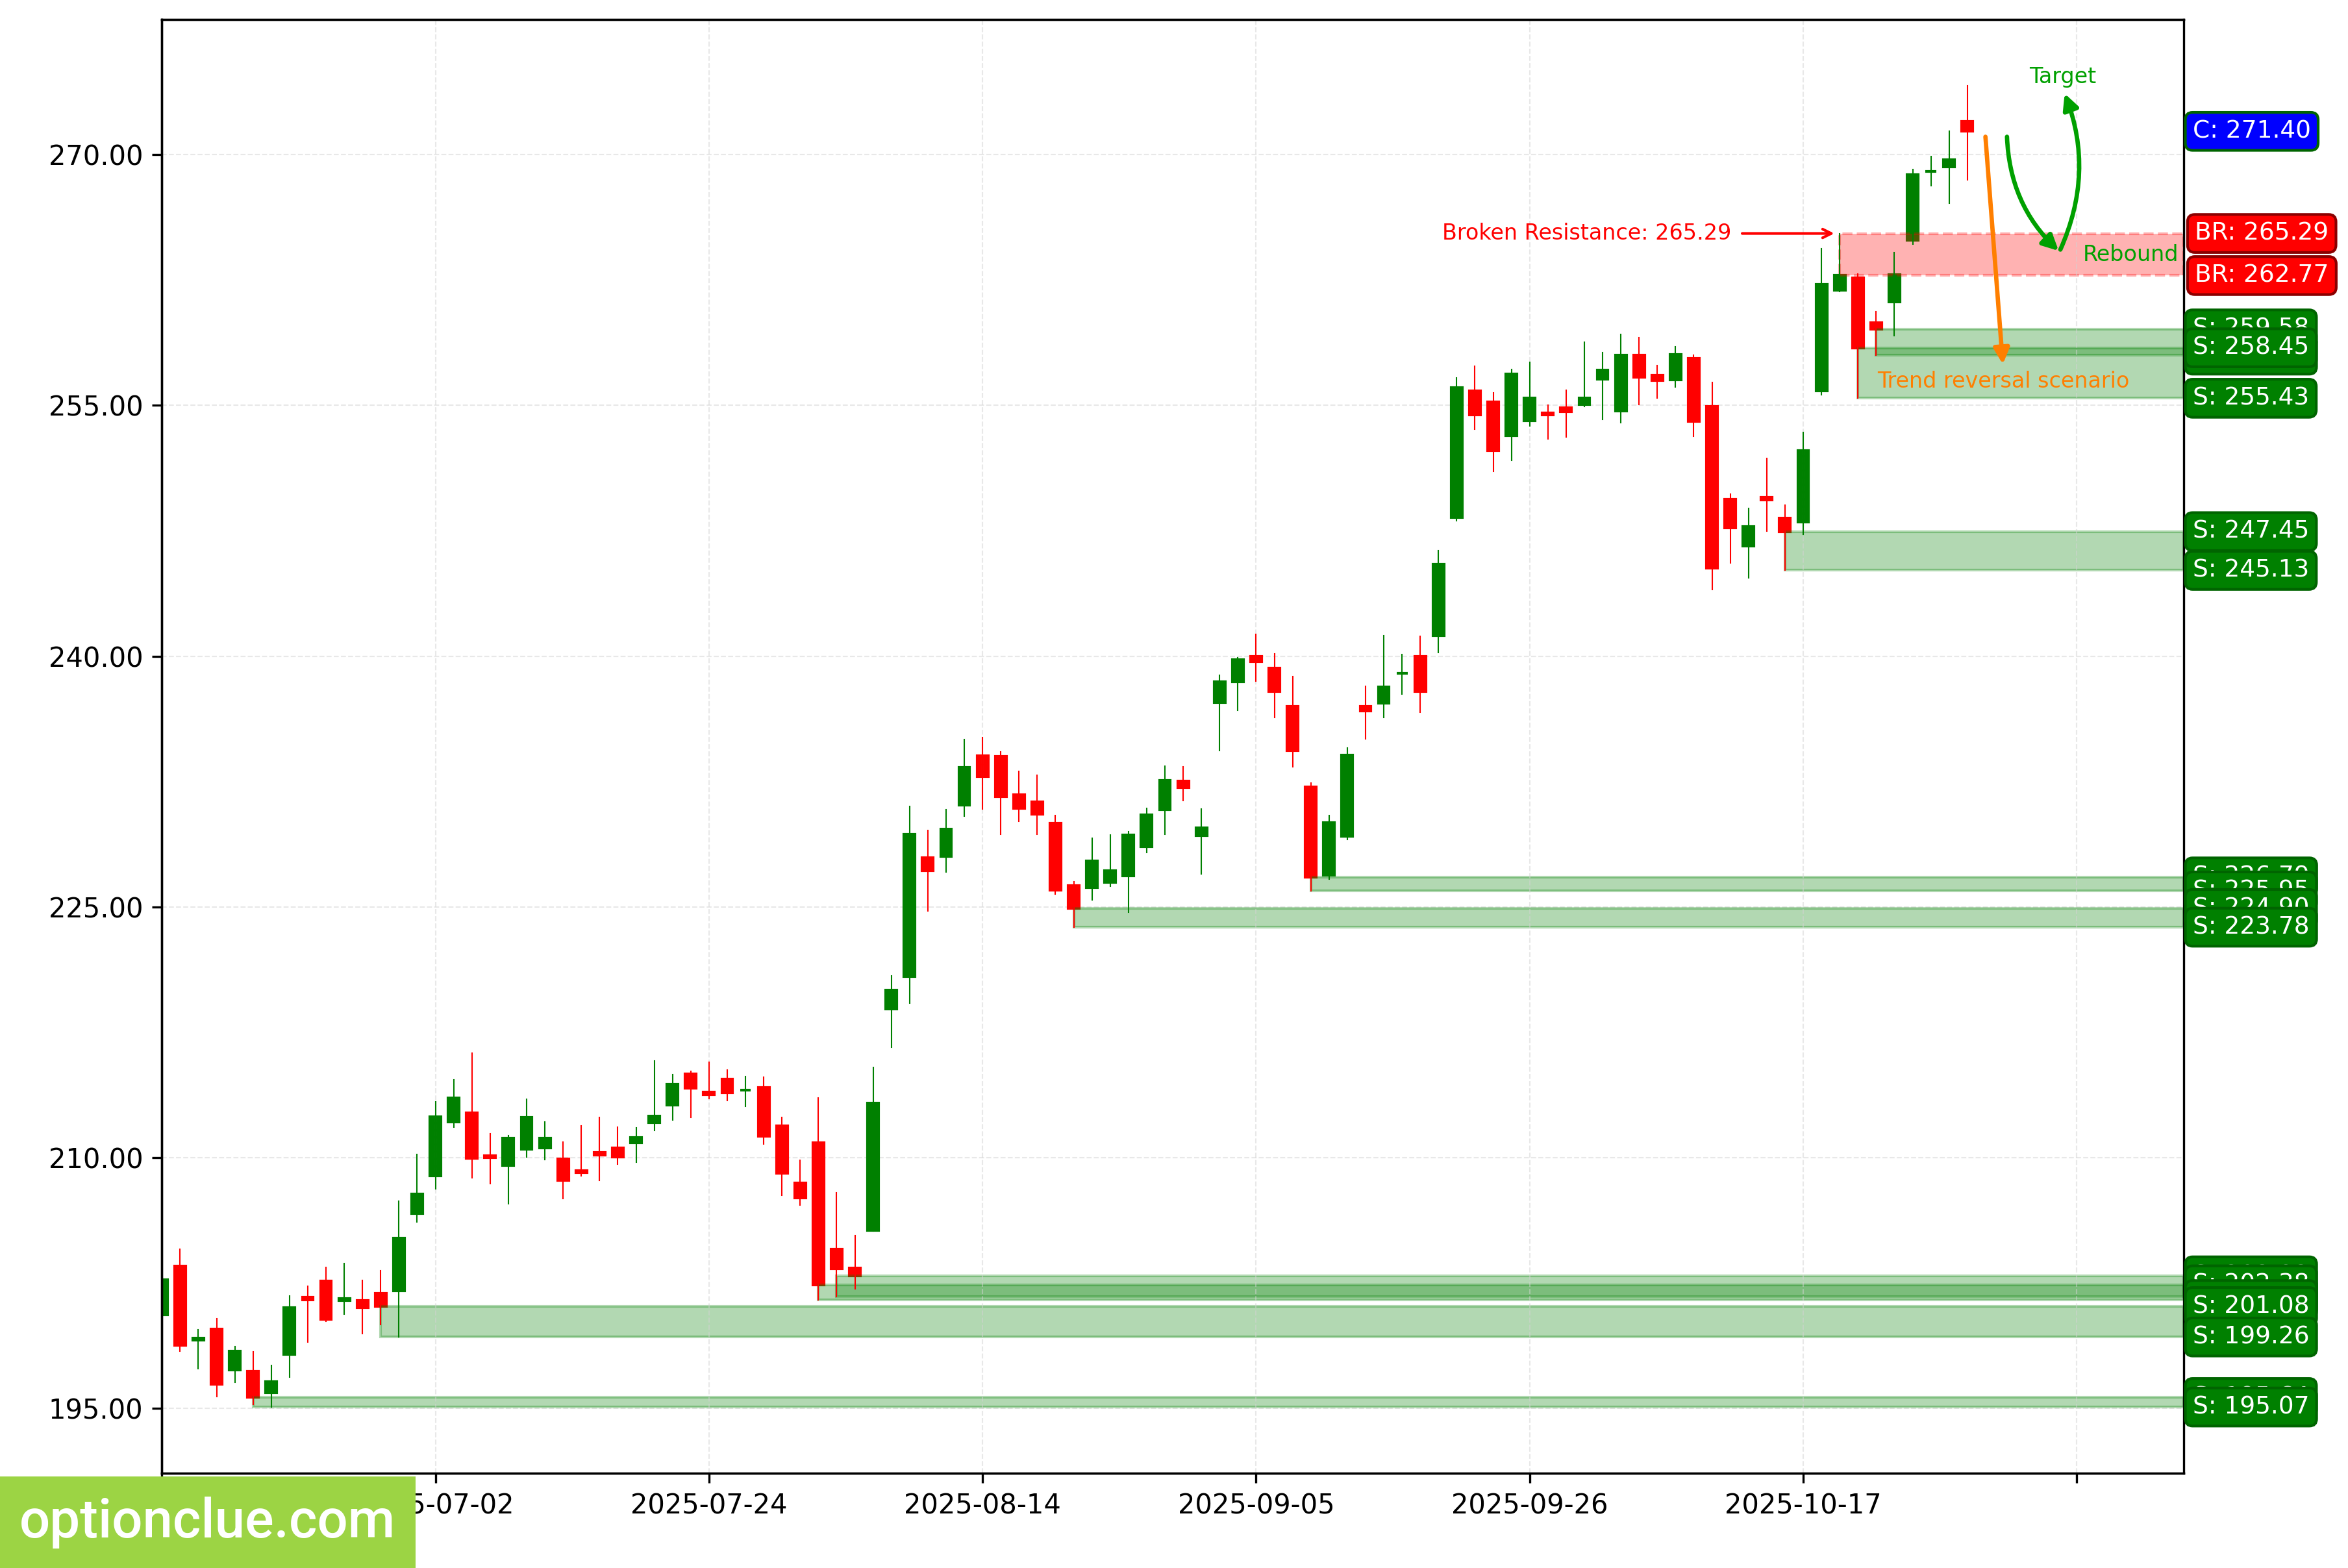
AAPL. Technical analysis. D1.
NVIDIA Corp (NVDA)
The last broken level was the resistance at (183.22 — 185.20). The breakout occurred 5 days ago. The bullish trend continues, and a corrective wave is developing.
New long entry points on a rebound on the daily timeframe may form after the correction is complete. The intermediate target for the upward movement is the resistance level with boundaries at 207.98 — 212.19.
If the correction ends near the last broken level (183.22 — 185.20), the potential reward/risk ratio will be around 3:1.
Long positions will remain relevant as long as the market stays above the nearest daily timeframe support level with boundaries at 176.76 — 180.28.
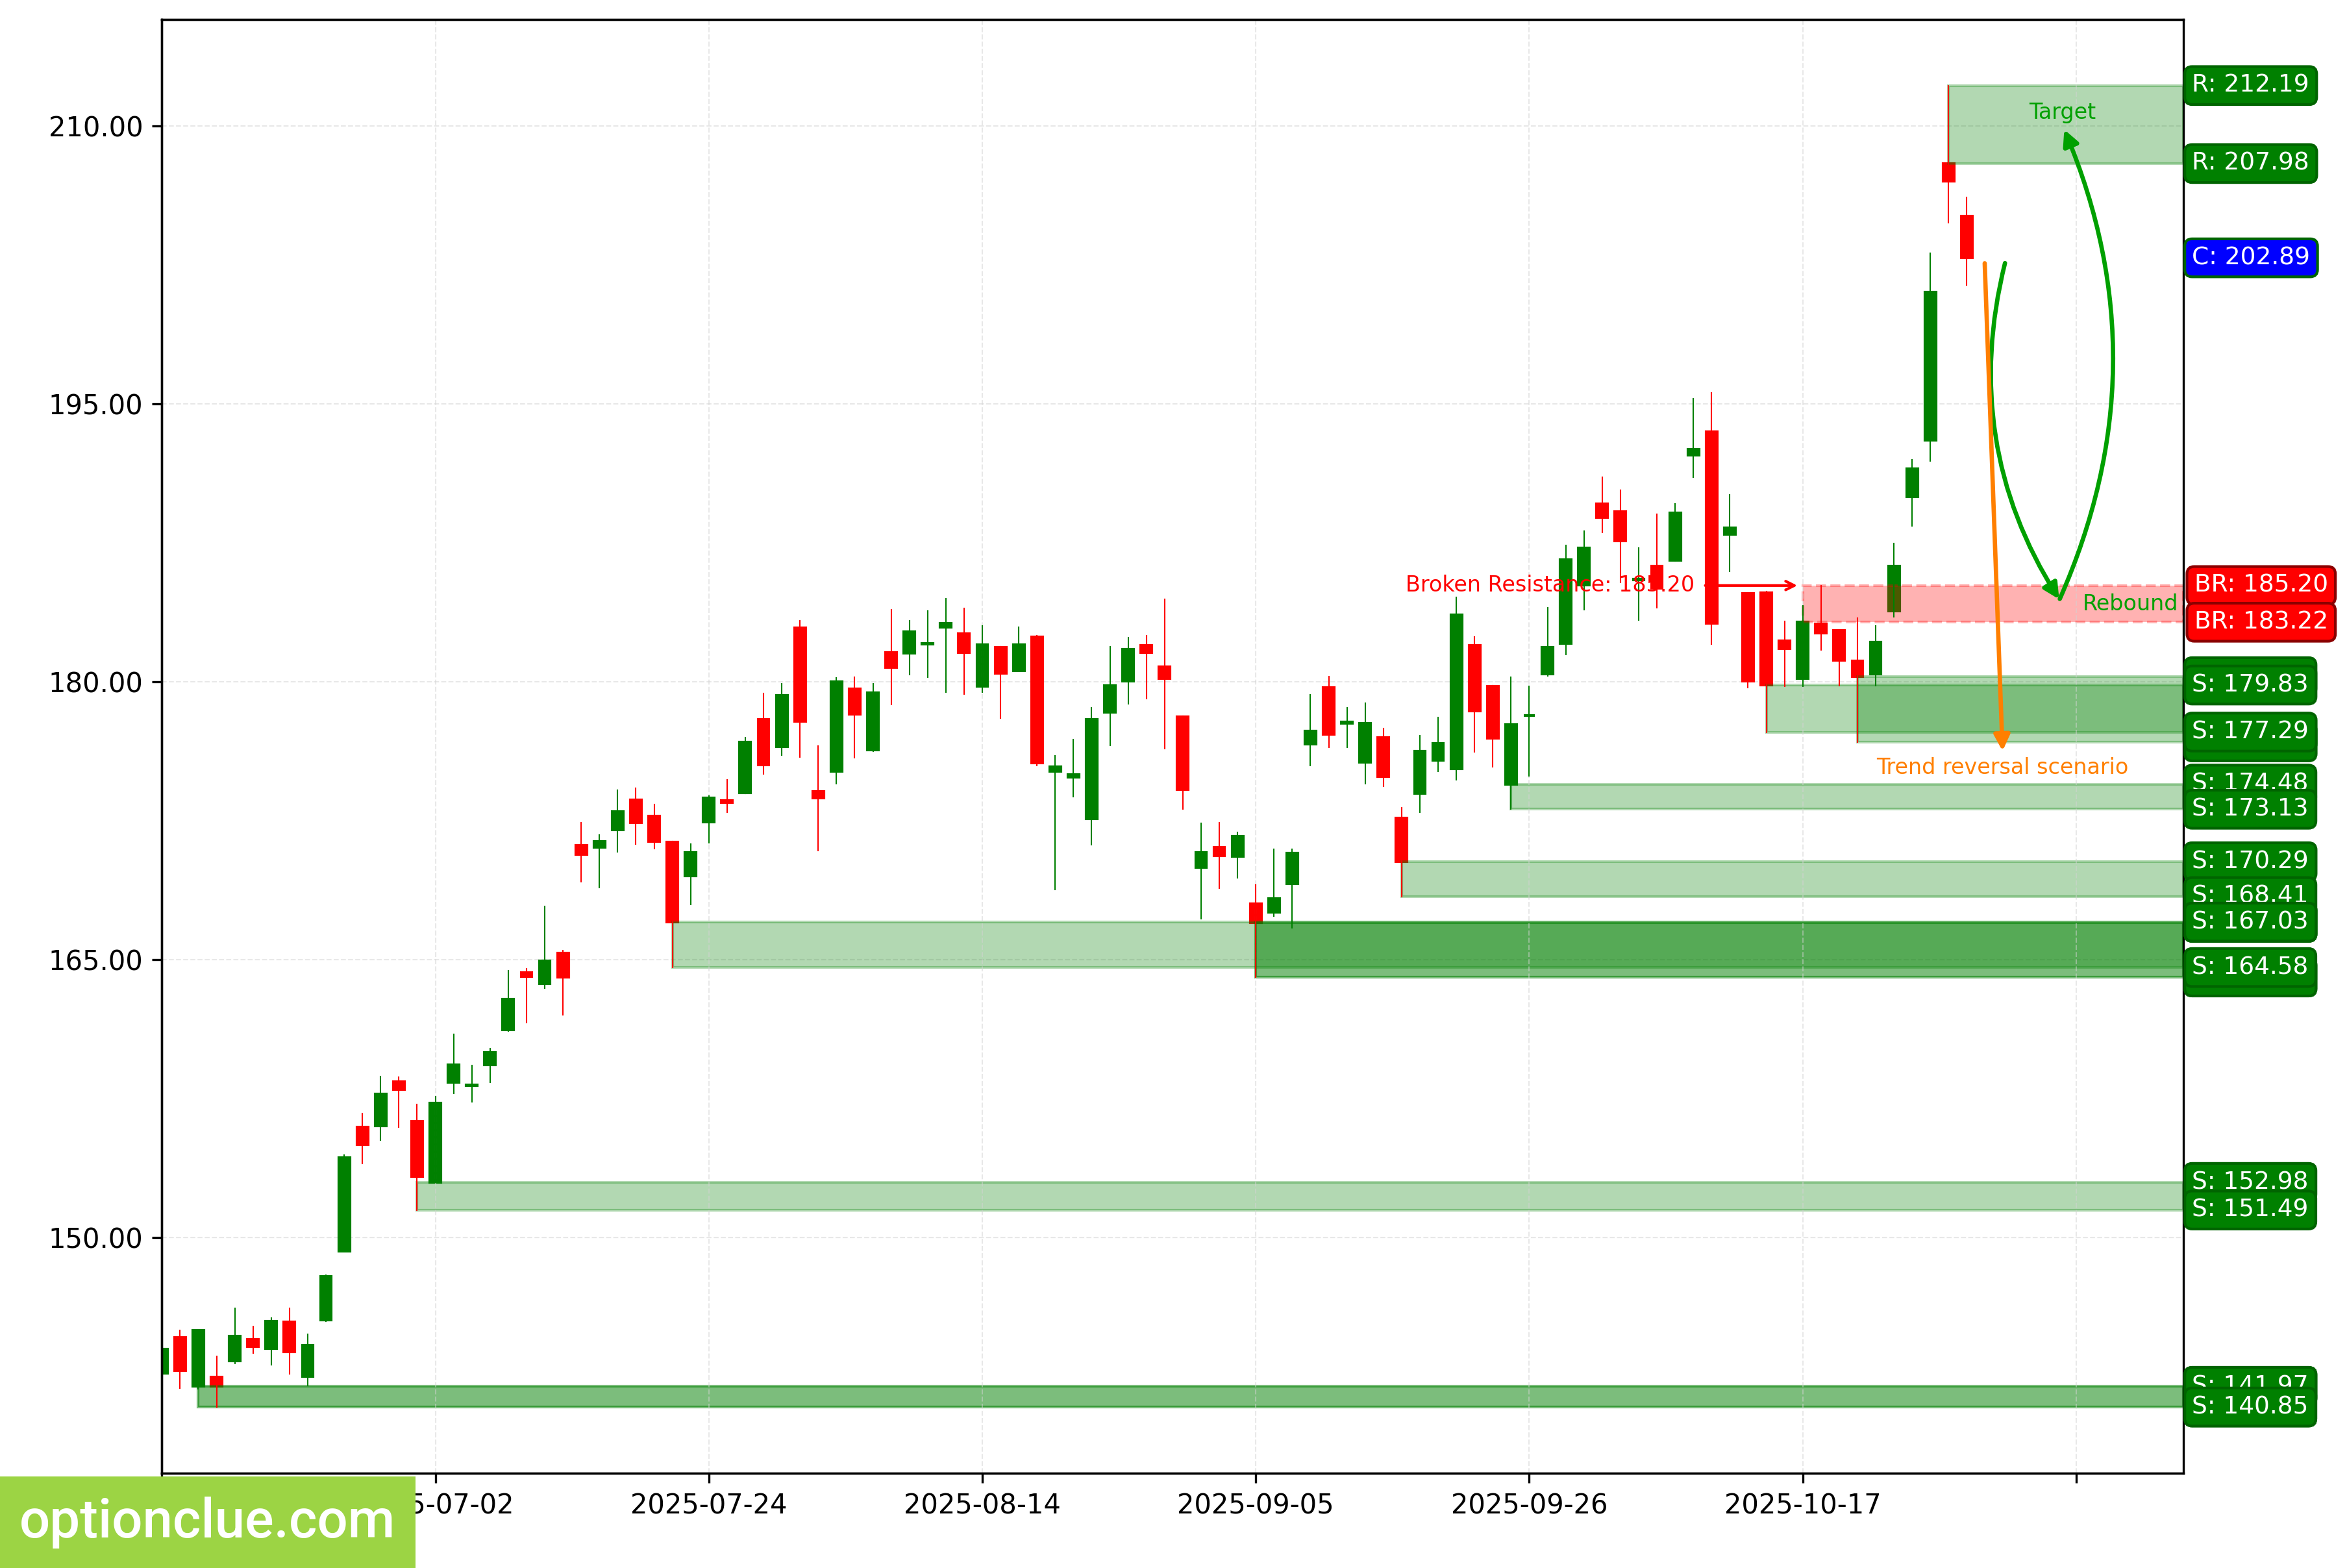
NVDA. Technical analysis. D1.
Tesla Inc (TSLA)
The bullish trend continues, and a corrective wave is developing. A long entry point on a rebound may form after the current correction is complete.
The intermediate target for the upward movement is the resistance level with boundaries at 462.50 — 467.00. The last broken level was the resistance at (448.98 — 451.68). The breakout occurred 4 days ago.
If the market successfully consolidates above this resistance, it will open the way for a price move to target #2 — the resistance level with boundaries at 470.54 — 470.75.
Long positions will remain relevant as long as the market stays above the nearest daily timeframe support level with boundaries at 430.17 — 433.72.
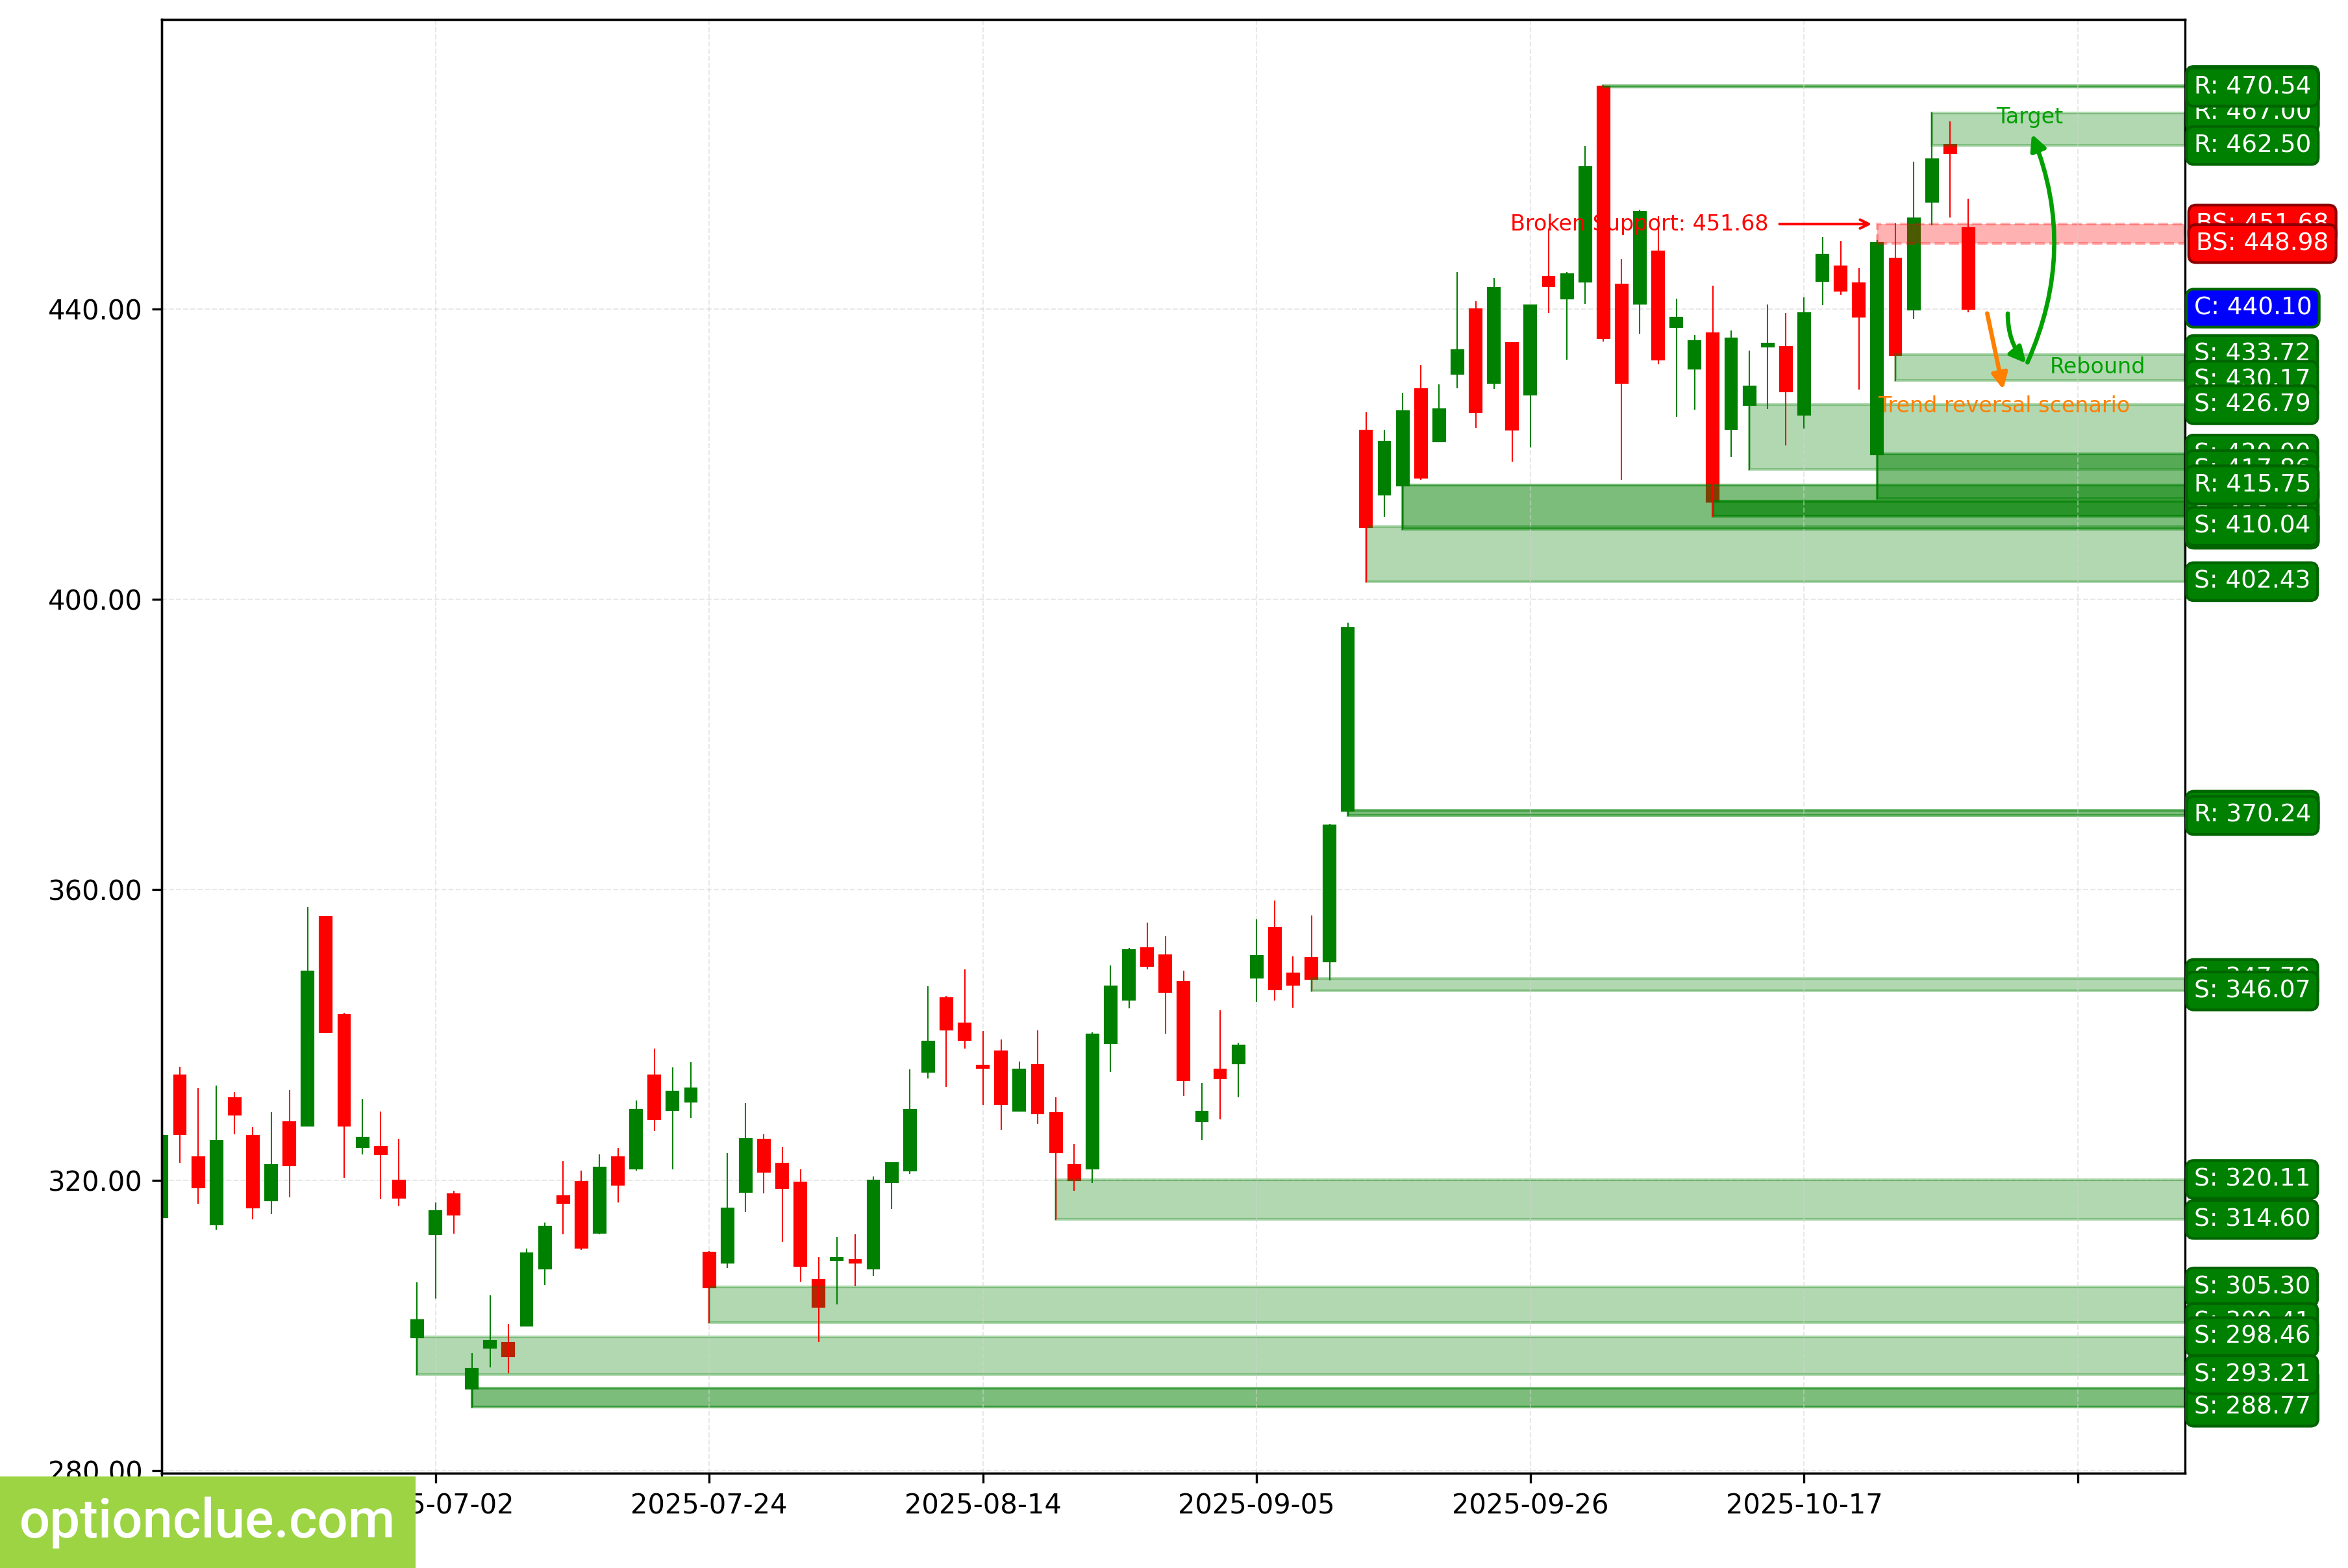
TSLA. Technical analysis. D1.
Summary
In the medium term, AUDUSD, NZDUSD, BTC, ETH, TSLA stand out with corrections on the daily timeframe that are nearing completion.
The other assets may be worth watching, depending on the depth of their market correction.