
We are reviewing the most important levels for key financial instruments and likely scenarios for developments.
Key Topics
- Euro (EURUSD)
- British Pound (GBPUSD)
- Japanese Yen (USDJPY)
- Canadian Dollar (USDCAD)
- Australian Dollar (AUDUSD)
- New Zealand Dollar (NZDUSD)
- Bitcoin (BTC)
- Ether (ETH)
- Apple Inc (AAPL)
- NVIDIA Corp (NVDA)
- Tesla Inc (TSLA)
- Summary
Euro (EURUSD)
Bullish trend continues, a corrective wave is developing again. An entry point for buying on rebound may form after the current correction completes. The last broken level is resistance (1.1668 — 1.1699). The breakout occurred 9 candlesticks ago.
Intermediate target for the upward movement is the resistance level with boundaries 1.2023 — 1.2081.
If the next correction completes near the support level (1.1574 — 1.1604), the potential profit/risk ratio could be more than 3:1. If the next correction completes near the last broken level (1.1668 — 1.1699), the potential profit/risk ratio could be about 1.6:1.
Long positions will remain relevant, as long as the market is above the nearest support level with boundaries 1.1574 — 1.1604. If the market successfully closes below this support, the trend will reverse to the opposite (bearish).
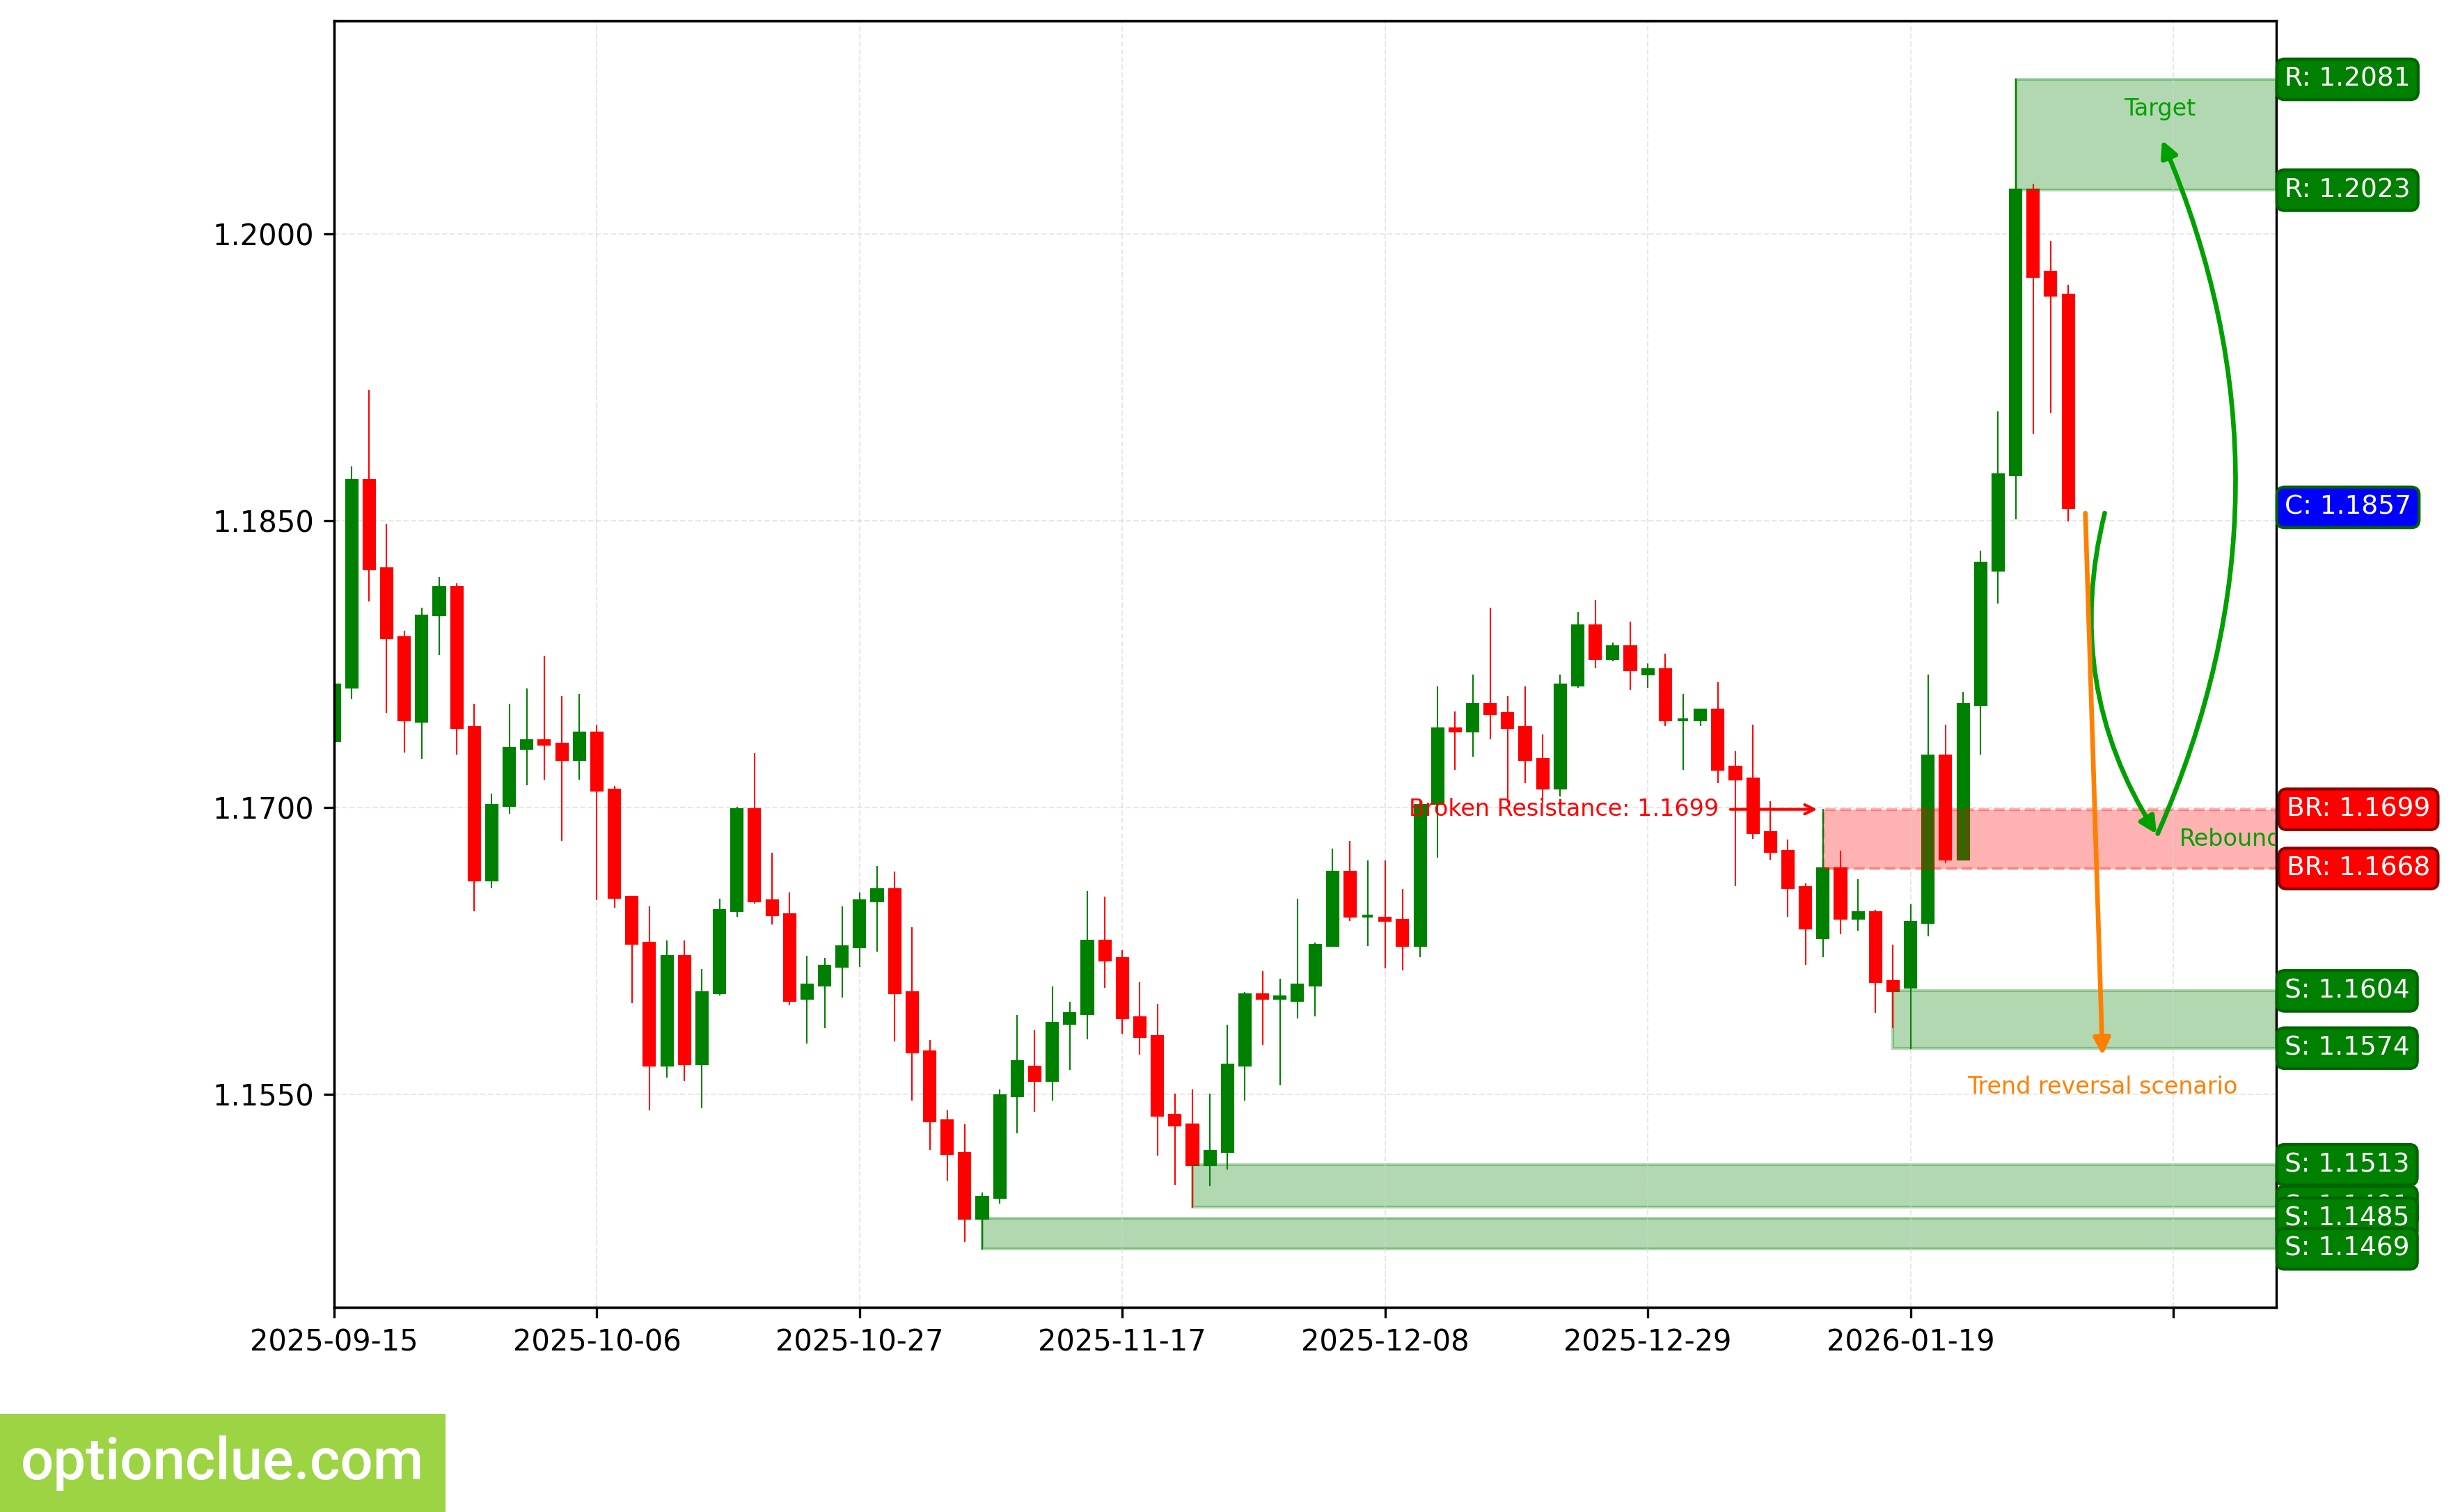
EURUSD. Technical analysis. D1.
British Pound (GBPUSD)
Bullish trend continues, a corrective wave is developing. An entry point for buying on rebound may form after the current correction completes. The last broken level is resistance (1.3466 — 1.3495). The breakout occurred 7 candlesticks ago.
Intermediate target for the upward movement is the resistance level with boundaries 1.3827 — 1.3868.
The potential profit/risk ratio from current prices when setting targets and fixing risks based on daily timeframe levels may be small (about 0.3:1). If the next correction completes near the support level (1.3333 — 1.3372), the potential profit/risk ratio could be about 3.6:1. If the next correction completes near the last broken level (1.3466 — 1.3495), the potential profit/risk ratio could be around 1.3:1.
Long positions will remain relevant, as long as the market is above the nearest support level with boundaries 1.3333 — 1.3372. If the market successfully closes below this support, the trend will reverse to the opposite (bearish).
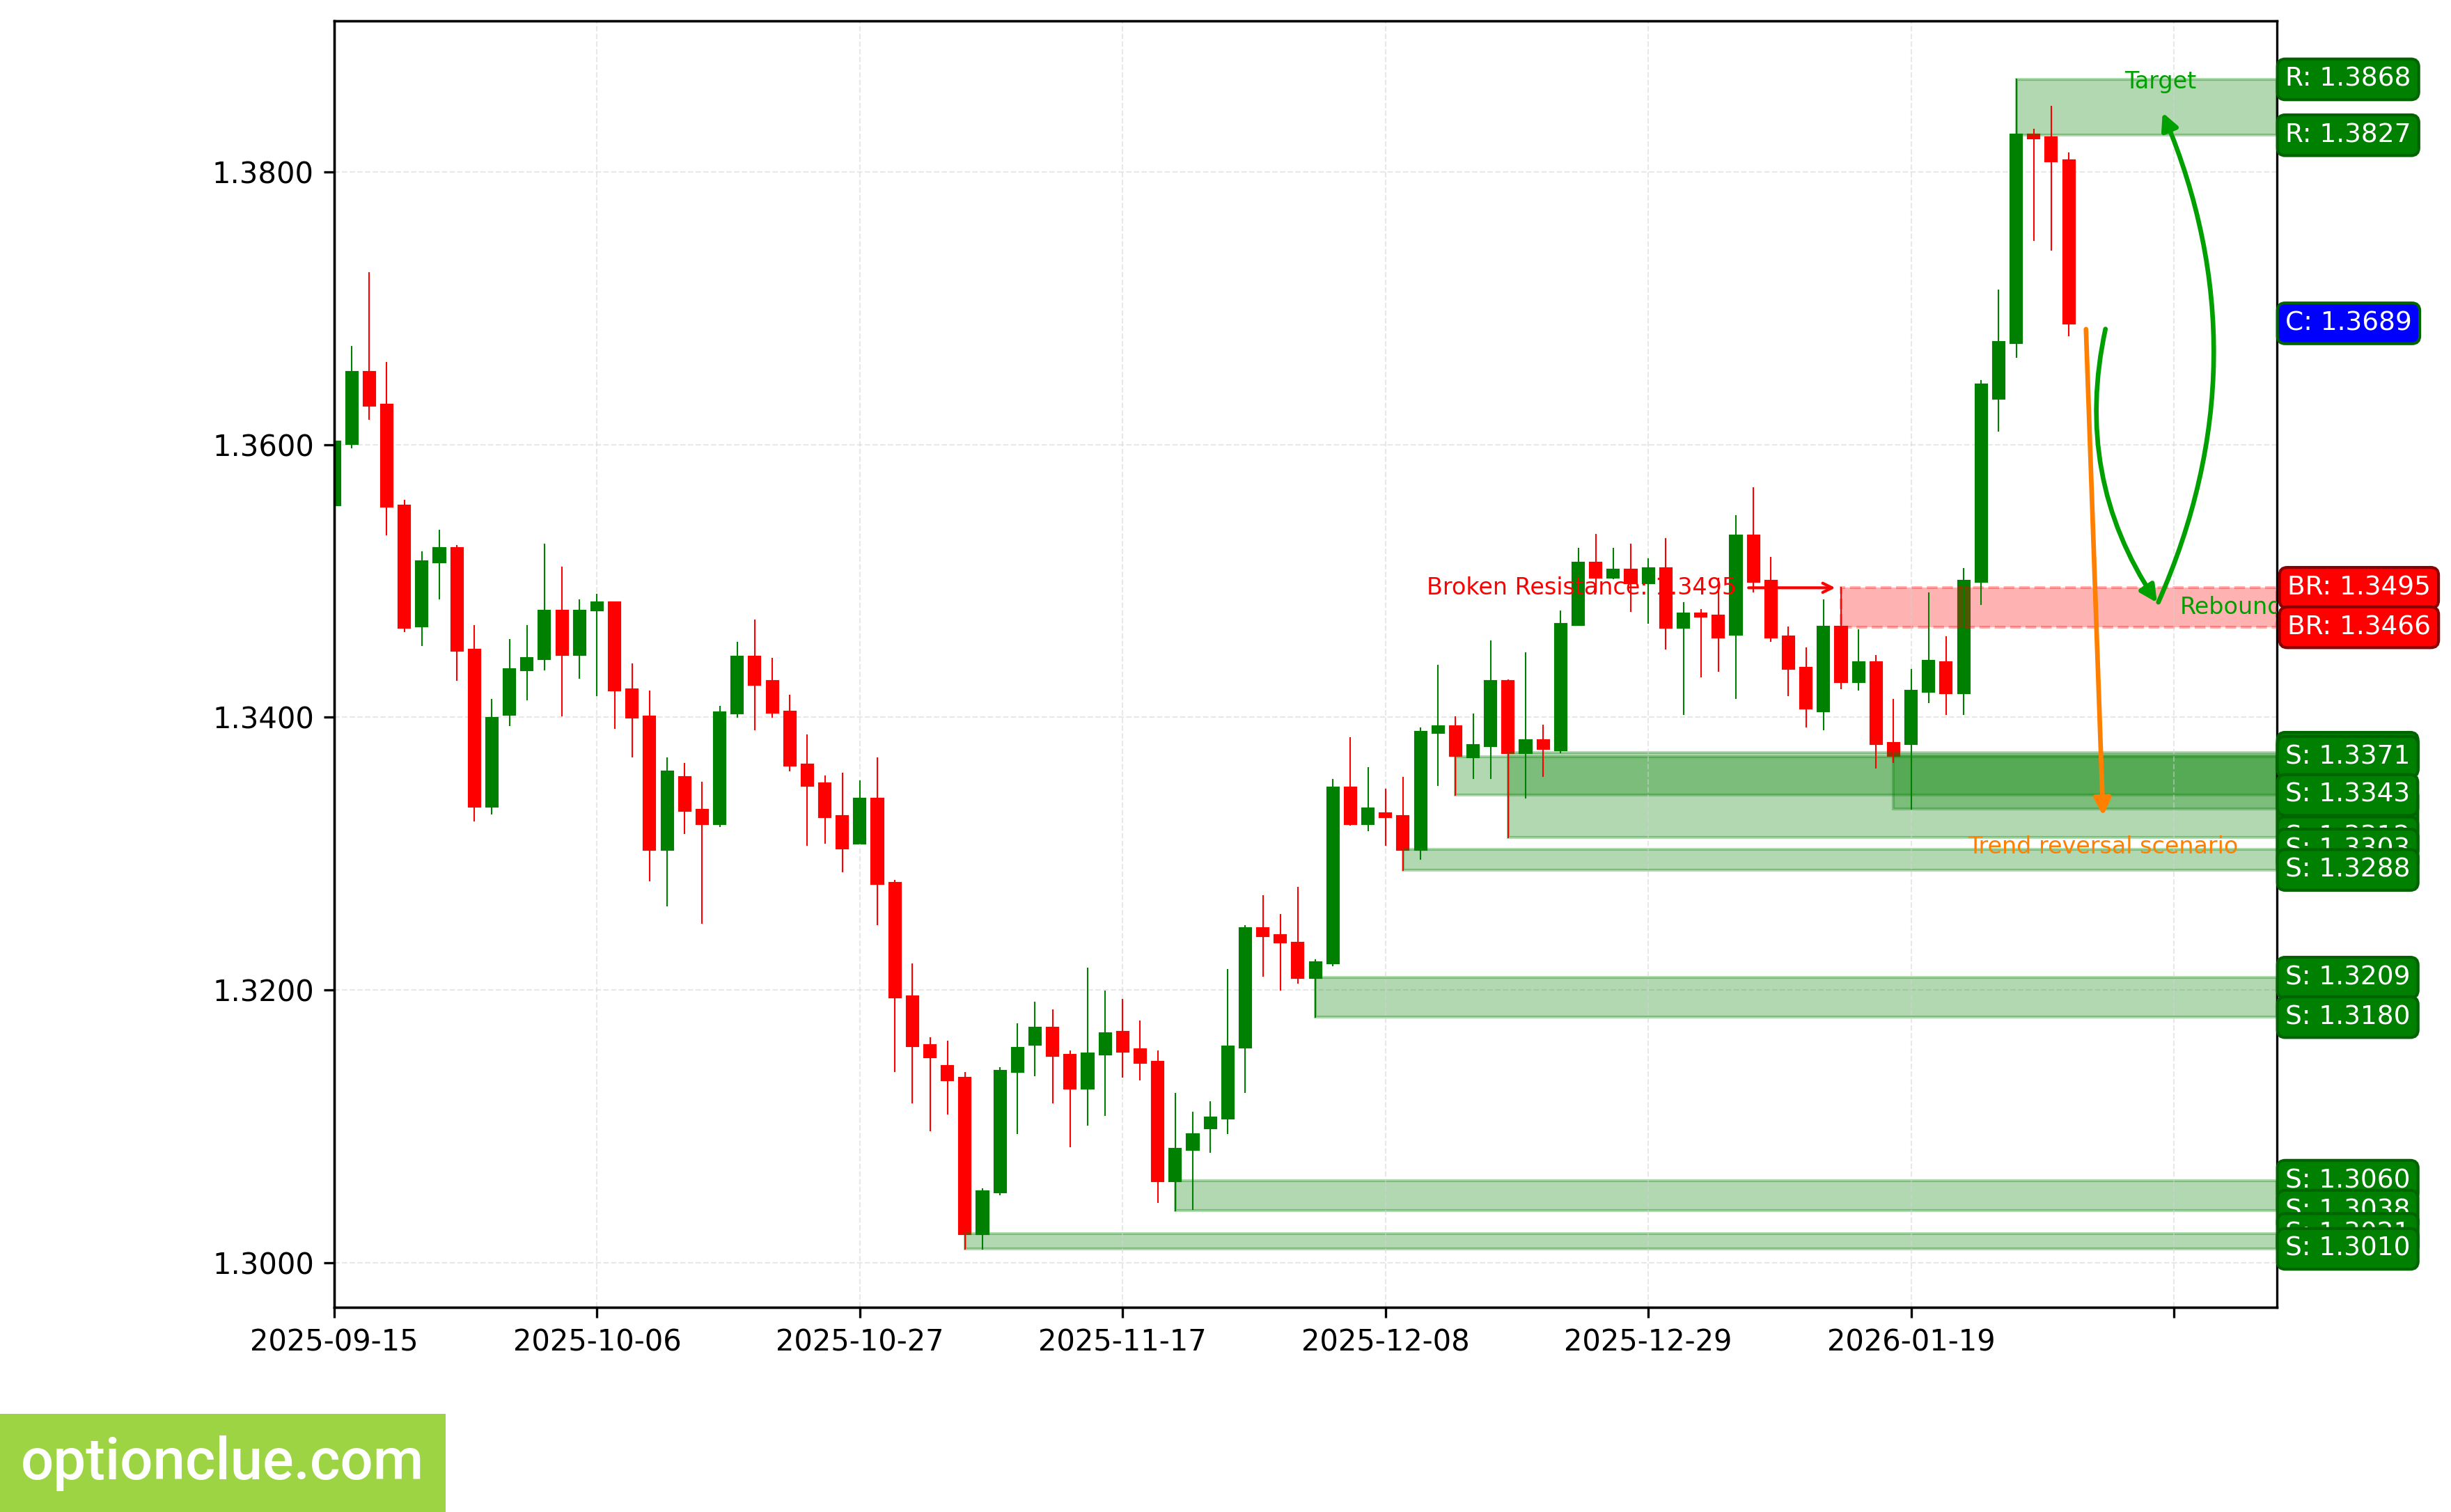
GBPUSD. Technical analysis. D1.
Japanese Yen (USDJPY)
Bearish trend continues, a corrective wave is developing. An entry point for selling on rebound may form after the current correction completes. The last broken level is support (157.98 — 157.98). The breakout occurred 6 candlesticks ago.
Intermediate target for the downward movement is the support level with boundaries 152.10 — 152.50. In case of successful trend development, a further target will be at the support level with boundaries 149.38 — 150.15.
The potential profit/risk ratio from current prices when setting targets and fixing risks based on daily timeframe levels may be small (about 0.4:1). When using a further target — also small (about 0.7:1). If the new correction completes near the resistance level (158.50 — 159.22), the potential profit/risk ratio could be about 3:1. For a further target — more than 4:1. If the next correction completes near the last broken level (157.98 — 157.98), the potential profit/risk ratio could be around 2:1. When selecting a further target — about 3:1.
Short positions will remain relevant, as long as the market remains below the nearest resistance level with boundaries 158.50 — 159.22. If the market successfully closes above this nearest resistance, the trend will reverse to the opposite (bullish).
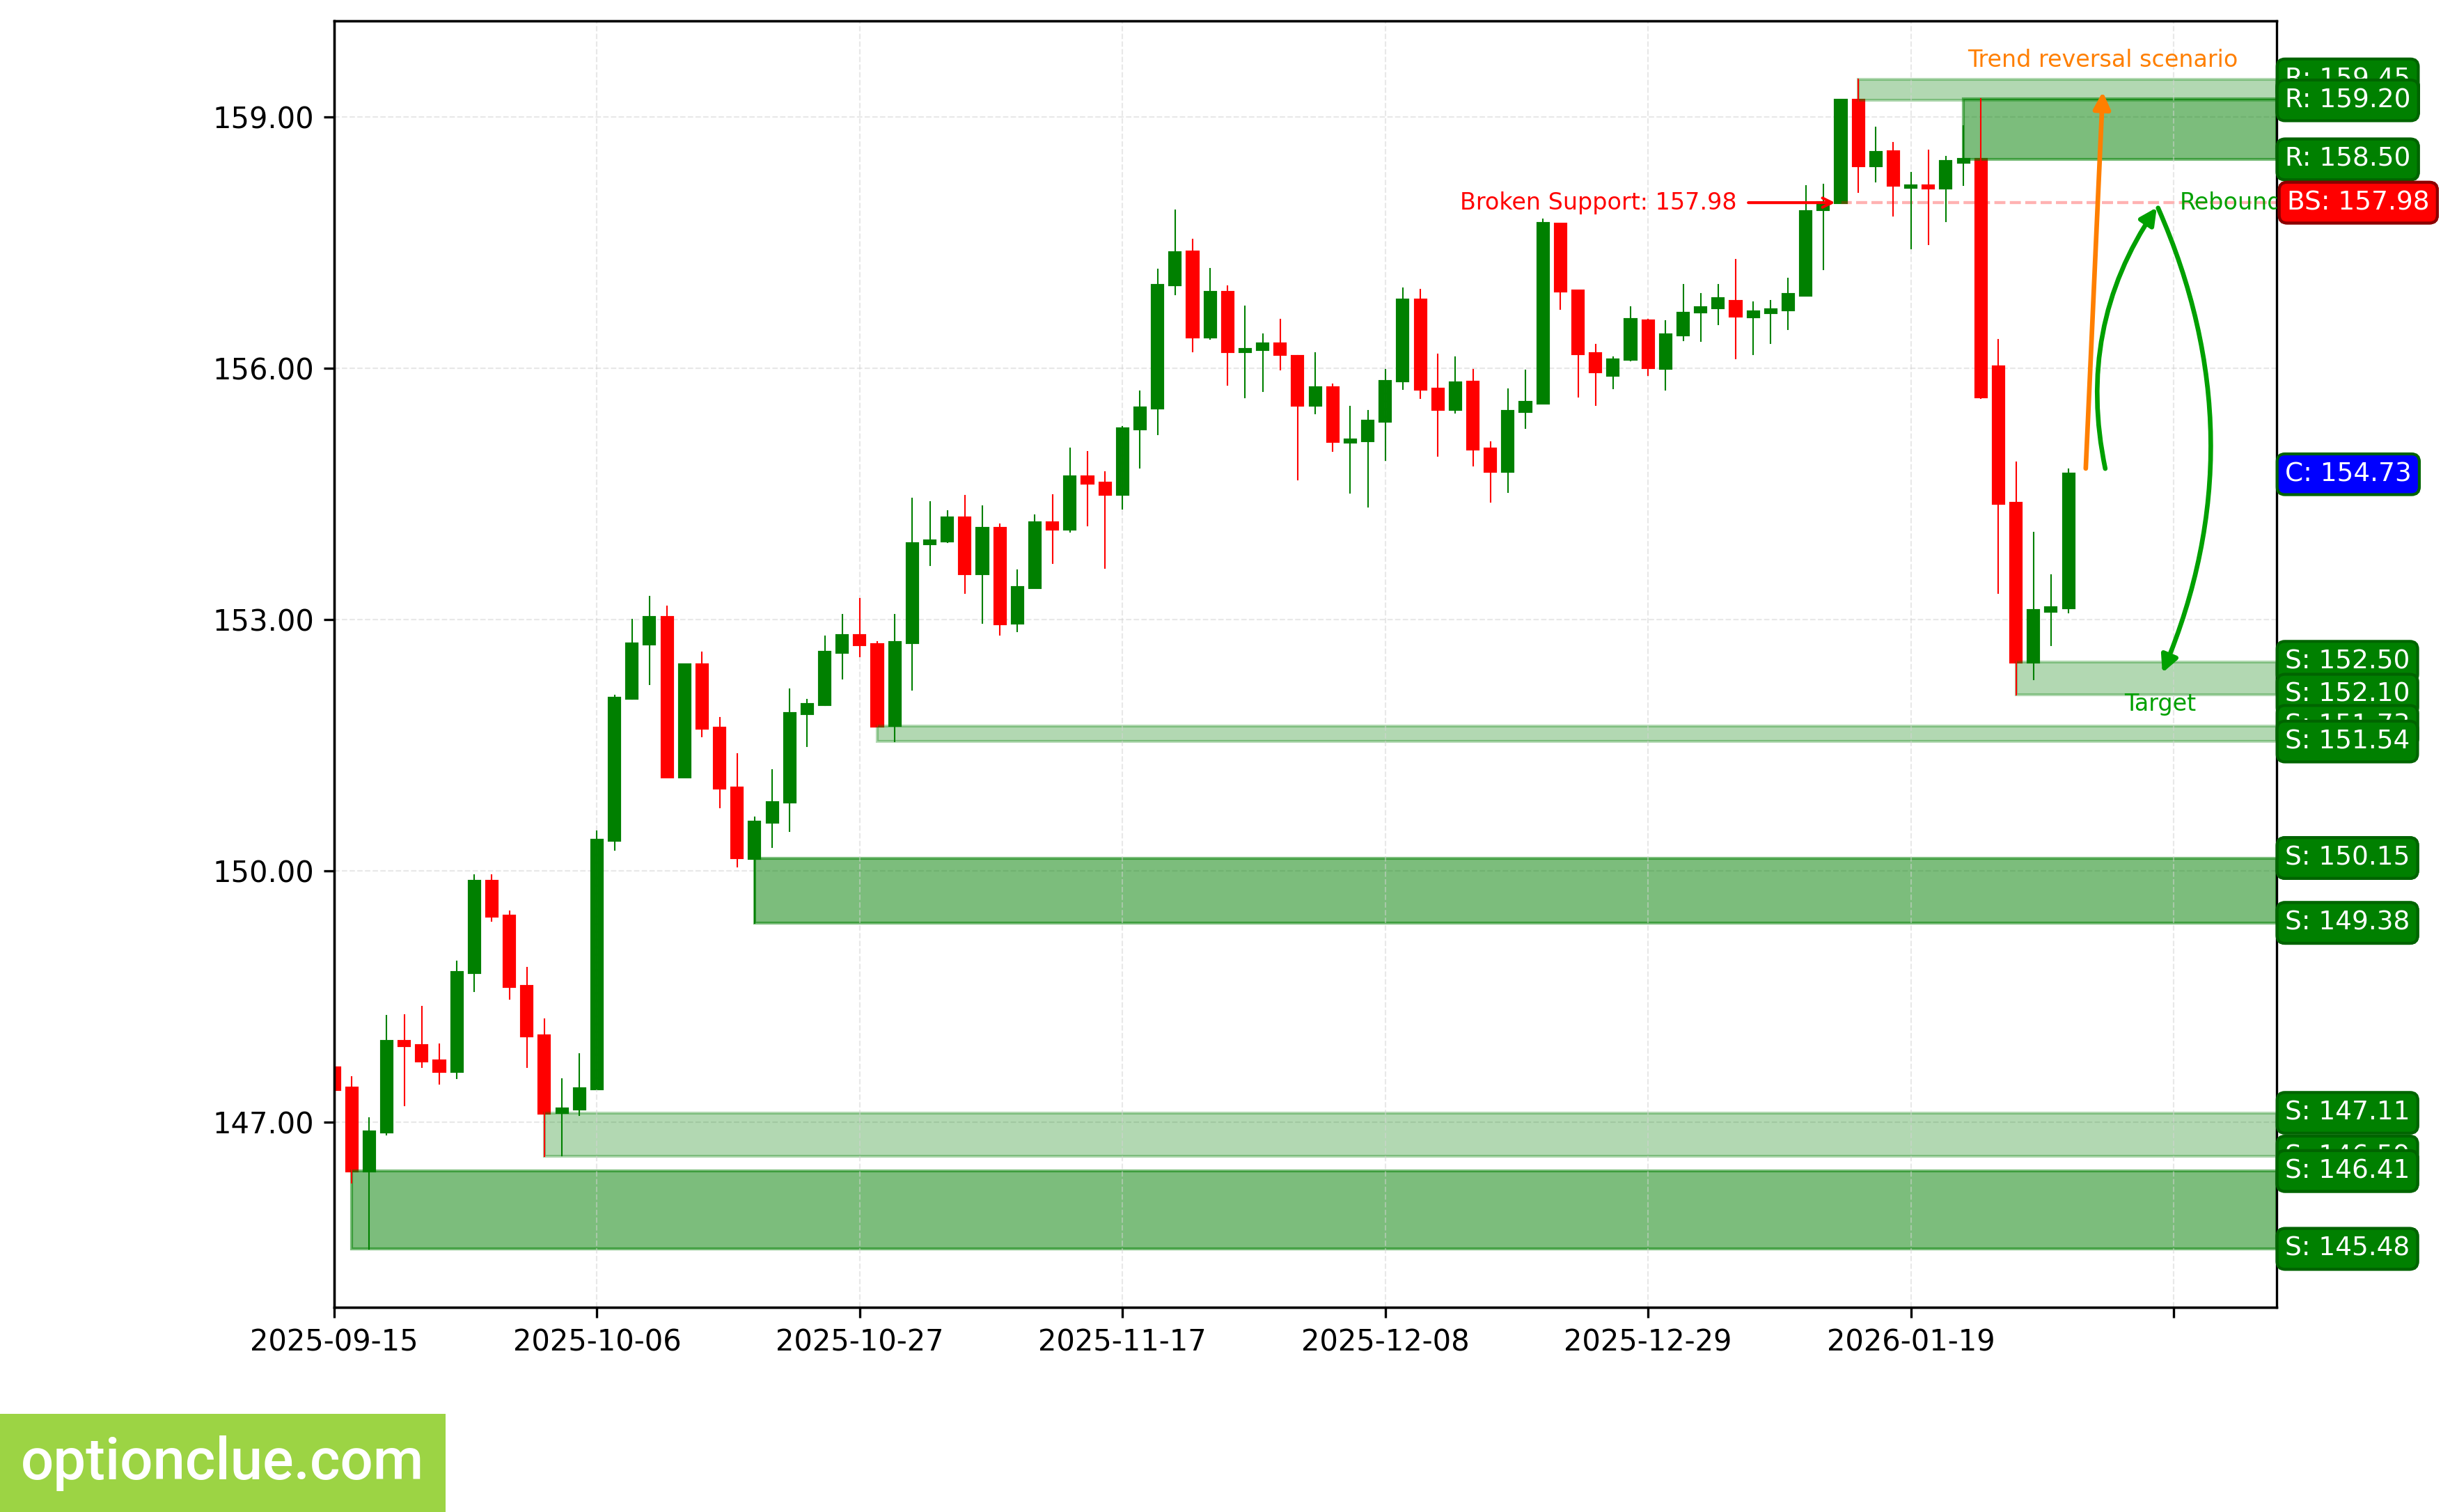
USDJPY. Technical analysis. D1.
Canadian Dollar (USDCAD)
Bearish trend continues, correction completed 7 candlesticks ago, impulse wave is developing. The last broken level is support (1.3854 — 1.3872). The breakout occurred 9 candlesticks ago.
Intermediate target for the downward movement is the support level with boundaries 1.3479 — 1.3490.
The potential profit/risk ratio from current prices when setting targets and fixing risks based on daily timeframe levels may be small (about 0.3:1).
Short positions will remain relevant, as long as the market remains below the nearest resistance level with boundaries 1.3916 — 1.3928. If the market successfully closes above this nearest resistance, the trend will reverse to the opposite (bullish).
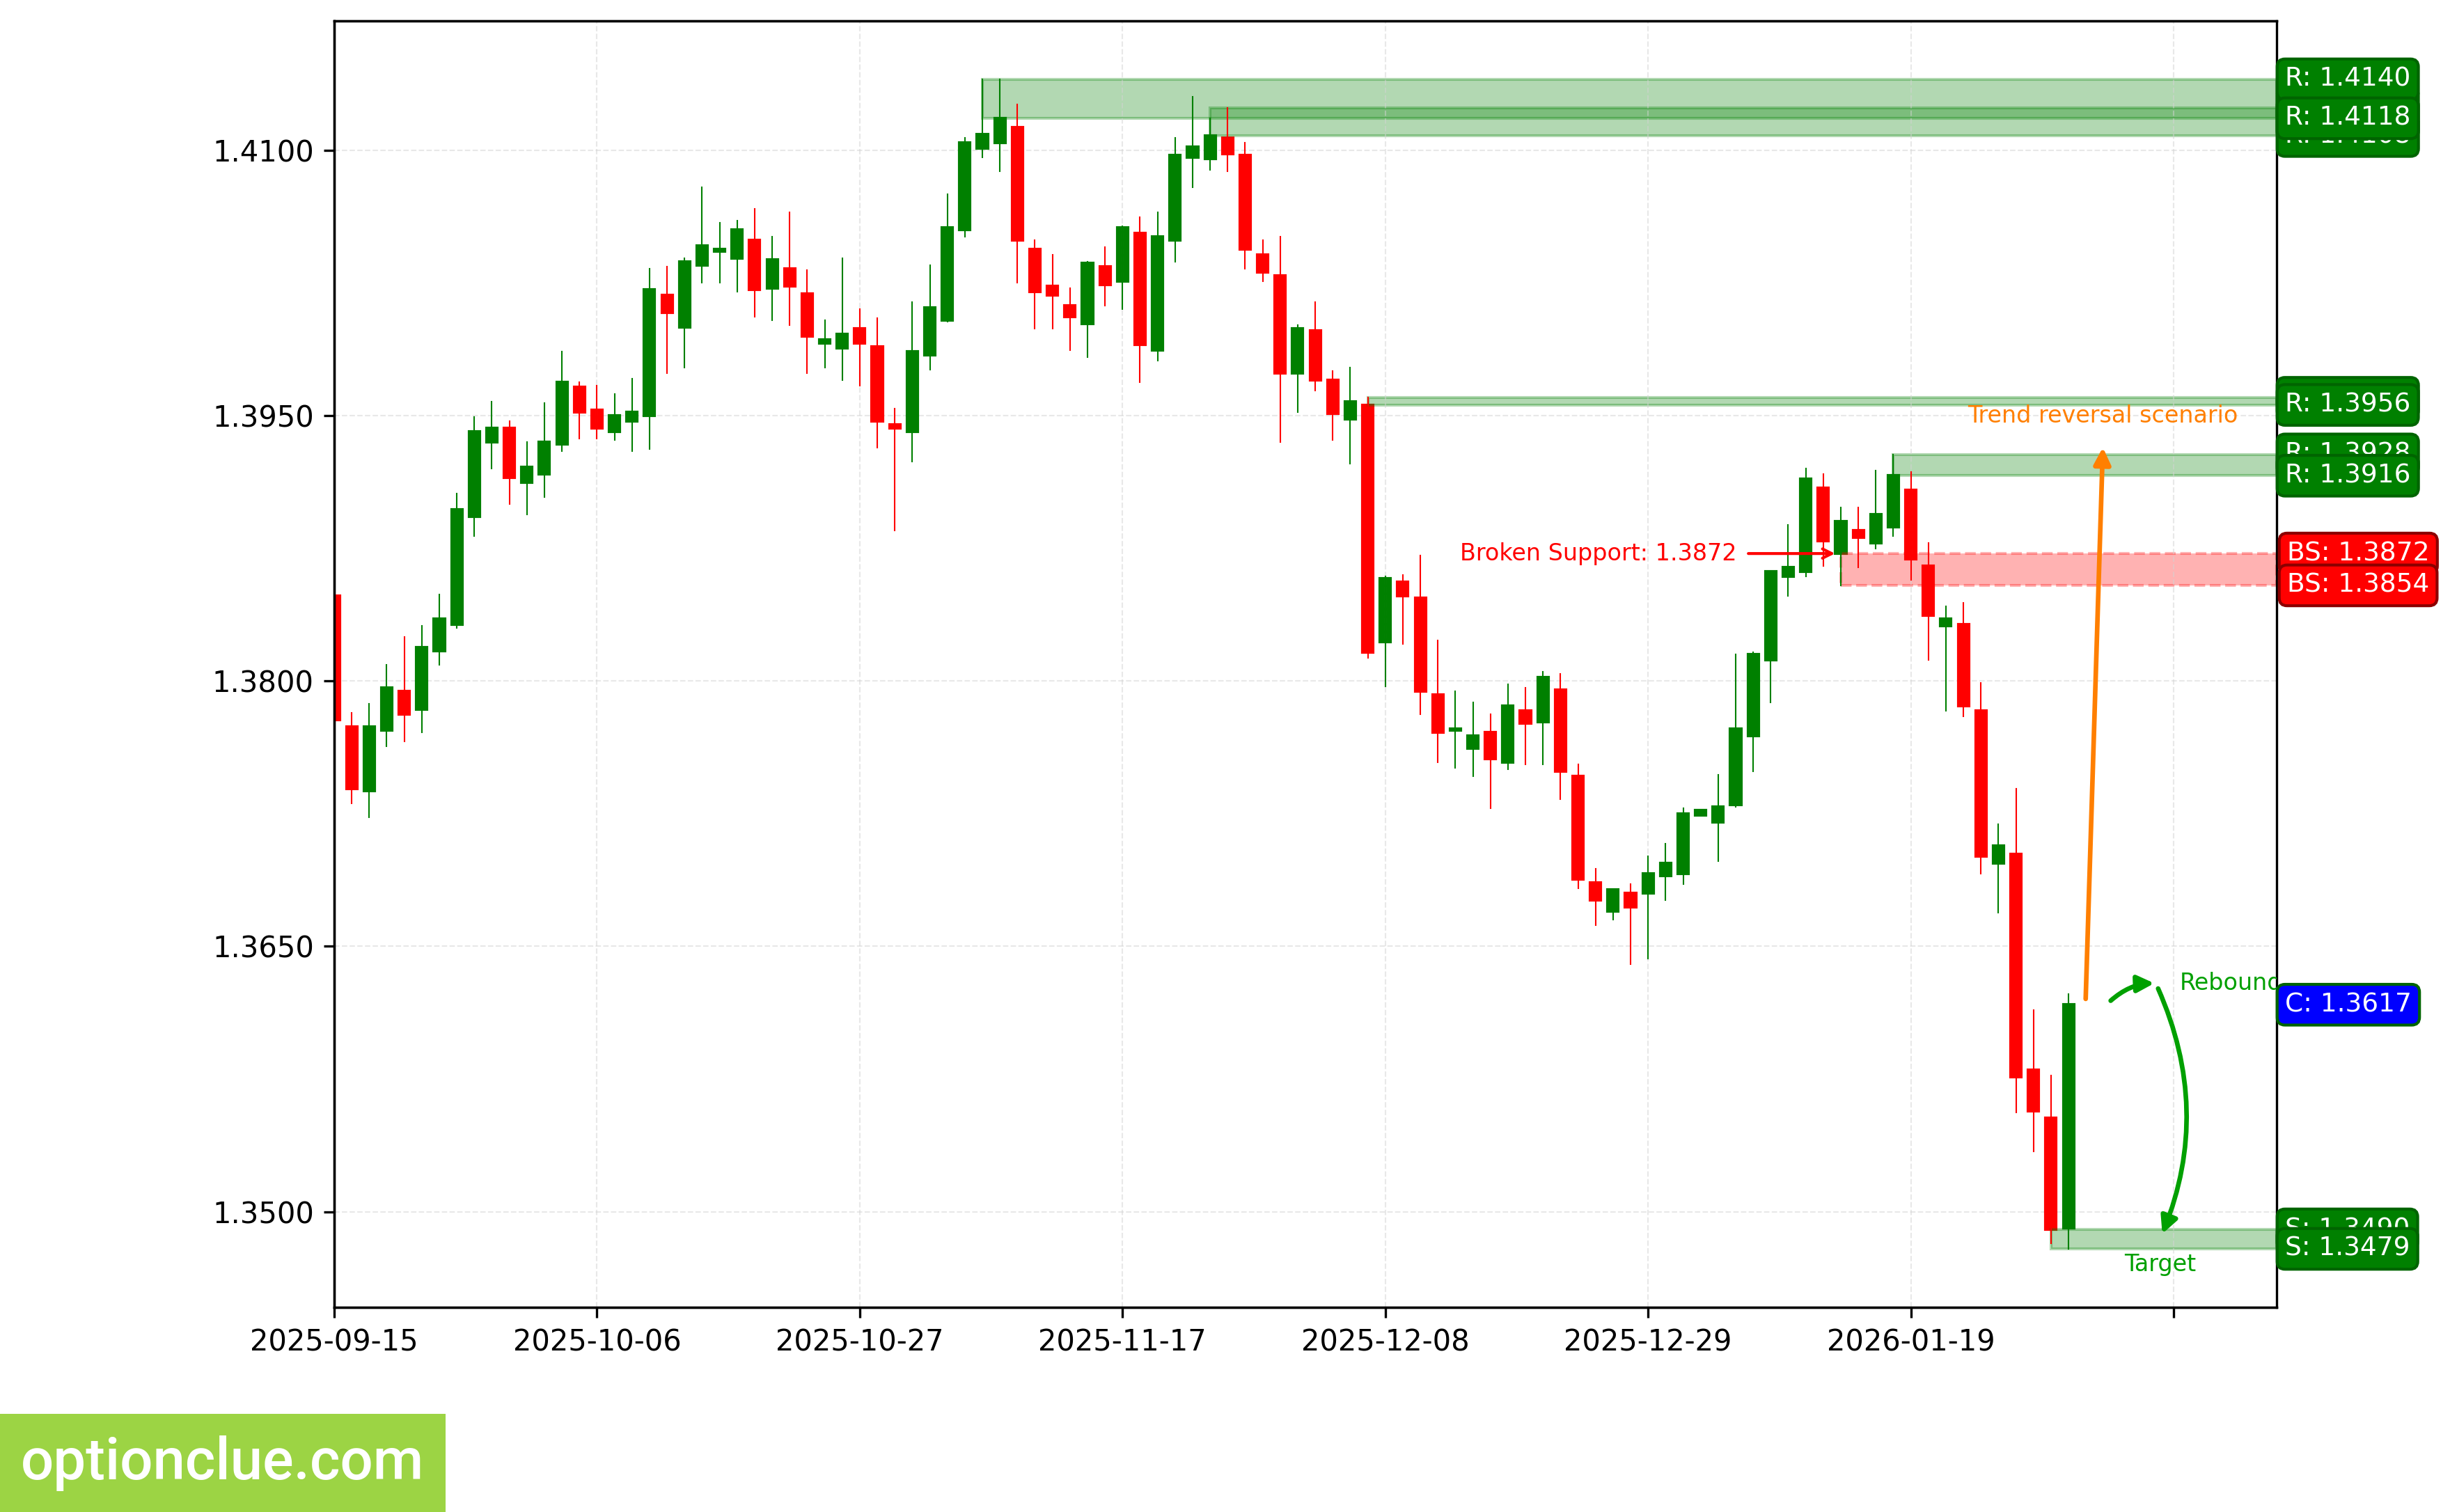
USDCAD. Technical analysis. D1.
Australian Dollar (AUDUSD)
Bullish trend continues, a corrective wave is developing. An entry point for buying on rebound may form after the current correction completes. The last broken level is resistance (0.6711 — 0.6725). The breakout occurred 9 candlesticks ago.
Intermediate target for the upward movement is the resistance level with boundaries 0.7049 — 0.7094.
The potential profit/risk ratio from current prices when setting targets and fixing risks based on daily timeframe levels may be small (about 0.2:1). If the next correction completes near the support level (0.6665 — 0.6679), the potential profit/risk ratio could be more than 4:1. If the next correction completes near the last broken level (0.6711 — 0.6725), the potential profit/risk ratio could be more than 2:1.
Long positions will remain relevant, as long as the market is above the nearest support level with boundaries 0.6665 — 0.6679. If the market successfully closes below this support, the trend will reverse to the opposite (bearish).
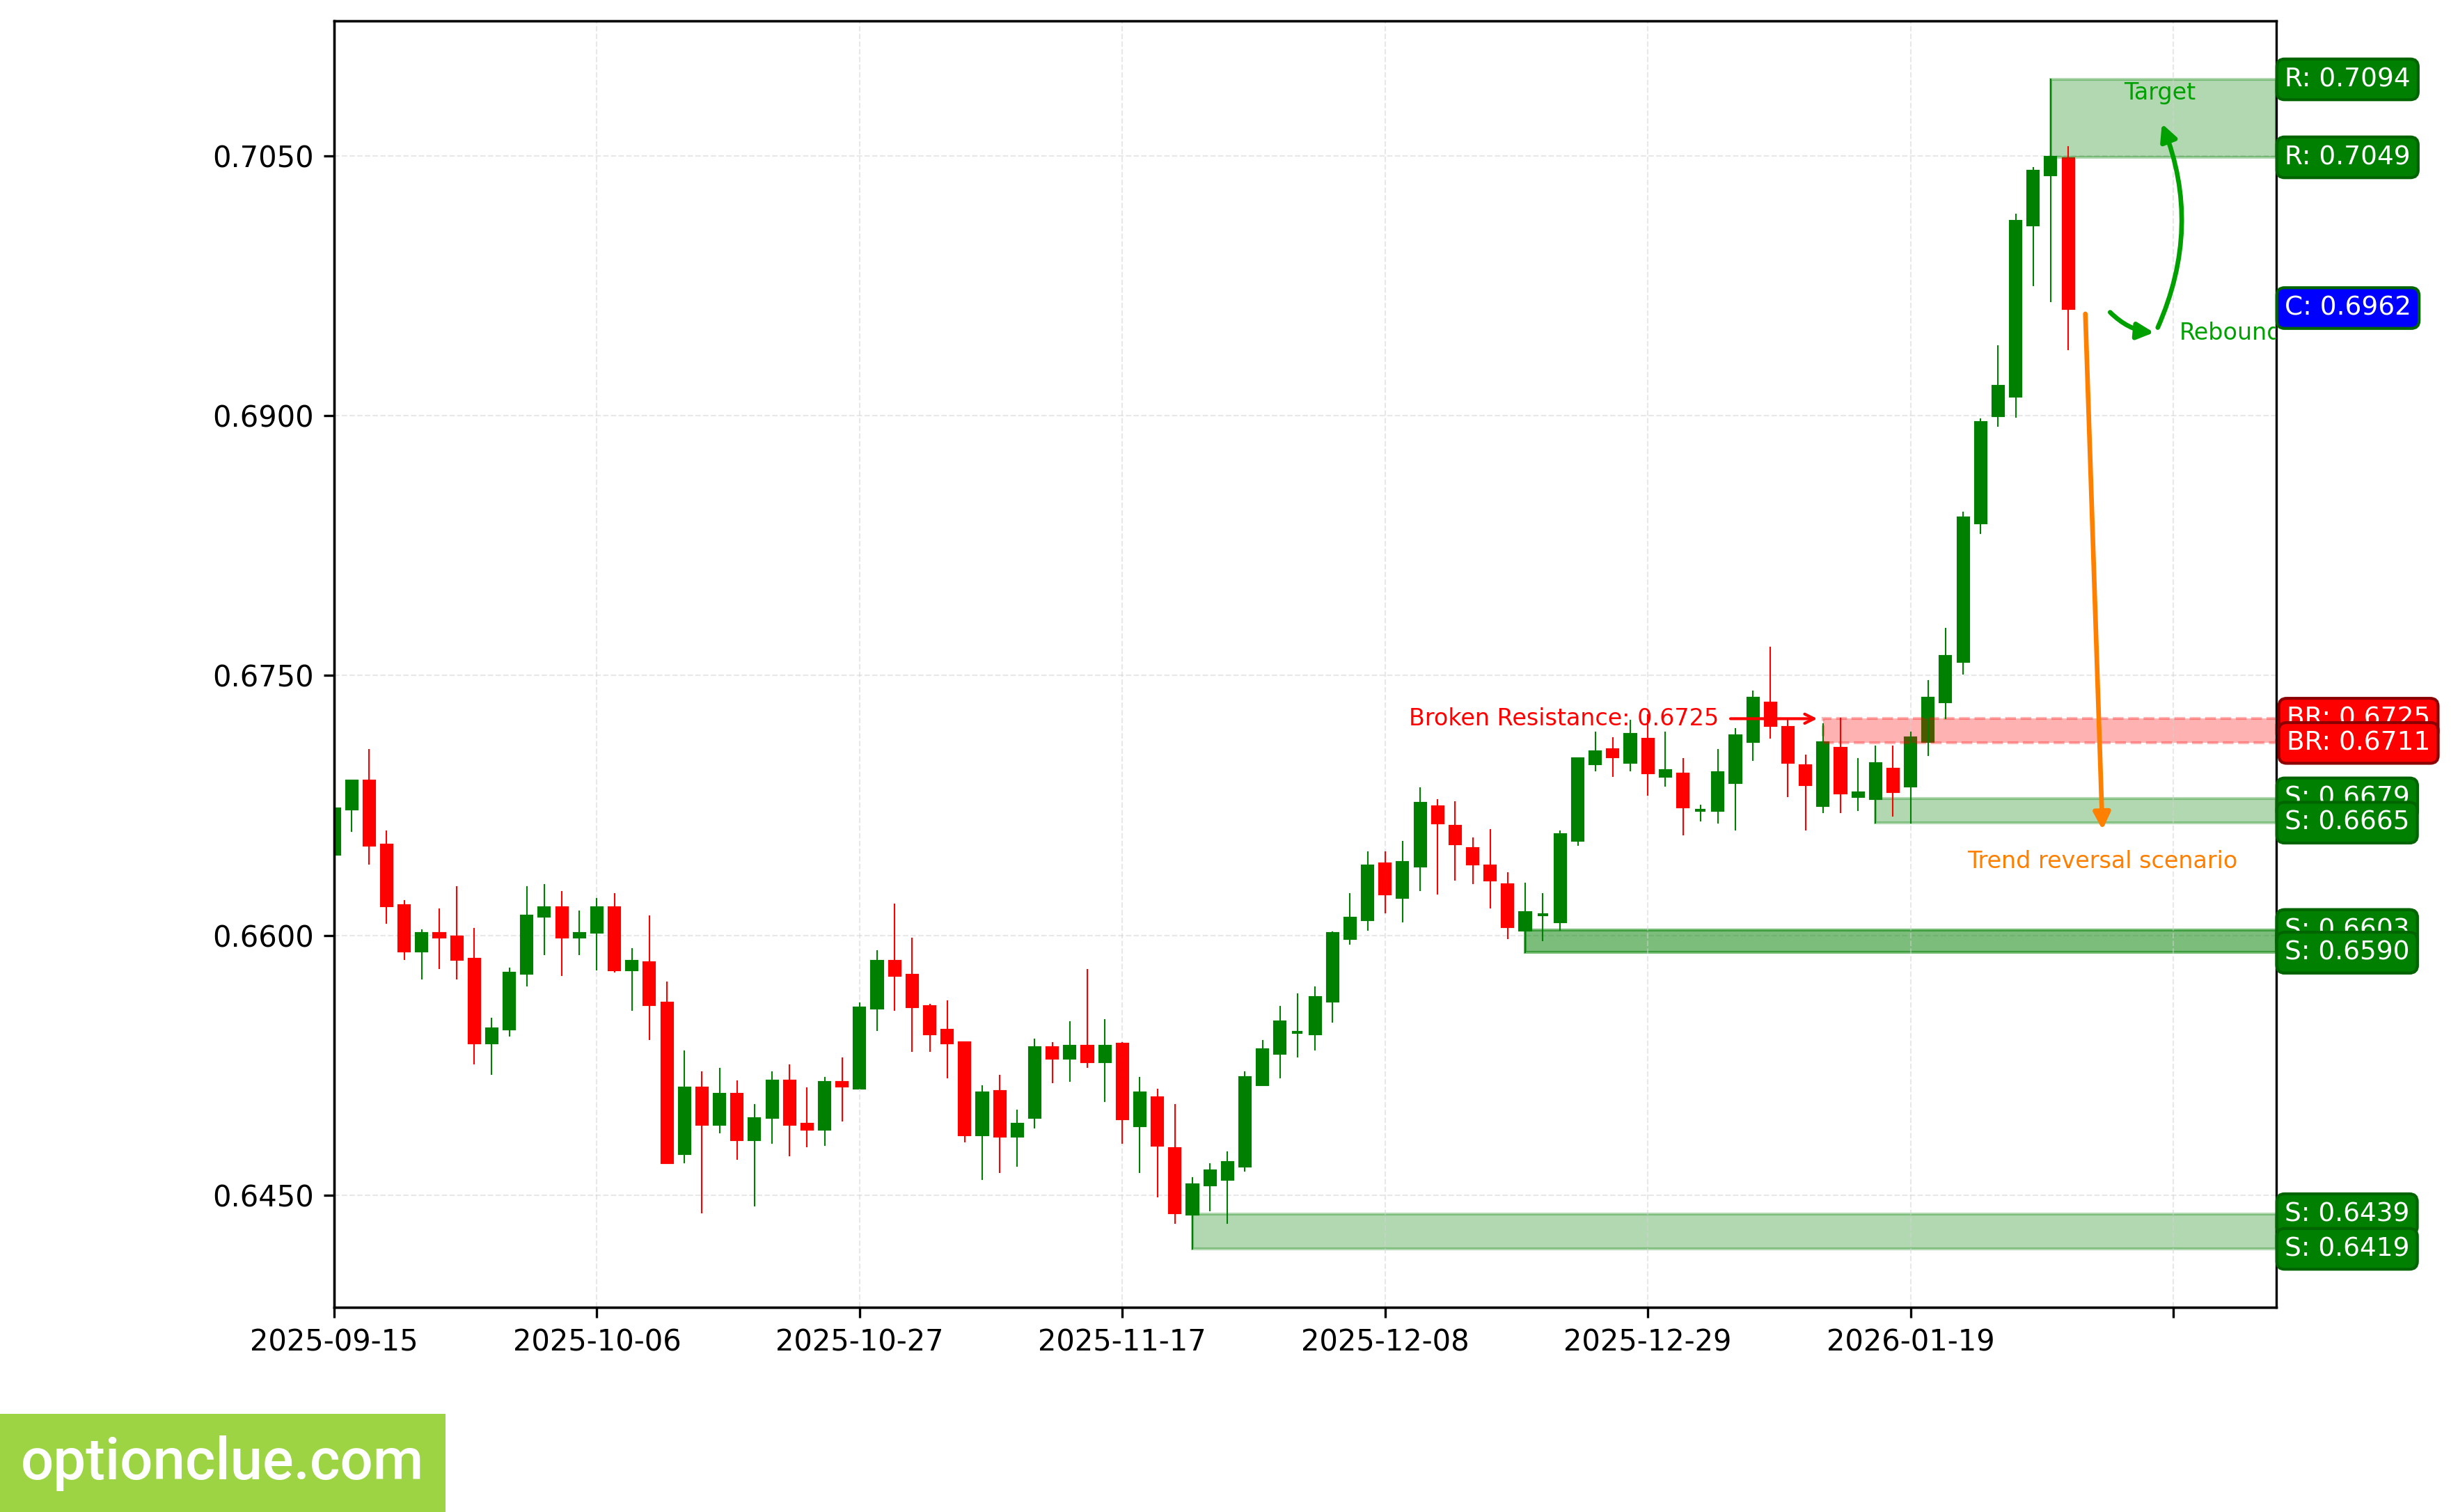
AUDUSD. Technical analysis. D1.
New Zealand Dollar (NZDUSD)
Bullish trend continues, a corrective wave is developing. An entry point for buying on rebound may form after the current correction completes. The last broken level is resistance (0.5788 — 0.5810). The breakout occurred 9 candlesticks ago.
Intermediate target for the upward movement is the resistance level with boundaries 0.6097 — 0.6120. In case of successful trend development, a further target will be at the resistance level with boundaries 0.6344 — 0.6379.
The potential profit/risk ratio from current prices when setting targets and fixing risks based on daily timeframe levels may be small (about 0.2:1). When using a further target — also small (about 0.9:1). If the next correction completes near the support level (0.5724 — 0.5738), the potential profit/risk ratio could be about 5:1. When selecting a further target — more than 8:1. If the next correction completes near the last broken level (0.5788 — 0.5810), the potential profit/risk ratio could be about 2:1. For a further target — around 4:1.
Long positions will remain relevant, as long as the market is above the nearest support level with boundaries 0.5724 — 0.5738. If the market successfully closes below this support, the trend will reverse to the opposite (bearish).
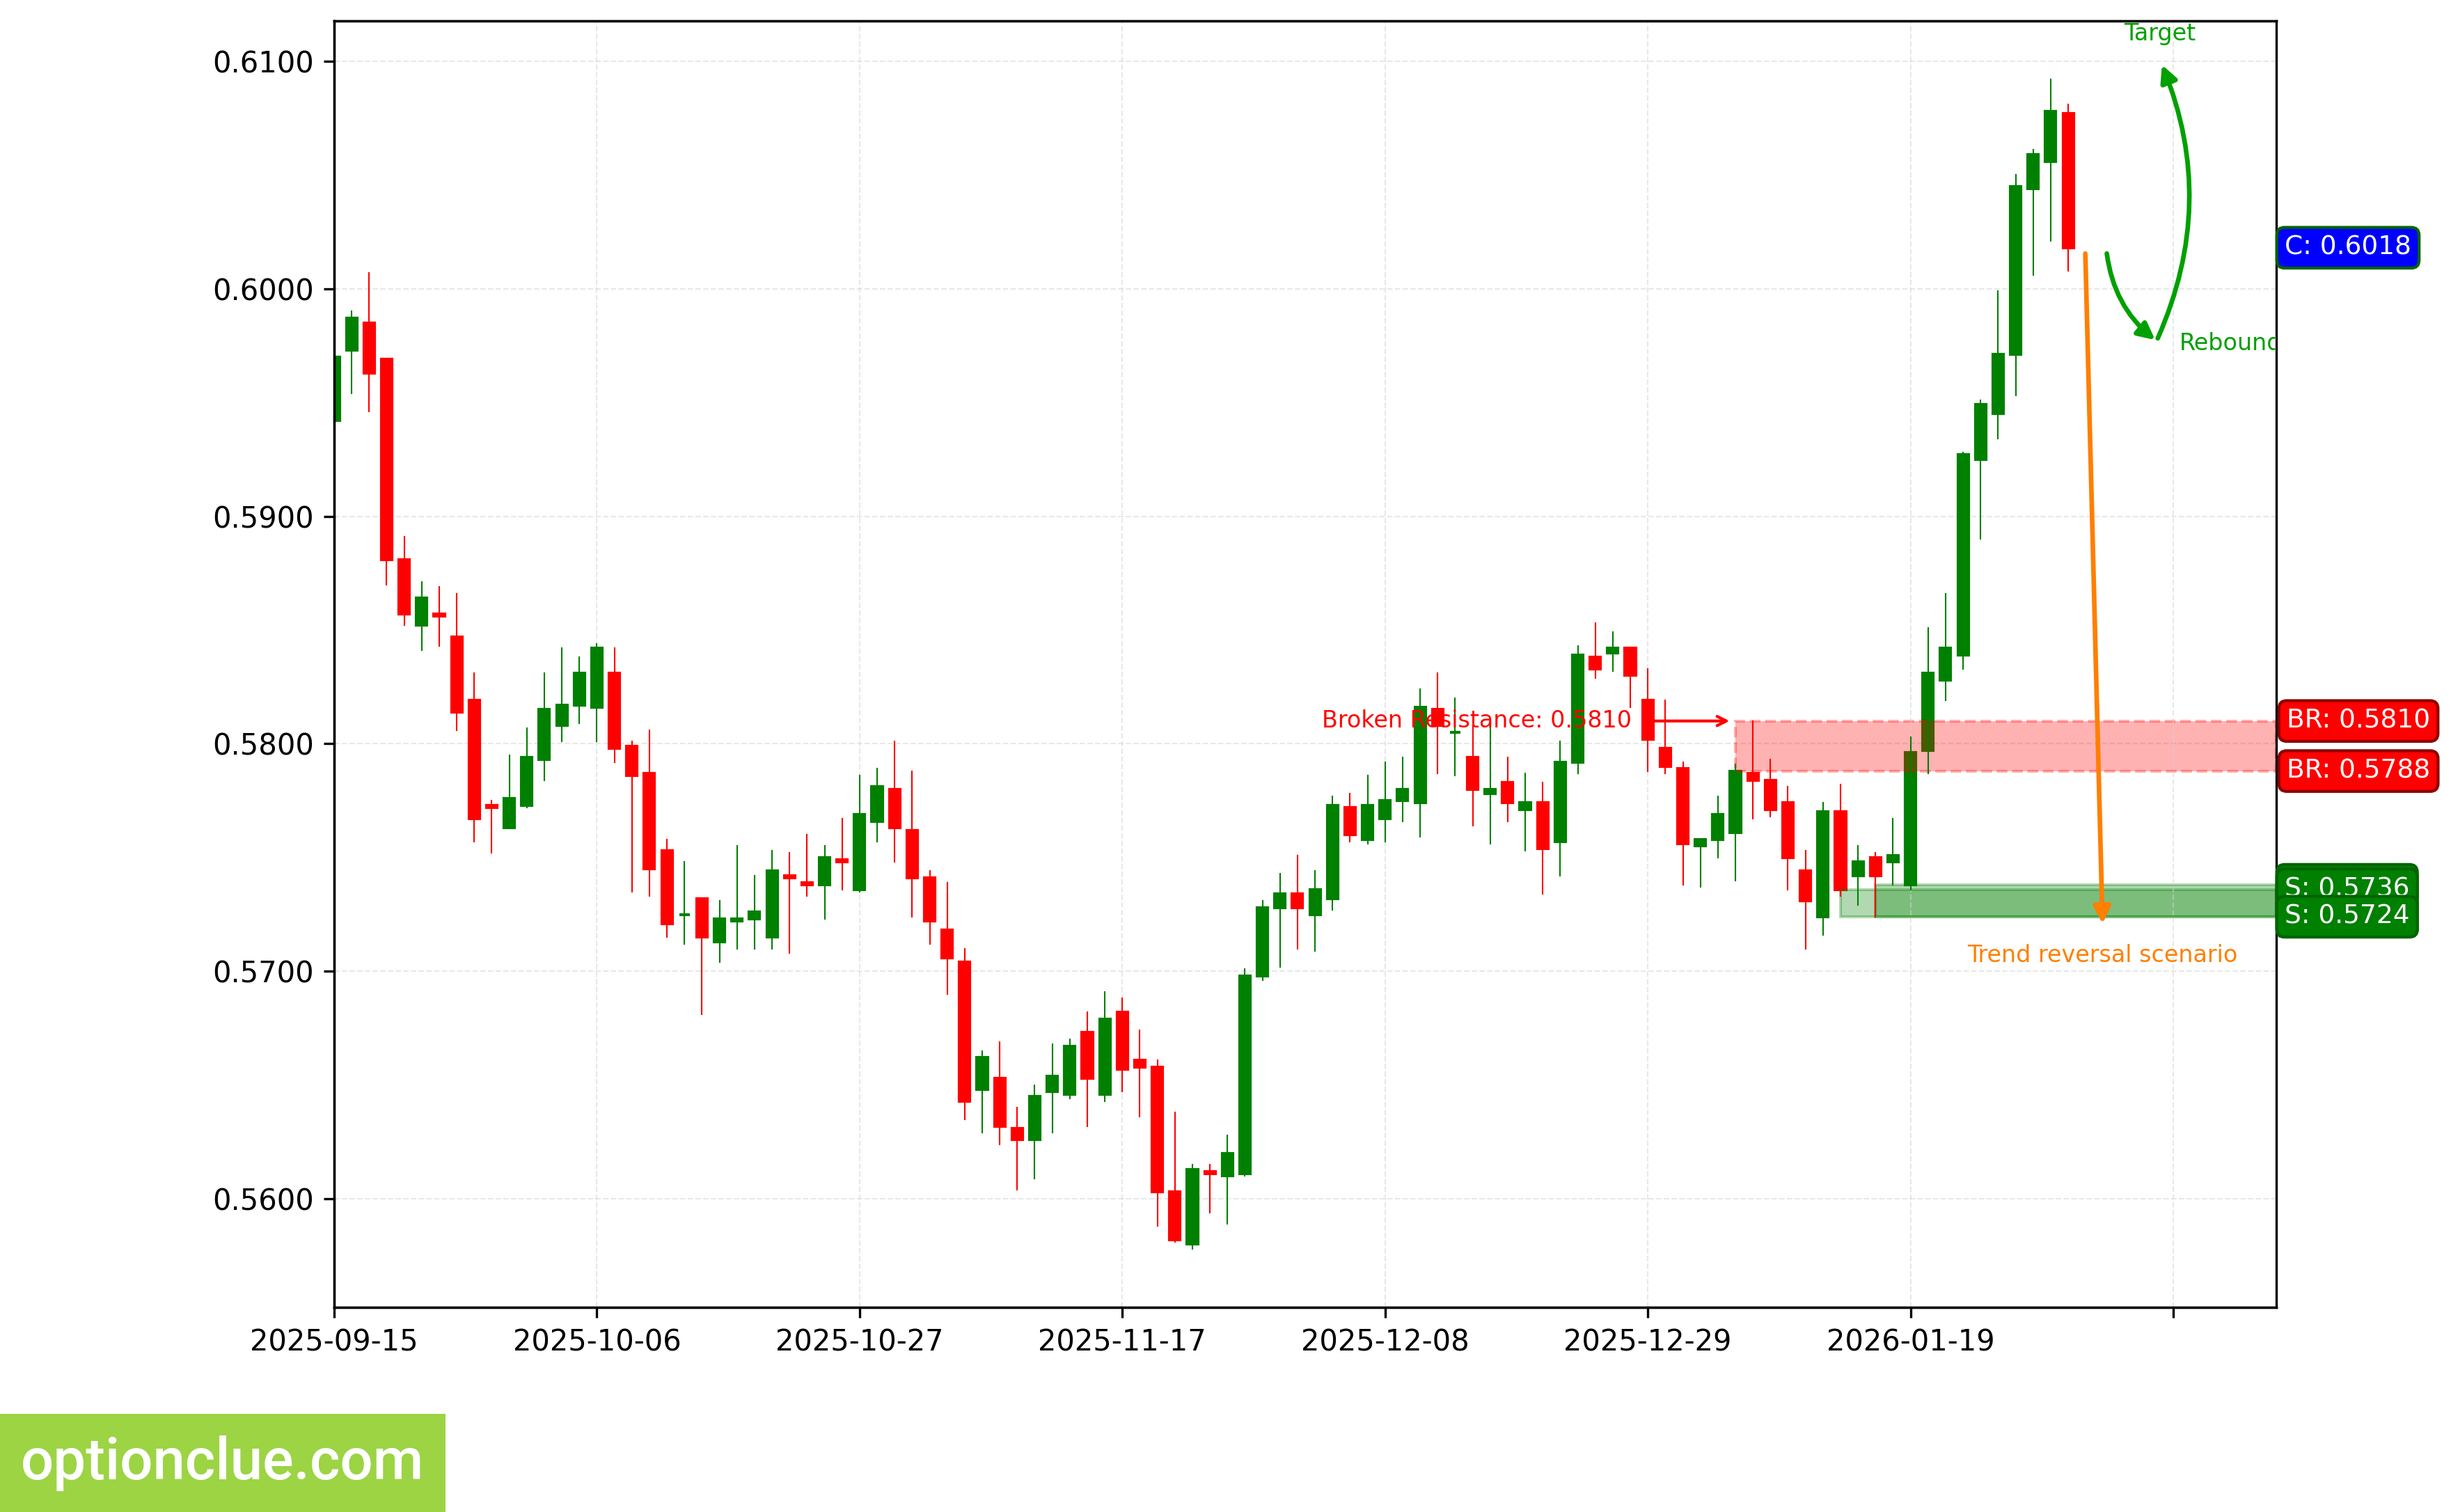
NZDUSD. Technical analysis. D1.
Bitcoin (BTC)
Bearish trend continues, an impulse wave is developing. An entry point for selling on rebound may form after a full correction forms. The last broken level is support (86004 — 86567). The breakout occurred 3 candlesticks ago.
Intermediate target for the downward movement is the support level with boundaries 74437 — 76272.
If the next correction completes near the resistance level (89185 — 90439), the potential profit/risk ratio could be about 3.5:1. If the correction completes near the last broken level (86004 — 86567), the potential profit/risk ratio could be around 1.4:1.
Short positions will remain relevant, as long as the market remains below the nearest resistance level with boundaries 89185 — 90439. If the market successfully closes above this nearest resistance, the trend will reverse to the opposite (bullish).
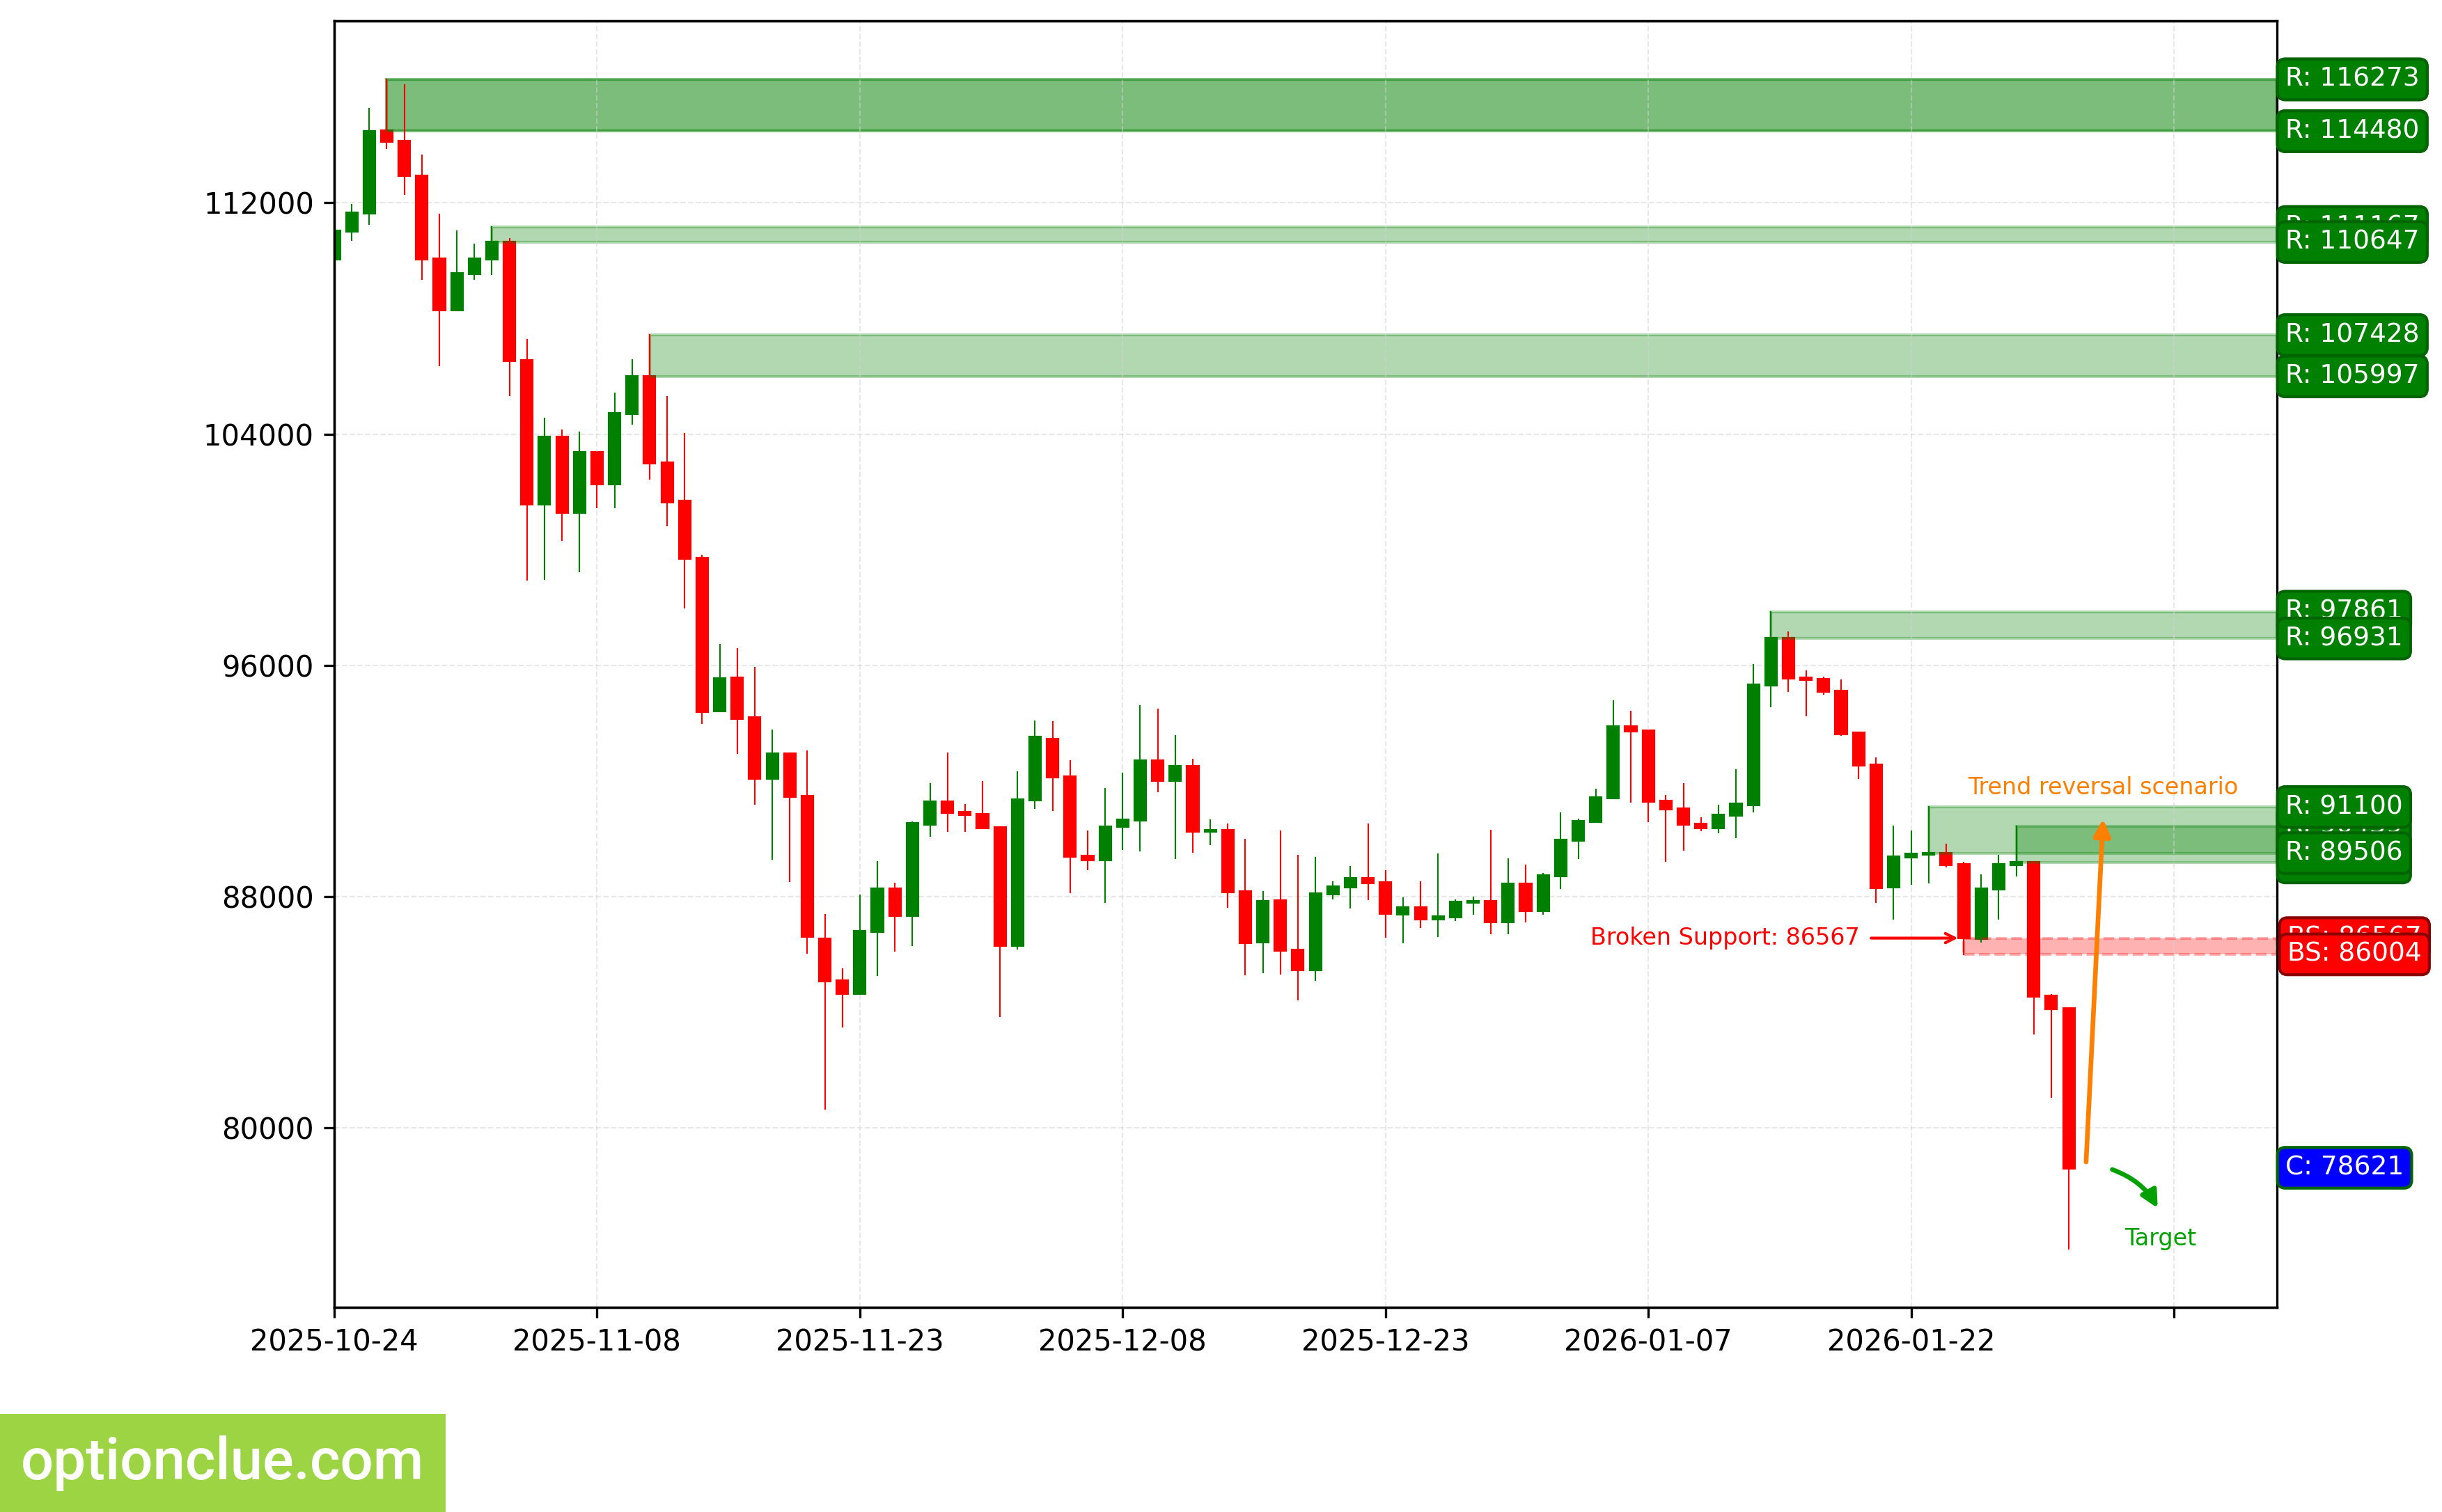
BTC. Technical analysis. D1.
Ether (ETH)
Trend has turned bearish, when the support level (2786 — 2816) was broken 2 candlesticks ago. An impulse wave is developing.
Intermediate target for the downward movement is the support level with boundaries 2378 — 2406. In case of successful trend development, a further target will be at the support level with boundaries 1753 — 1812.
If the new correction completes near the resistance level (3022 — 3041), the potential profit/risk ratio could be around 3.4:1. When using a further target — around 6.7:1. If the next correction completes near the last broken level (2786 — 2816), the potential profit/risk ratio could be around 1:1. When selecting a further target — about 2.4:1.
Short positions will remain relevant, as long as the market remains below the nearest resistance level with boundaries 3022 — 3041. If the market successfully closes above this nearest resistance, the trend will reverse to the opposite (bullish).
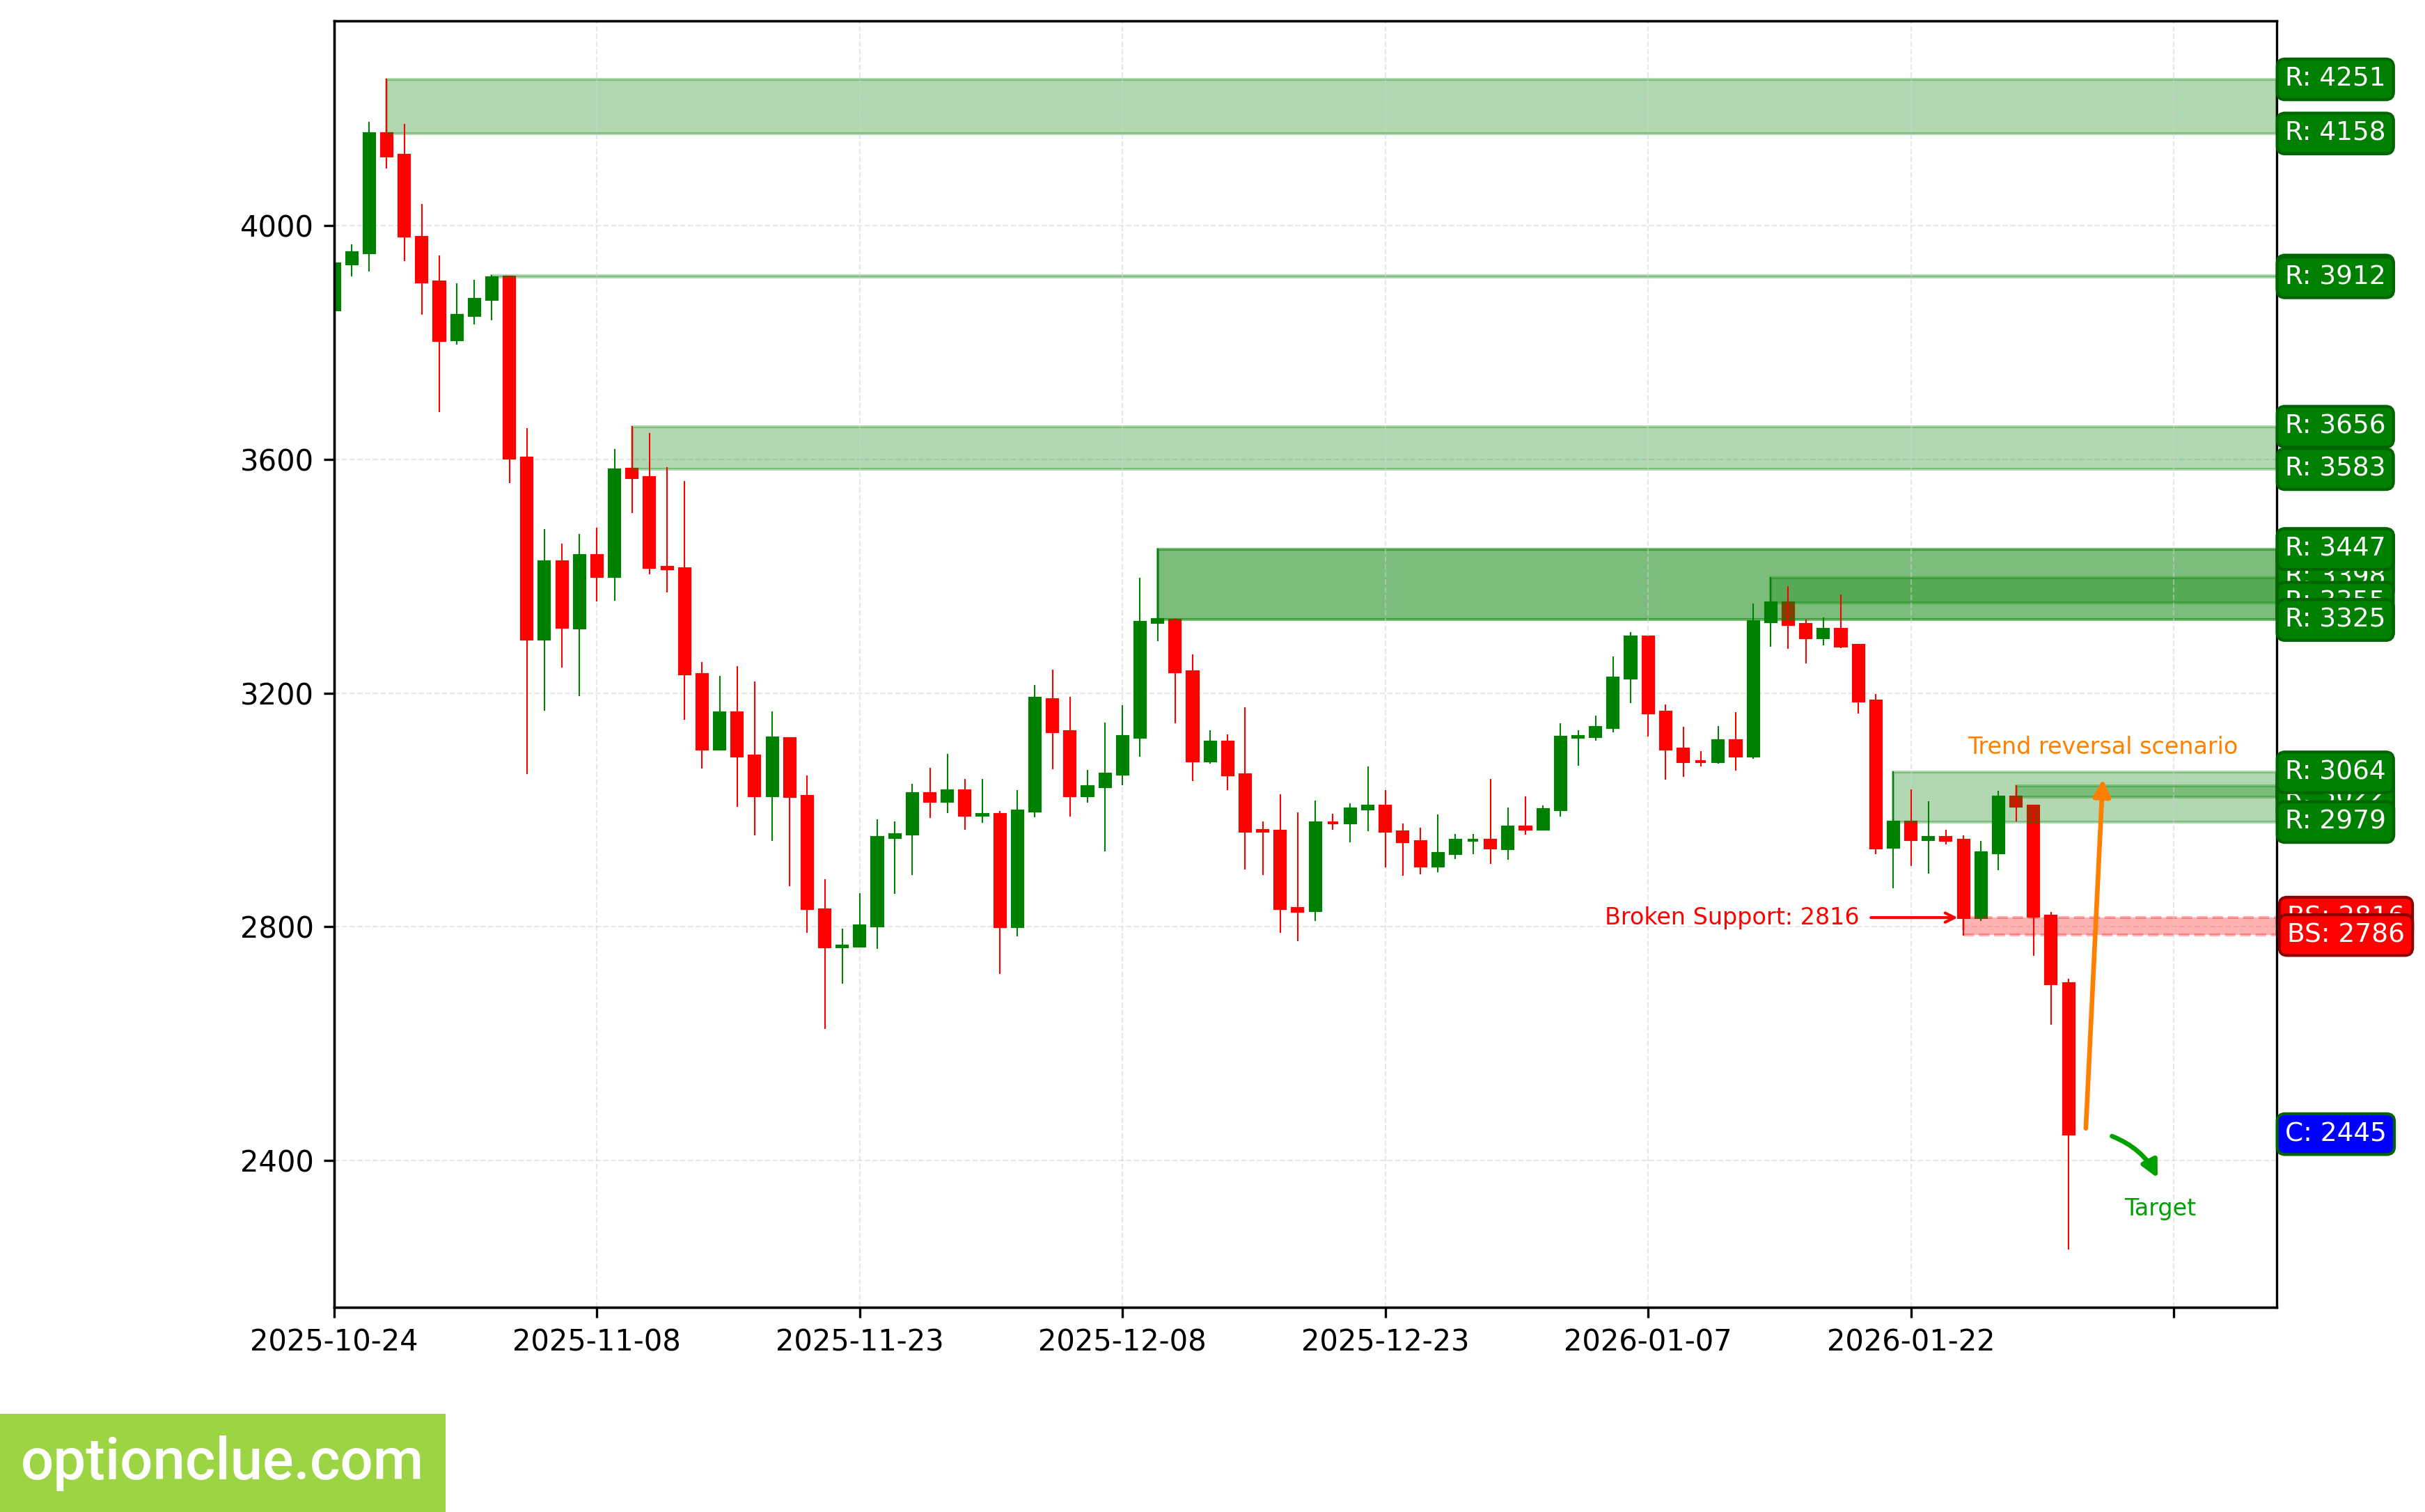
ETH. Technical analysis. D1.
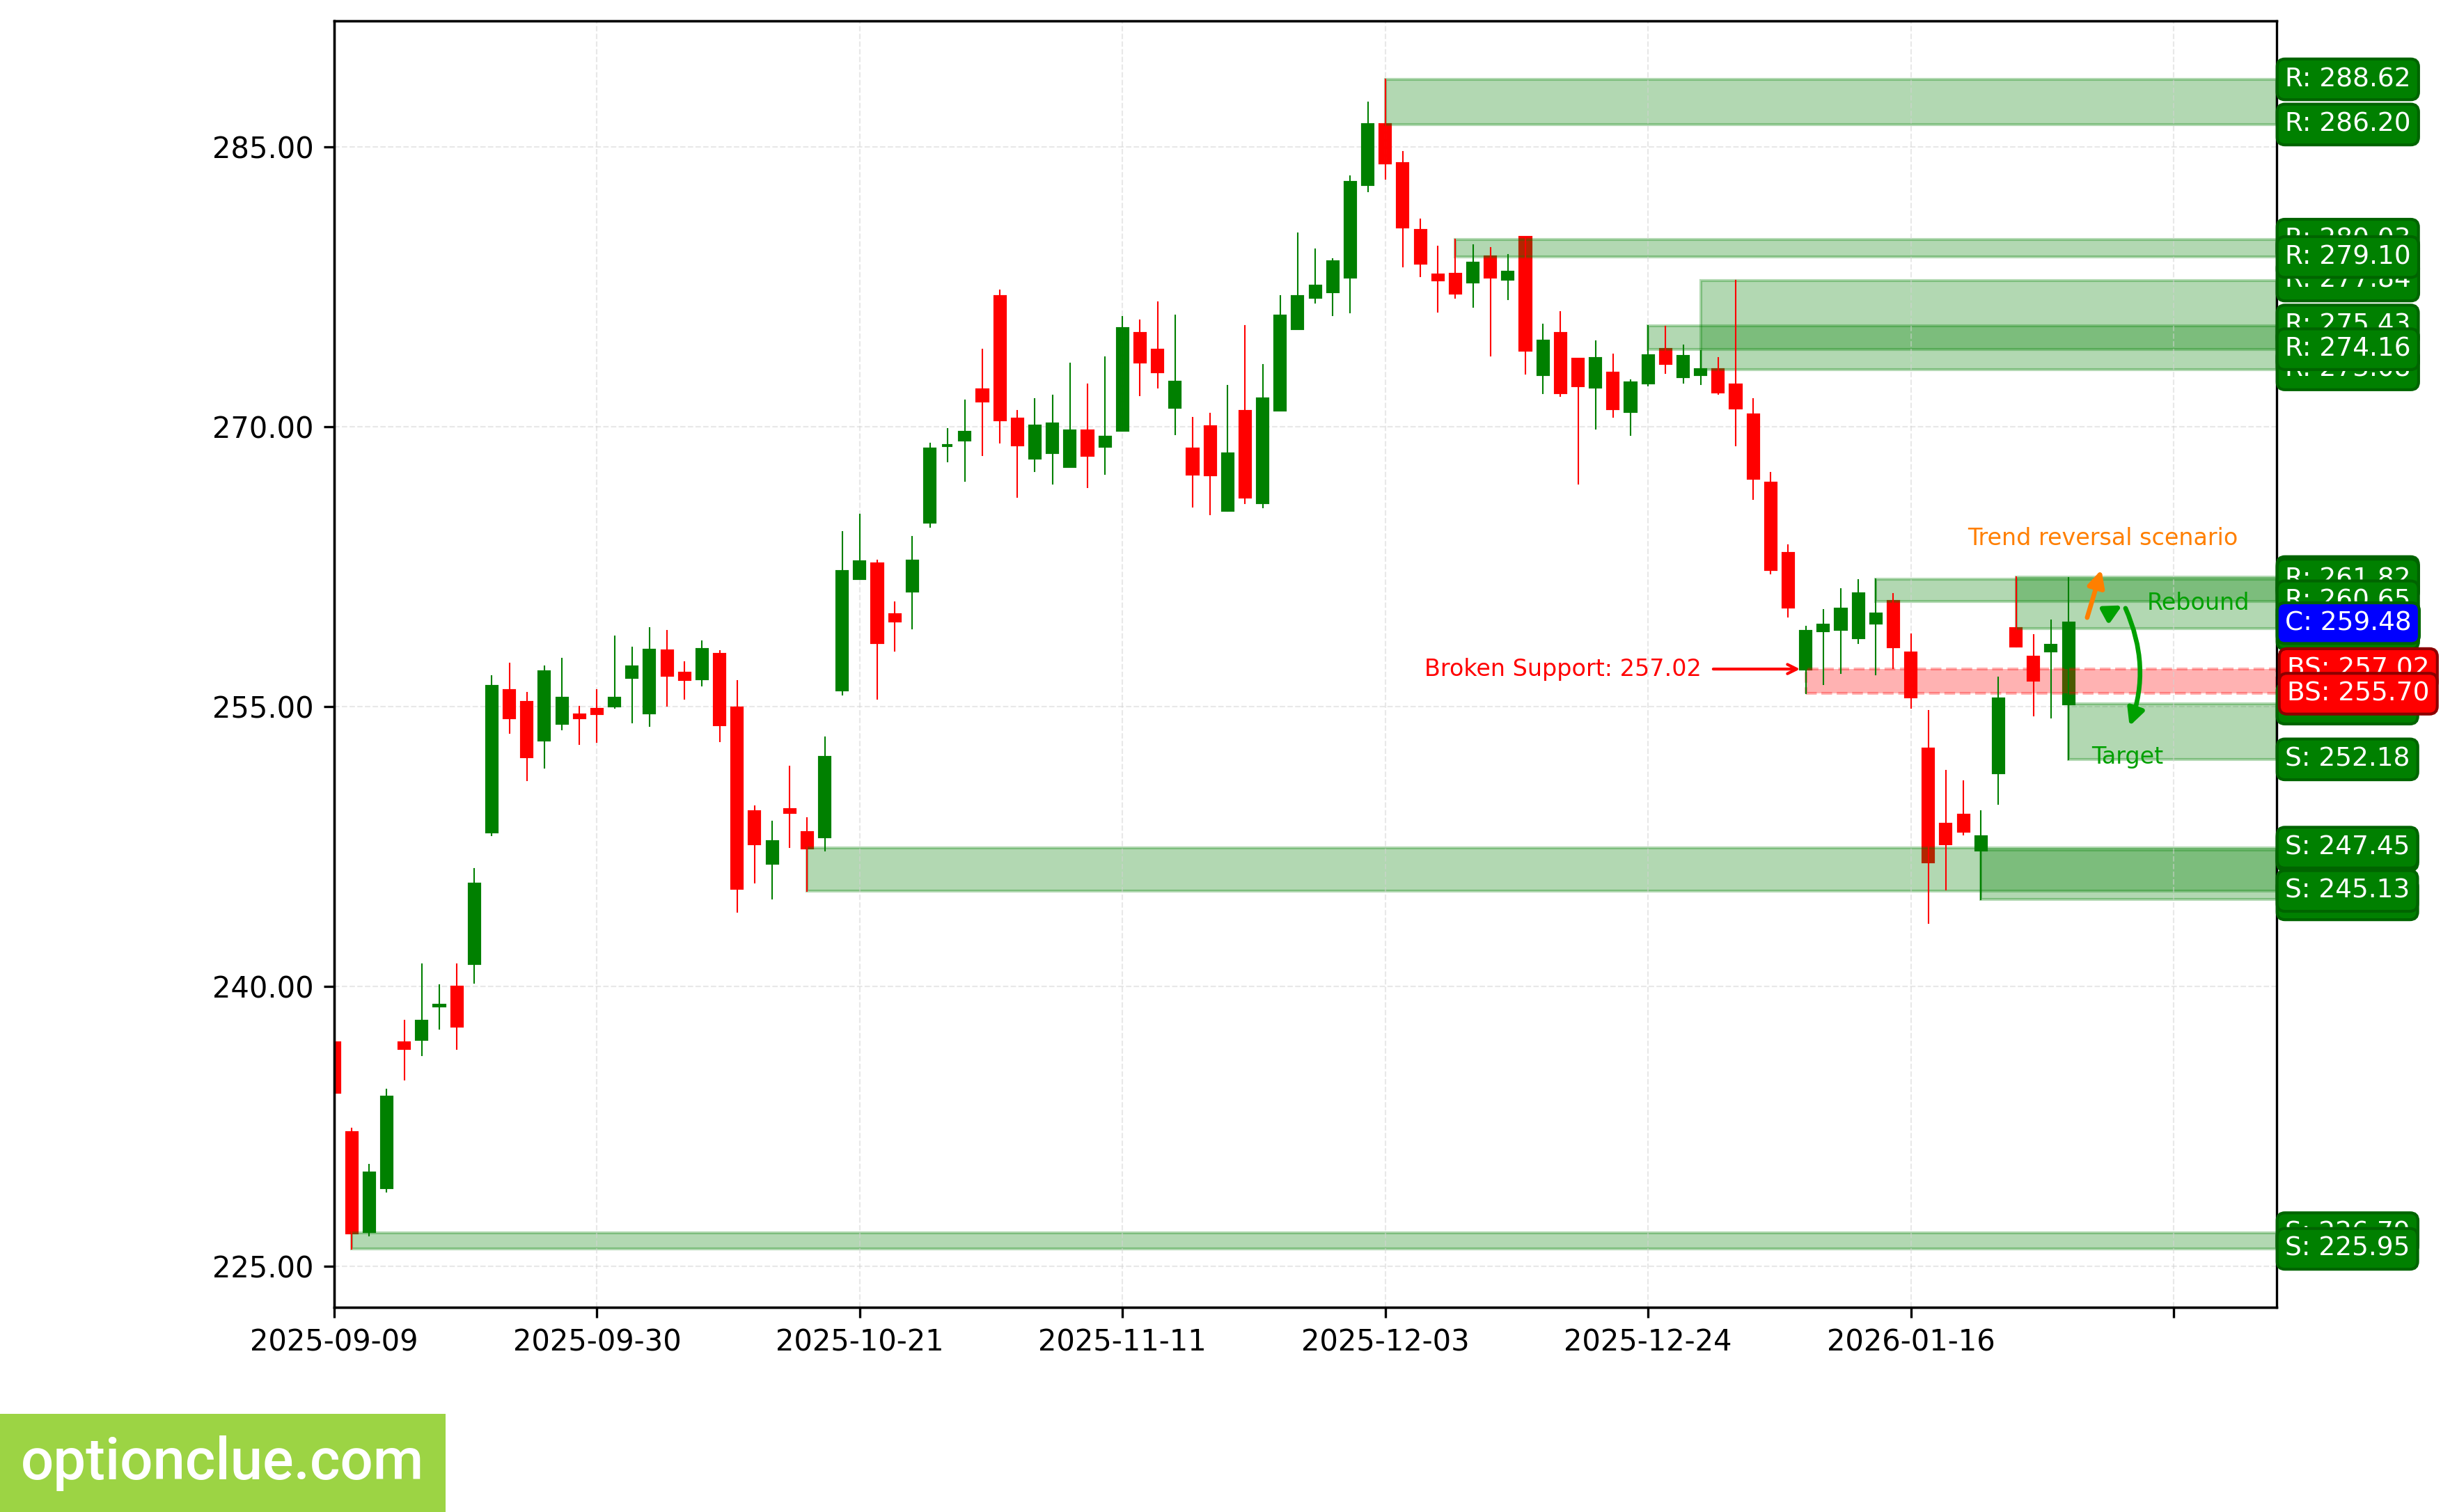
Apple Inc (AAPL)
Bearish trend continues, a corrective wave is developing again. An entry point for selling on rebound may form after the current correction completes. The last broken level is support (255.70 — 257.02). The breakout occurred 10 candlesticks ago.
Intermediate target for the downward movement is the support level with boundaries 252.18 — 255.17. In case of successful trend development, a further target will be at the support level with boundaries 225.95 — 226.79.
If the next correction completes near the resistance level (259.17 — 261.95), the potential profit/risk ratio could be small (about 0.5:1). When using a further target — around 3.8:1.
Short positions will remain relevant, as long as the market remains below the nearest resistance level with boundaries 259.17 — 261.95. If the market successfully closes above this nearest resistance, the trend will reverse to the opposite (bullish).
AAPL. Technical analysis. D1.
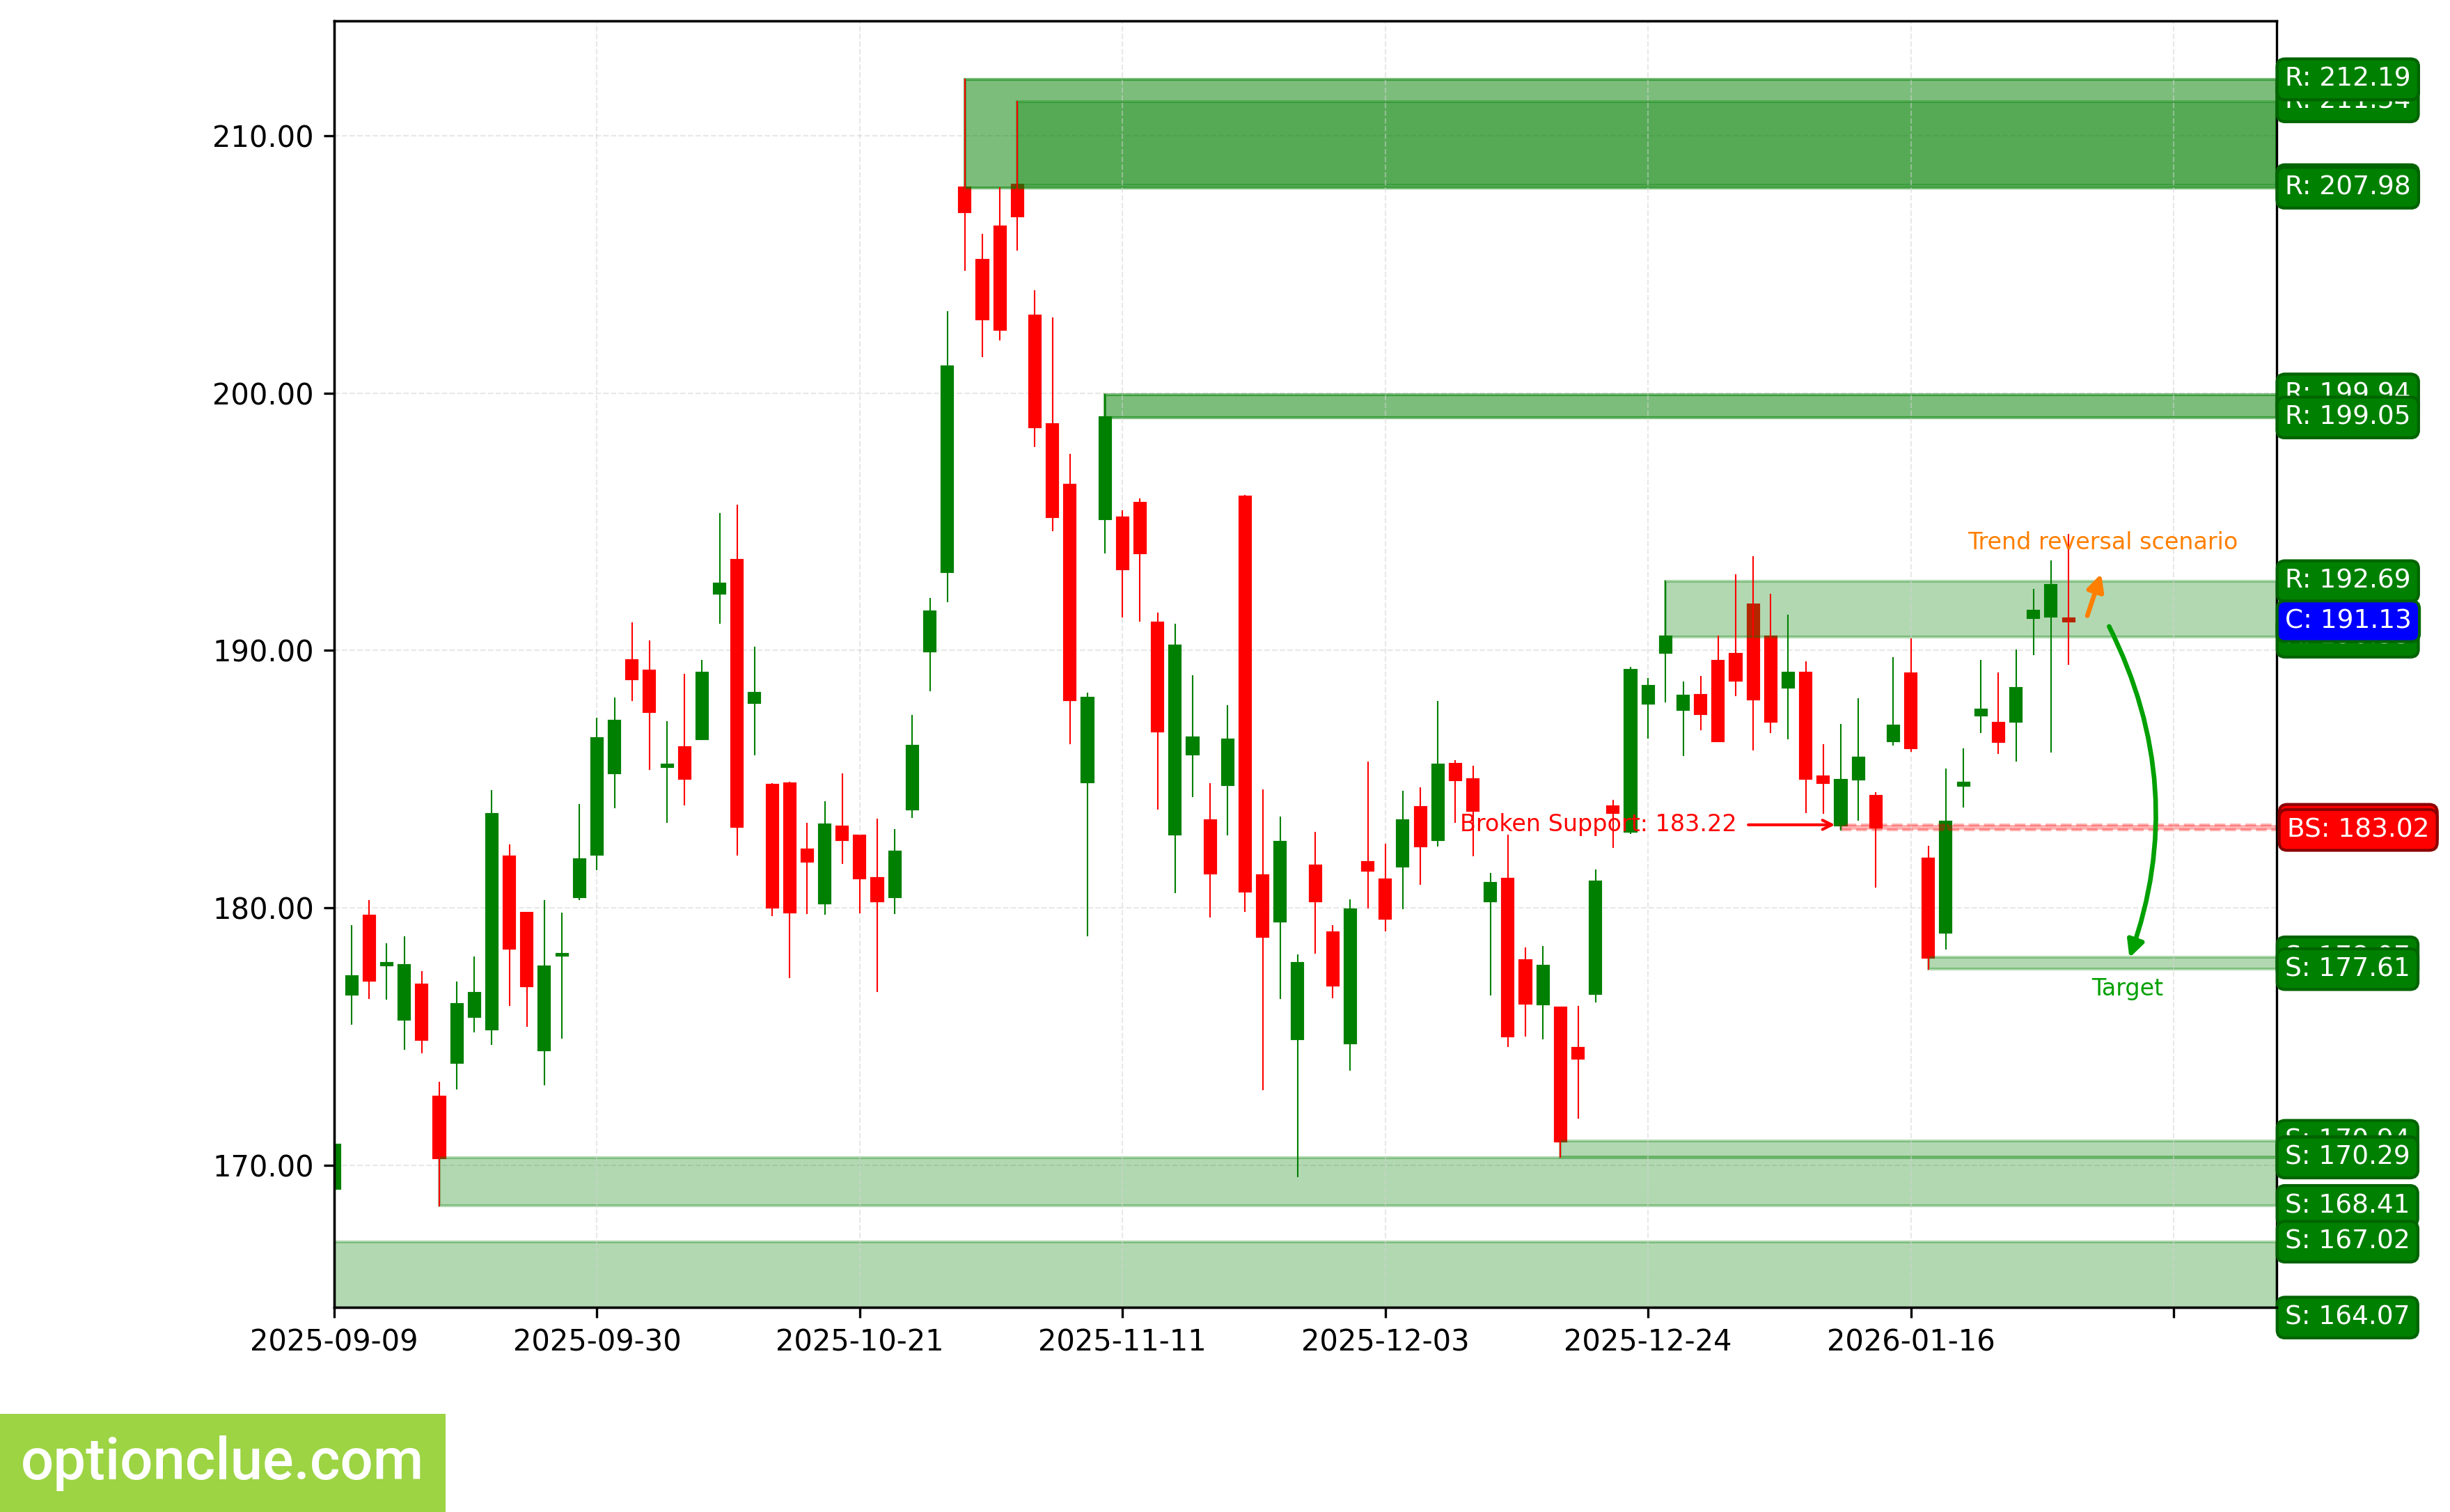
NVIDIA Corp (NVDA)
Bearish trend continues, on the last closed candlestick a bearish rebound from the resistance zone (190.53 — 192.69) was detected. The last broken level is support (183.02 — 183.22). The breakout occurred 9 candlesticks ago.
Intermediate target for the downward movement is the support level with boundaries 177.61 — 178.07. In case of successful trend development, a further target will be at the support level with boundaries 168.41 — 170.29.
From current prices, the potential profit/risk ratio could be about 2:1. When using a further target — around 3:1.
Short positions will remain relevant, as long as the market remains below the nearest resistance level with boundaries 190.53 — 192.69. If the market successfully closes above this nearest resistance, the trend will reverse to the opposite (bullish).
NVDA. Technical analysis. D1.
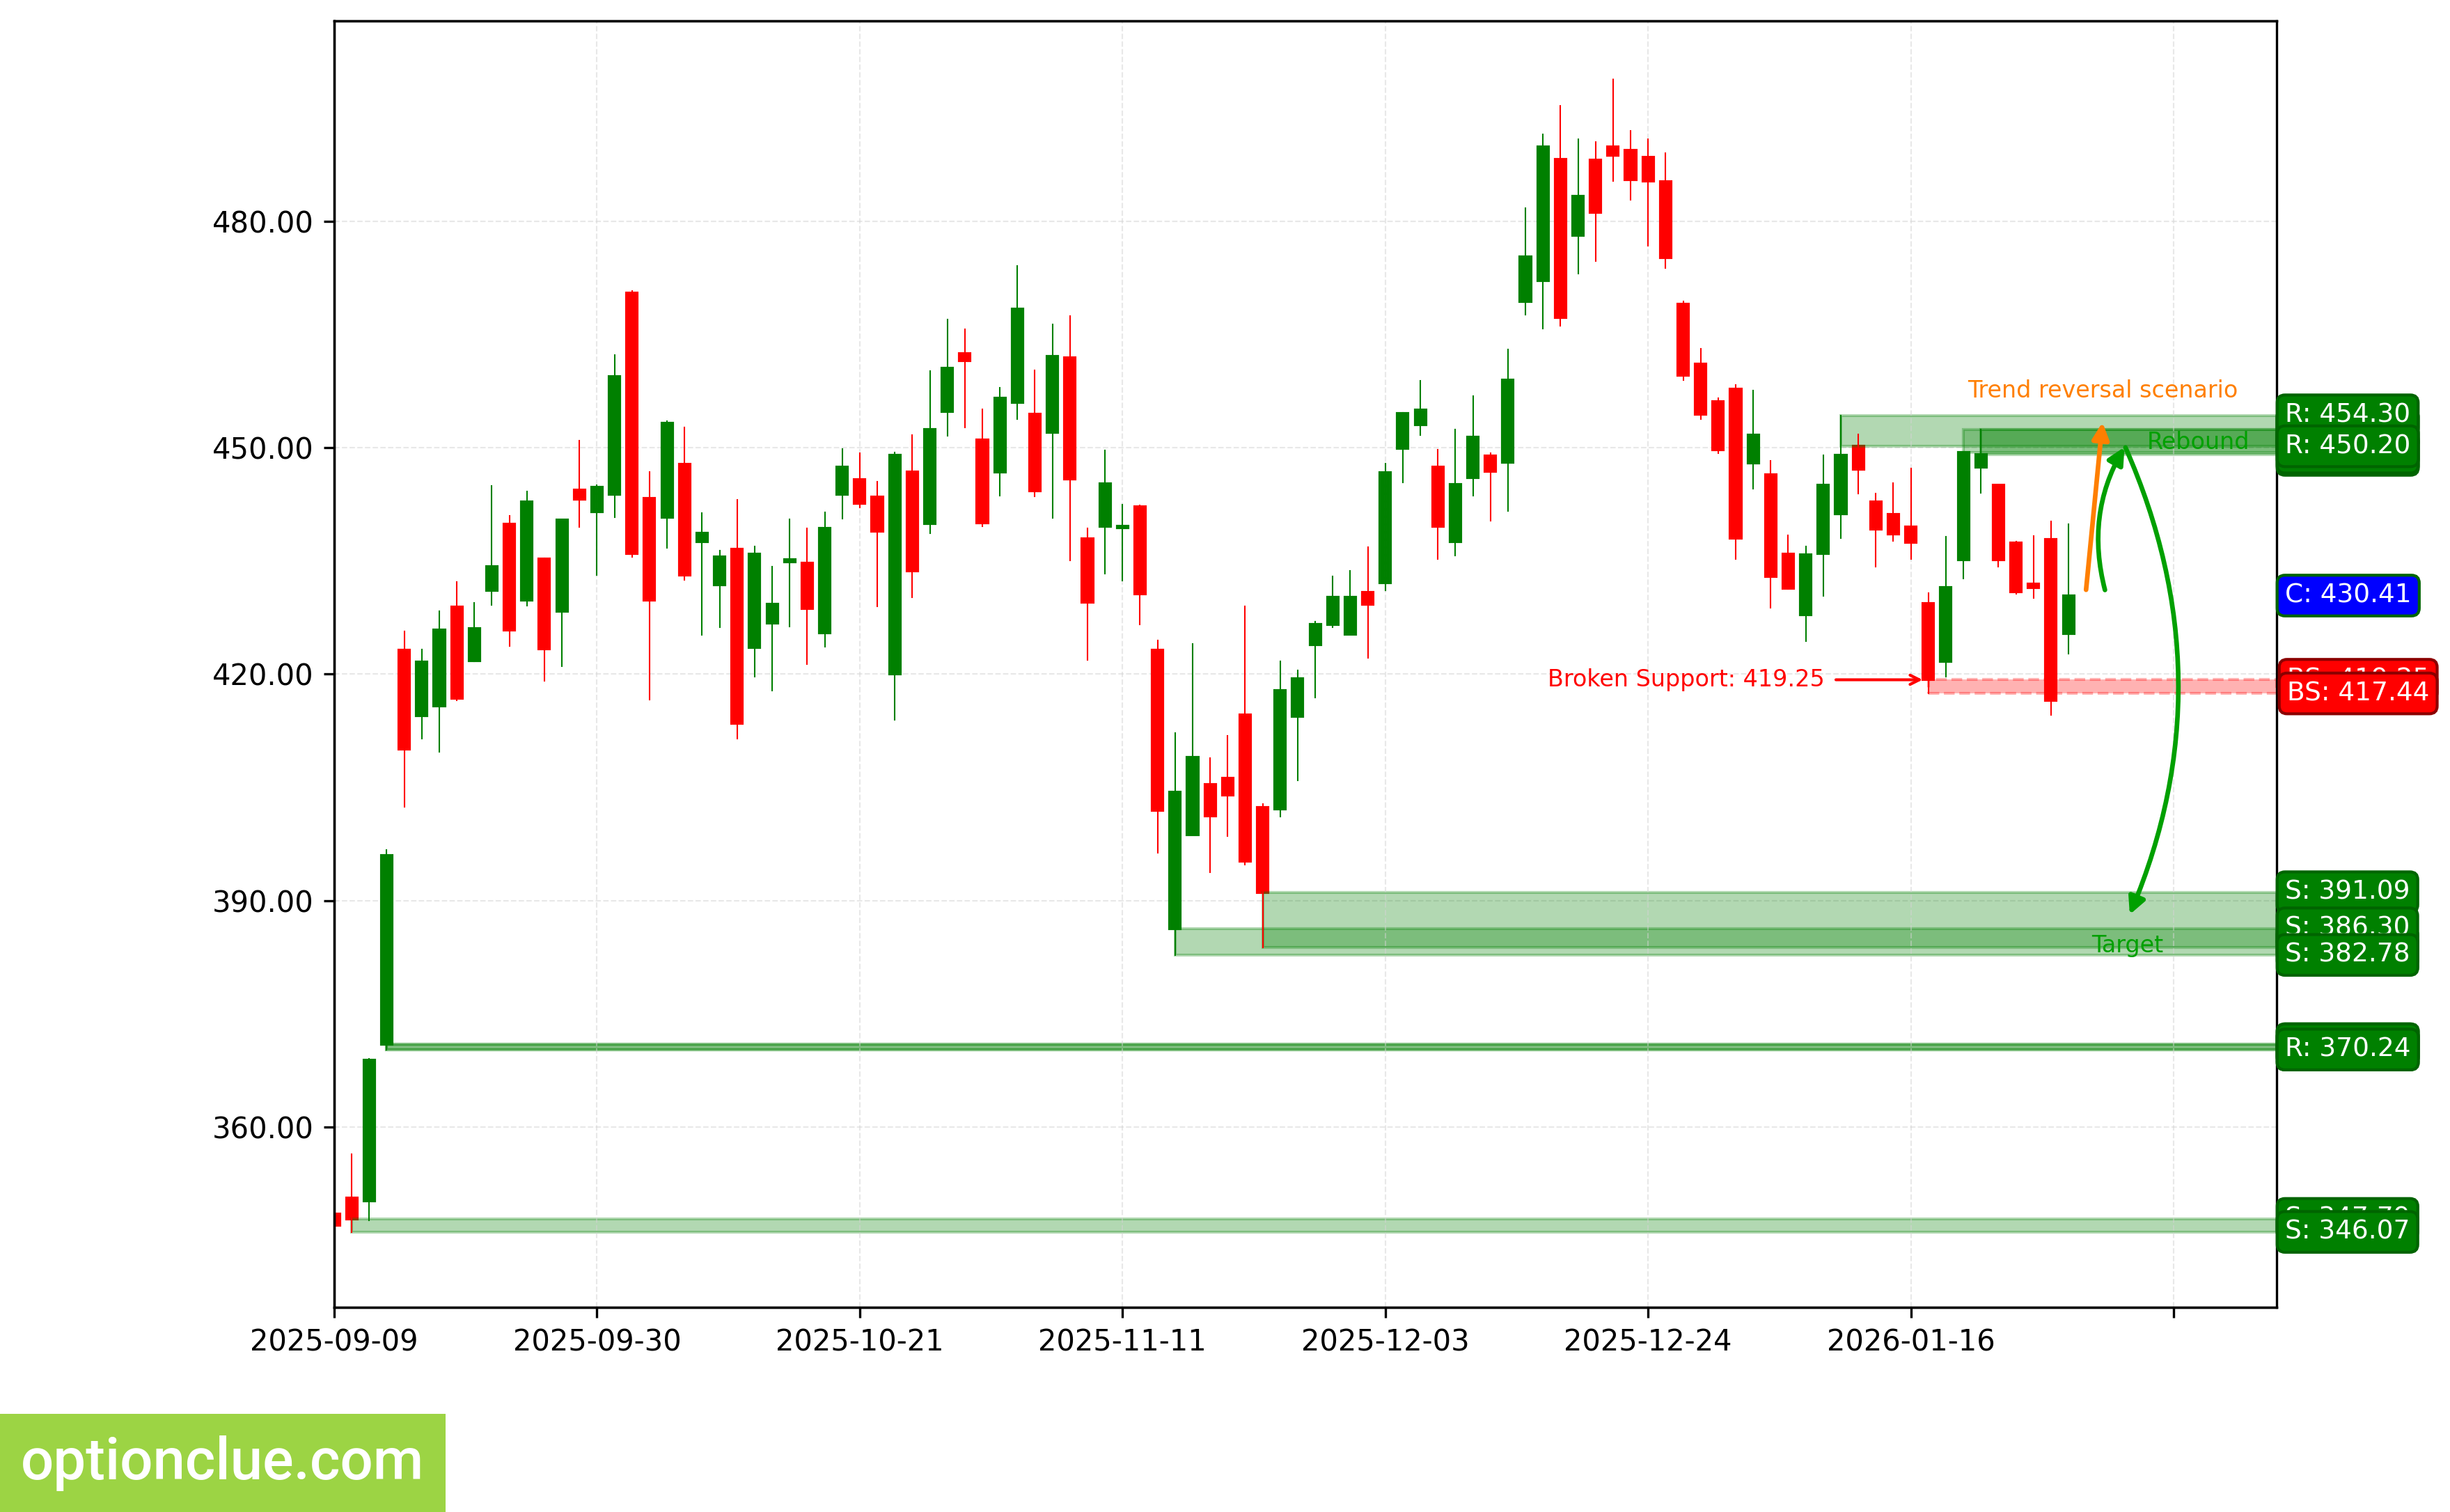
Tesla Inc (TSLA)
Bearish trend continues, a corrective wave is developing. An entry point for selling on rebound may form after the current correction completes. The last broken level is support (417.44 — 419.25). The breakout occurred 2 candlesticks ago.
Intermediate target for the downward movement is the support level with boundaries 383.76 — 391.09. In case of successful trend development, a further target will be at the support level with boundaries 346.07 — 347.79.
The potential profit/risk ratio from current prices when setting targets and fixing risks based on daily timeframe levels could be around 1.1:1. When using a further target — about 2:1. If the correction completes near the resistance level (449.06 — 452.43), the potential profit/risk ratio could be more than 3:1. When assessing a further target — more than 6:1.
Short positions will remain relevant, as long as the market remains below the nearest resistance level with boundaries 449.06 — 452.43. If the market successfully closes above this nearest resistance, the trend will reverse to the opposite (bullish).
TSLA. Technical analysis. D1.
Summary
From a medium-term trading perspective, financial instruments with correction nearing completion on Daily and/or potentially the most promising profit/risk ratios include: EURUSD, GBPUSD, USDJPY, AAPL, NVDA. Soon, depending on the depth of market correction, the following may deserve attention: USDCAD, AUDUSD, NZDUSD.
The rest of the trading list instruments may also be interesting, but on these markets Daily rebound signals are likely to appear no earlier than in a week.