Examining the most important levels on key financial instruments and likely scenarios for further developments.
Key Topics
- Euro (EURUSD)
- British Pound (GBPUSD)
- Swiss Franc (USDCHF)
- Canadian Dollar (USDCAD)
- Australian Dollar (AUDUSD)
- Bitcoin (BTC)
- Ether (ETH)
- Apple Inc (AAPL)
- NVIDIA Corp (NVDA)
- Tesla Inc (TSLA)
- Summary
Euro (EURUSD)
Bullish trend continues, impulse wave is developing. The last broken level is resistance (1.1818 — 1.1838). Breakout occurred 15 candlesticks ago.
Intermediate target for the upward movement is the resistance level with boundaries 1.1913 — 1.1928. In case of successful trend development, a further target will be at the resistance level with boundaries 1.2041 — 1.2078.
If the correction completes around the support level (1.1741 — 1.1772), the potential profit/risk ratio may be around 2:1. When using a further target — approximately 3.6:1.
Long positions will remain relevant, as long as the market is above the nearest support level with boundaries 1.1741 — 1.1772. If the market successfully settles below this support, the trend will reverse to the opposite (bearish).
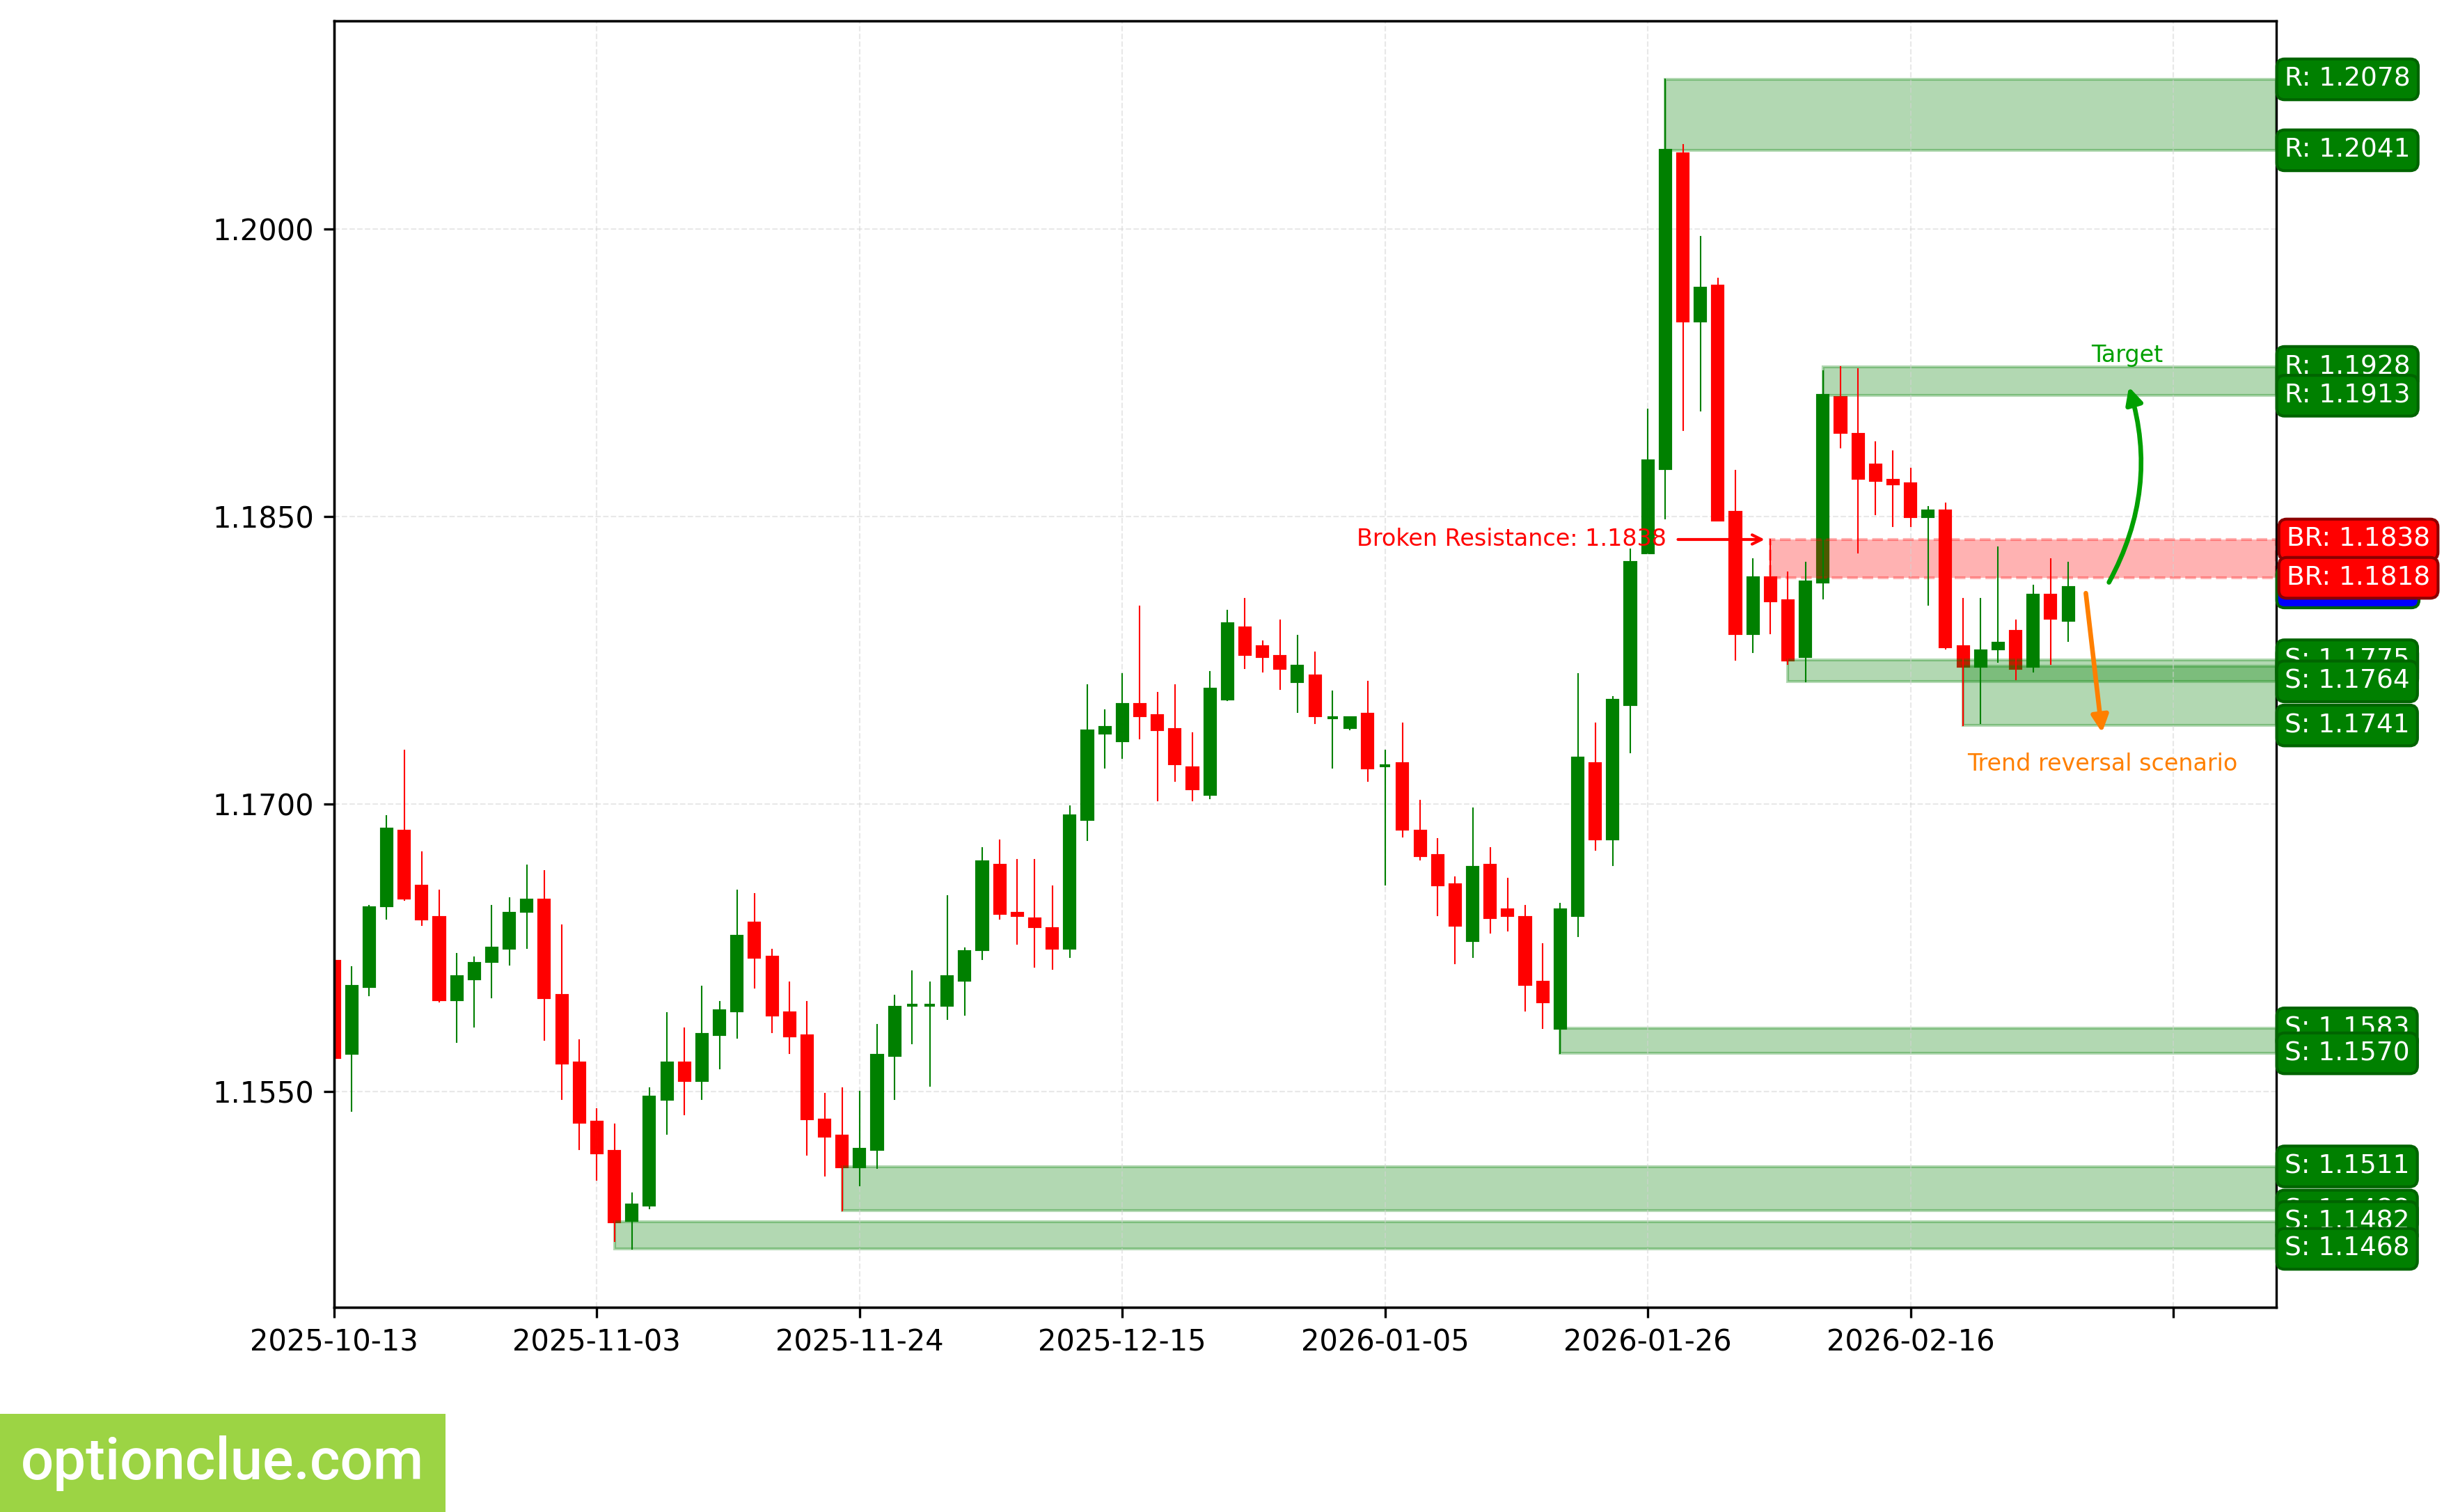
EURUSD. Technical analysis. D1.
British Pound (GBPUSD)
Trend has turned bullish, when resistance level (1.3495 — 1.3536) was broken last week. Breakout occurred 3 candlesticks ago. Corrective wave is developing. Entry point for buying on rebound may form after the current correction completes.
Intermediate target for the upward movement is the resistance level with boundaries 1.3556 — 1.3575. In case of successful trend development, a further target will be at the resistance level with boundaries 1.3690 — 1.3712.
If the correction completes around the support level (1.3326 — 1.3365), the potential profit/risk ratio may be approximately 2:1. When using a further target — around 3:1. If the correction completes around the last broken level (1.3495 — 1.3536), the potential profit/risk ratio may be small (around 0.1:1). When choosing a further target — also small (approximately 0.6:1).
Long positions will remain relevant, as long as the market is above the nearest support level with boundaries 1.3326 — 1.3365. If the market successfully settles below this support, the trend will reverse to the opposite (bearish).
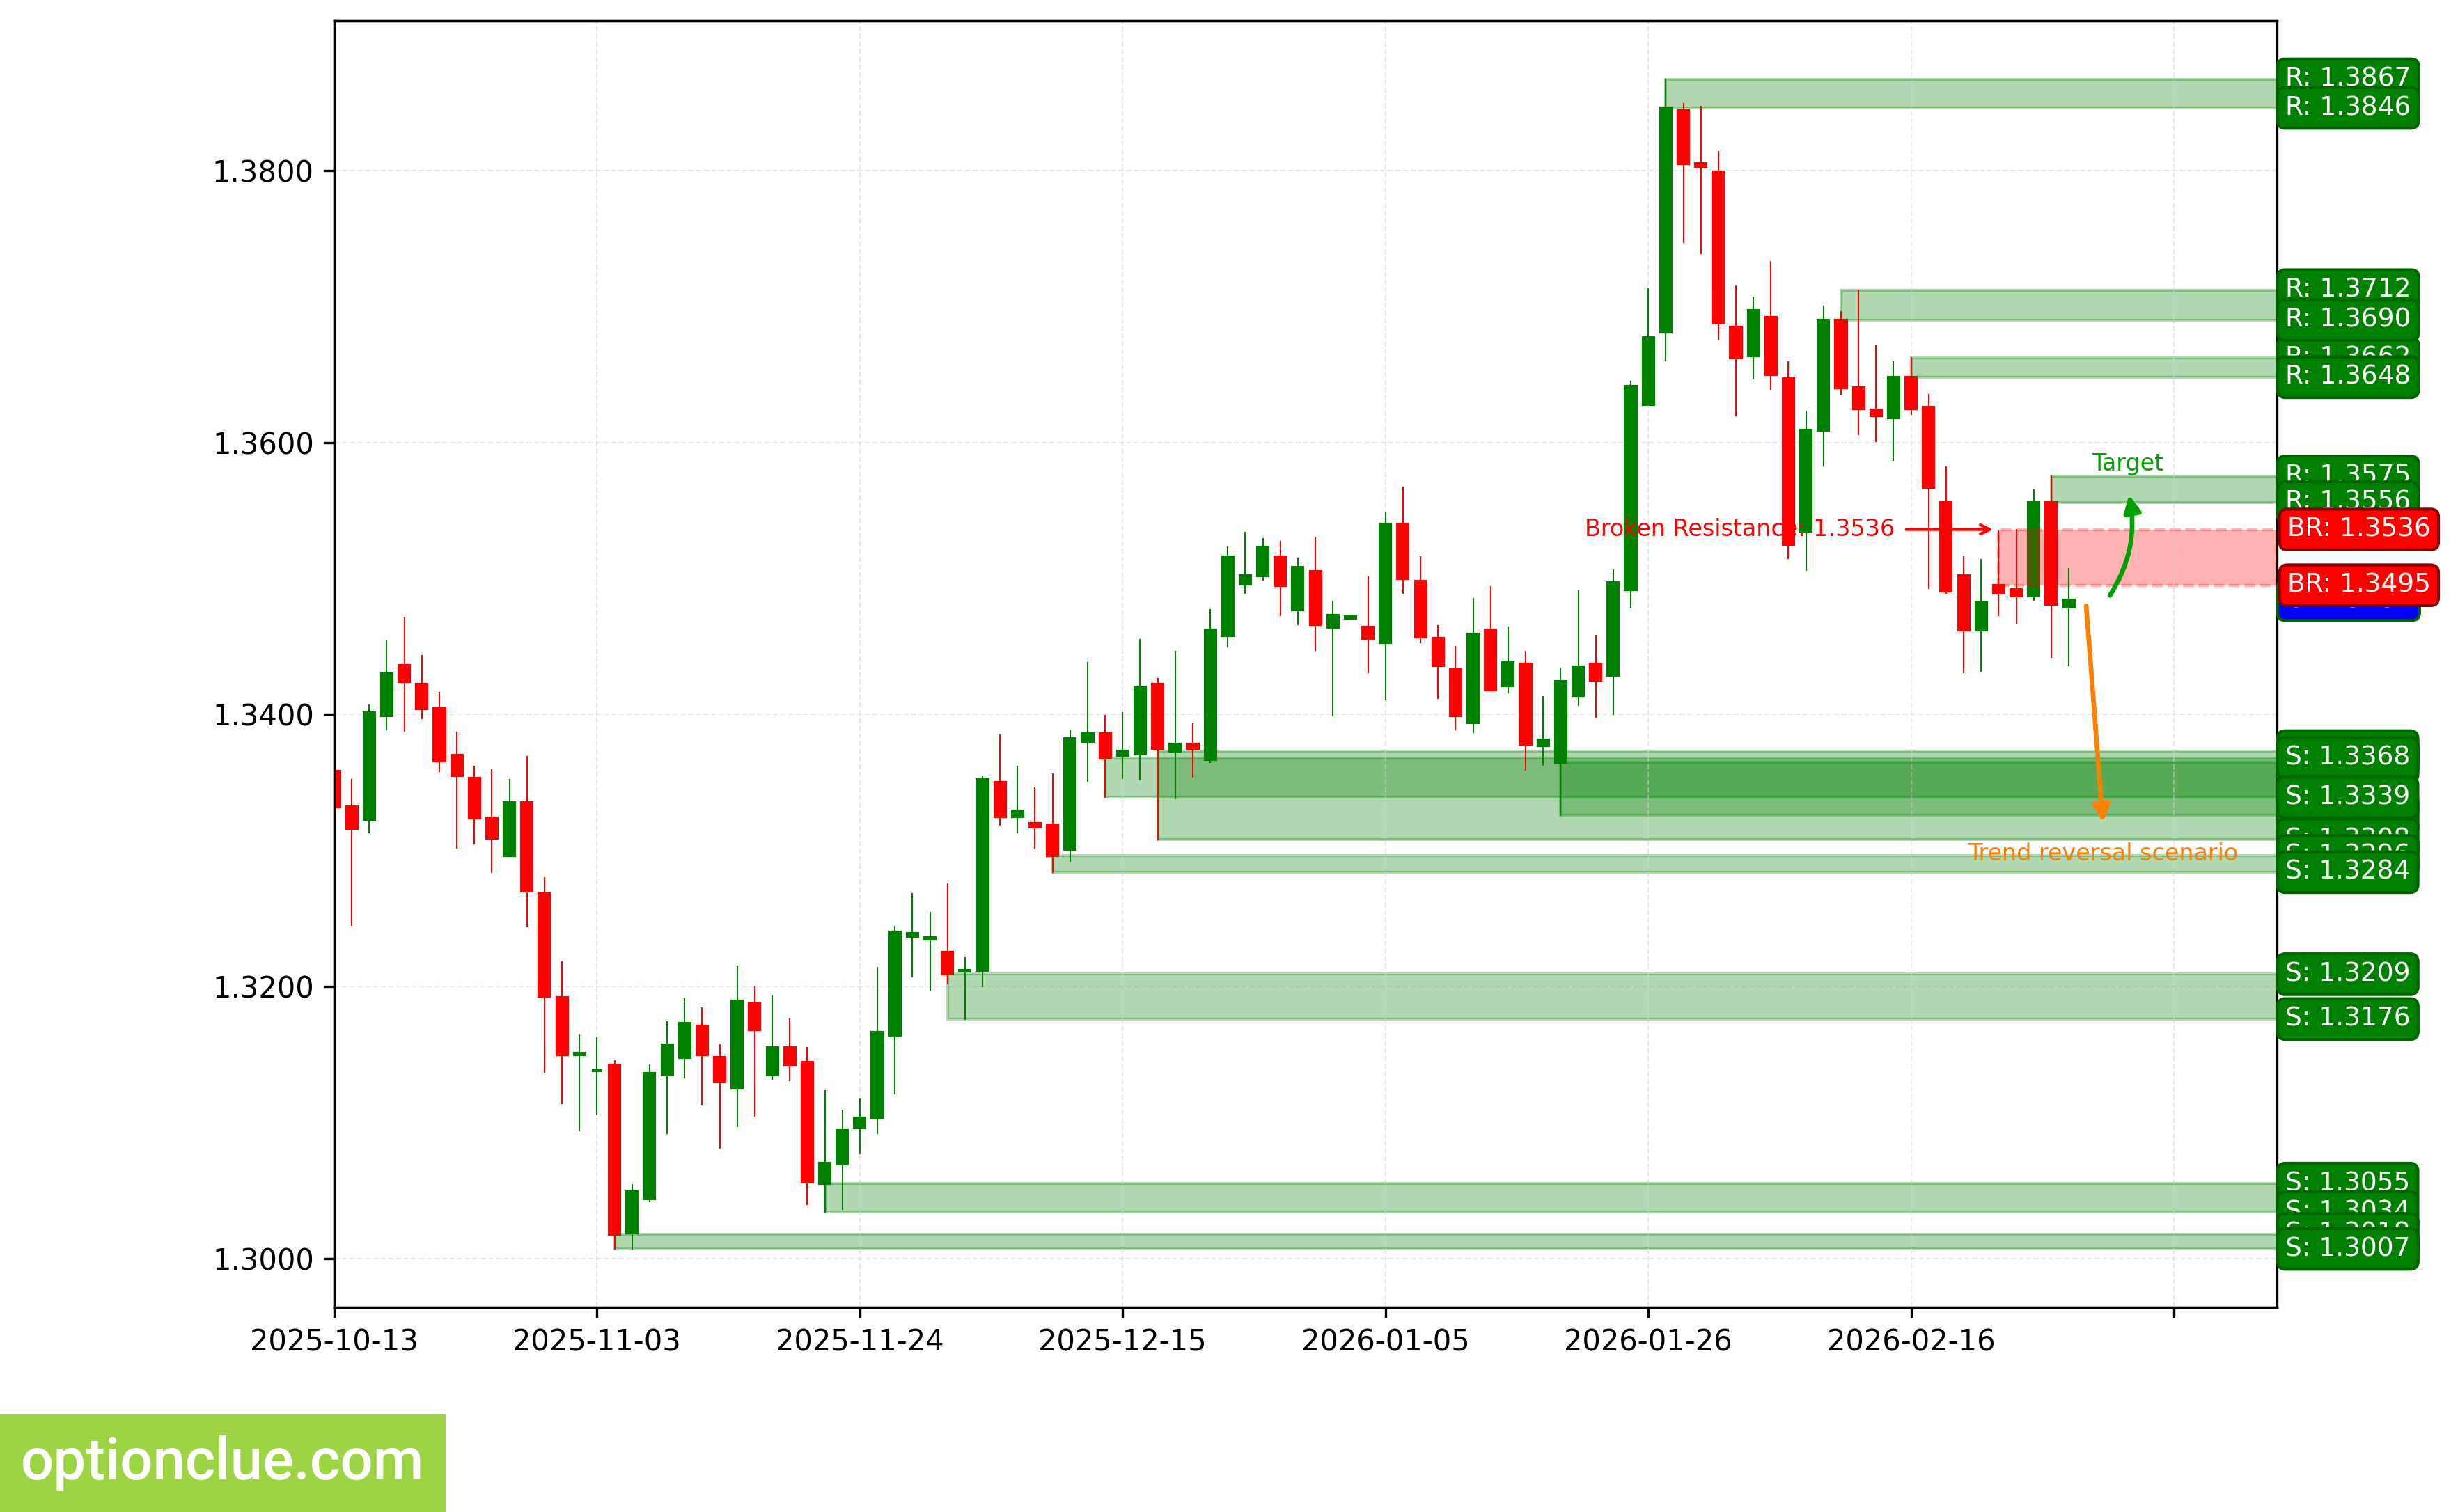
GBPUSD. Technical analysis. D1.
Swiss Franc (USDCHF)
Bullish trend continues, corrective wave is developing. Entry point for buying on rebound may form after the current correction completes. The last broken level is resistance (0.7717 — 0.7730). Breakout occurred 8 candlesticks ago.
Intermediate target for the upward movement is the resistance level with boundaries 0.7748 — 0.7768. In case of successful trend development, a further target will be at the resistance level with boundaries 0.8033 — 0.8040.
If the correction completes around the support level (0.7665 — 0.7677), the potential profit/risk ratio may be around 1.2:1. When using a further target — more than 5:1.
Long positions will remain relevant, as long as the market is above the nearest support level with boundaries 0.7665 — 0.7677. If the market successfully settles below this support, the trend will reverse to the opposite (bearish).
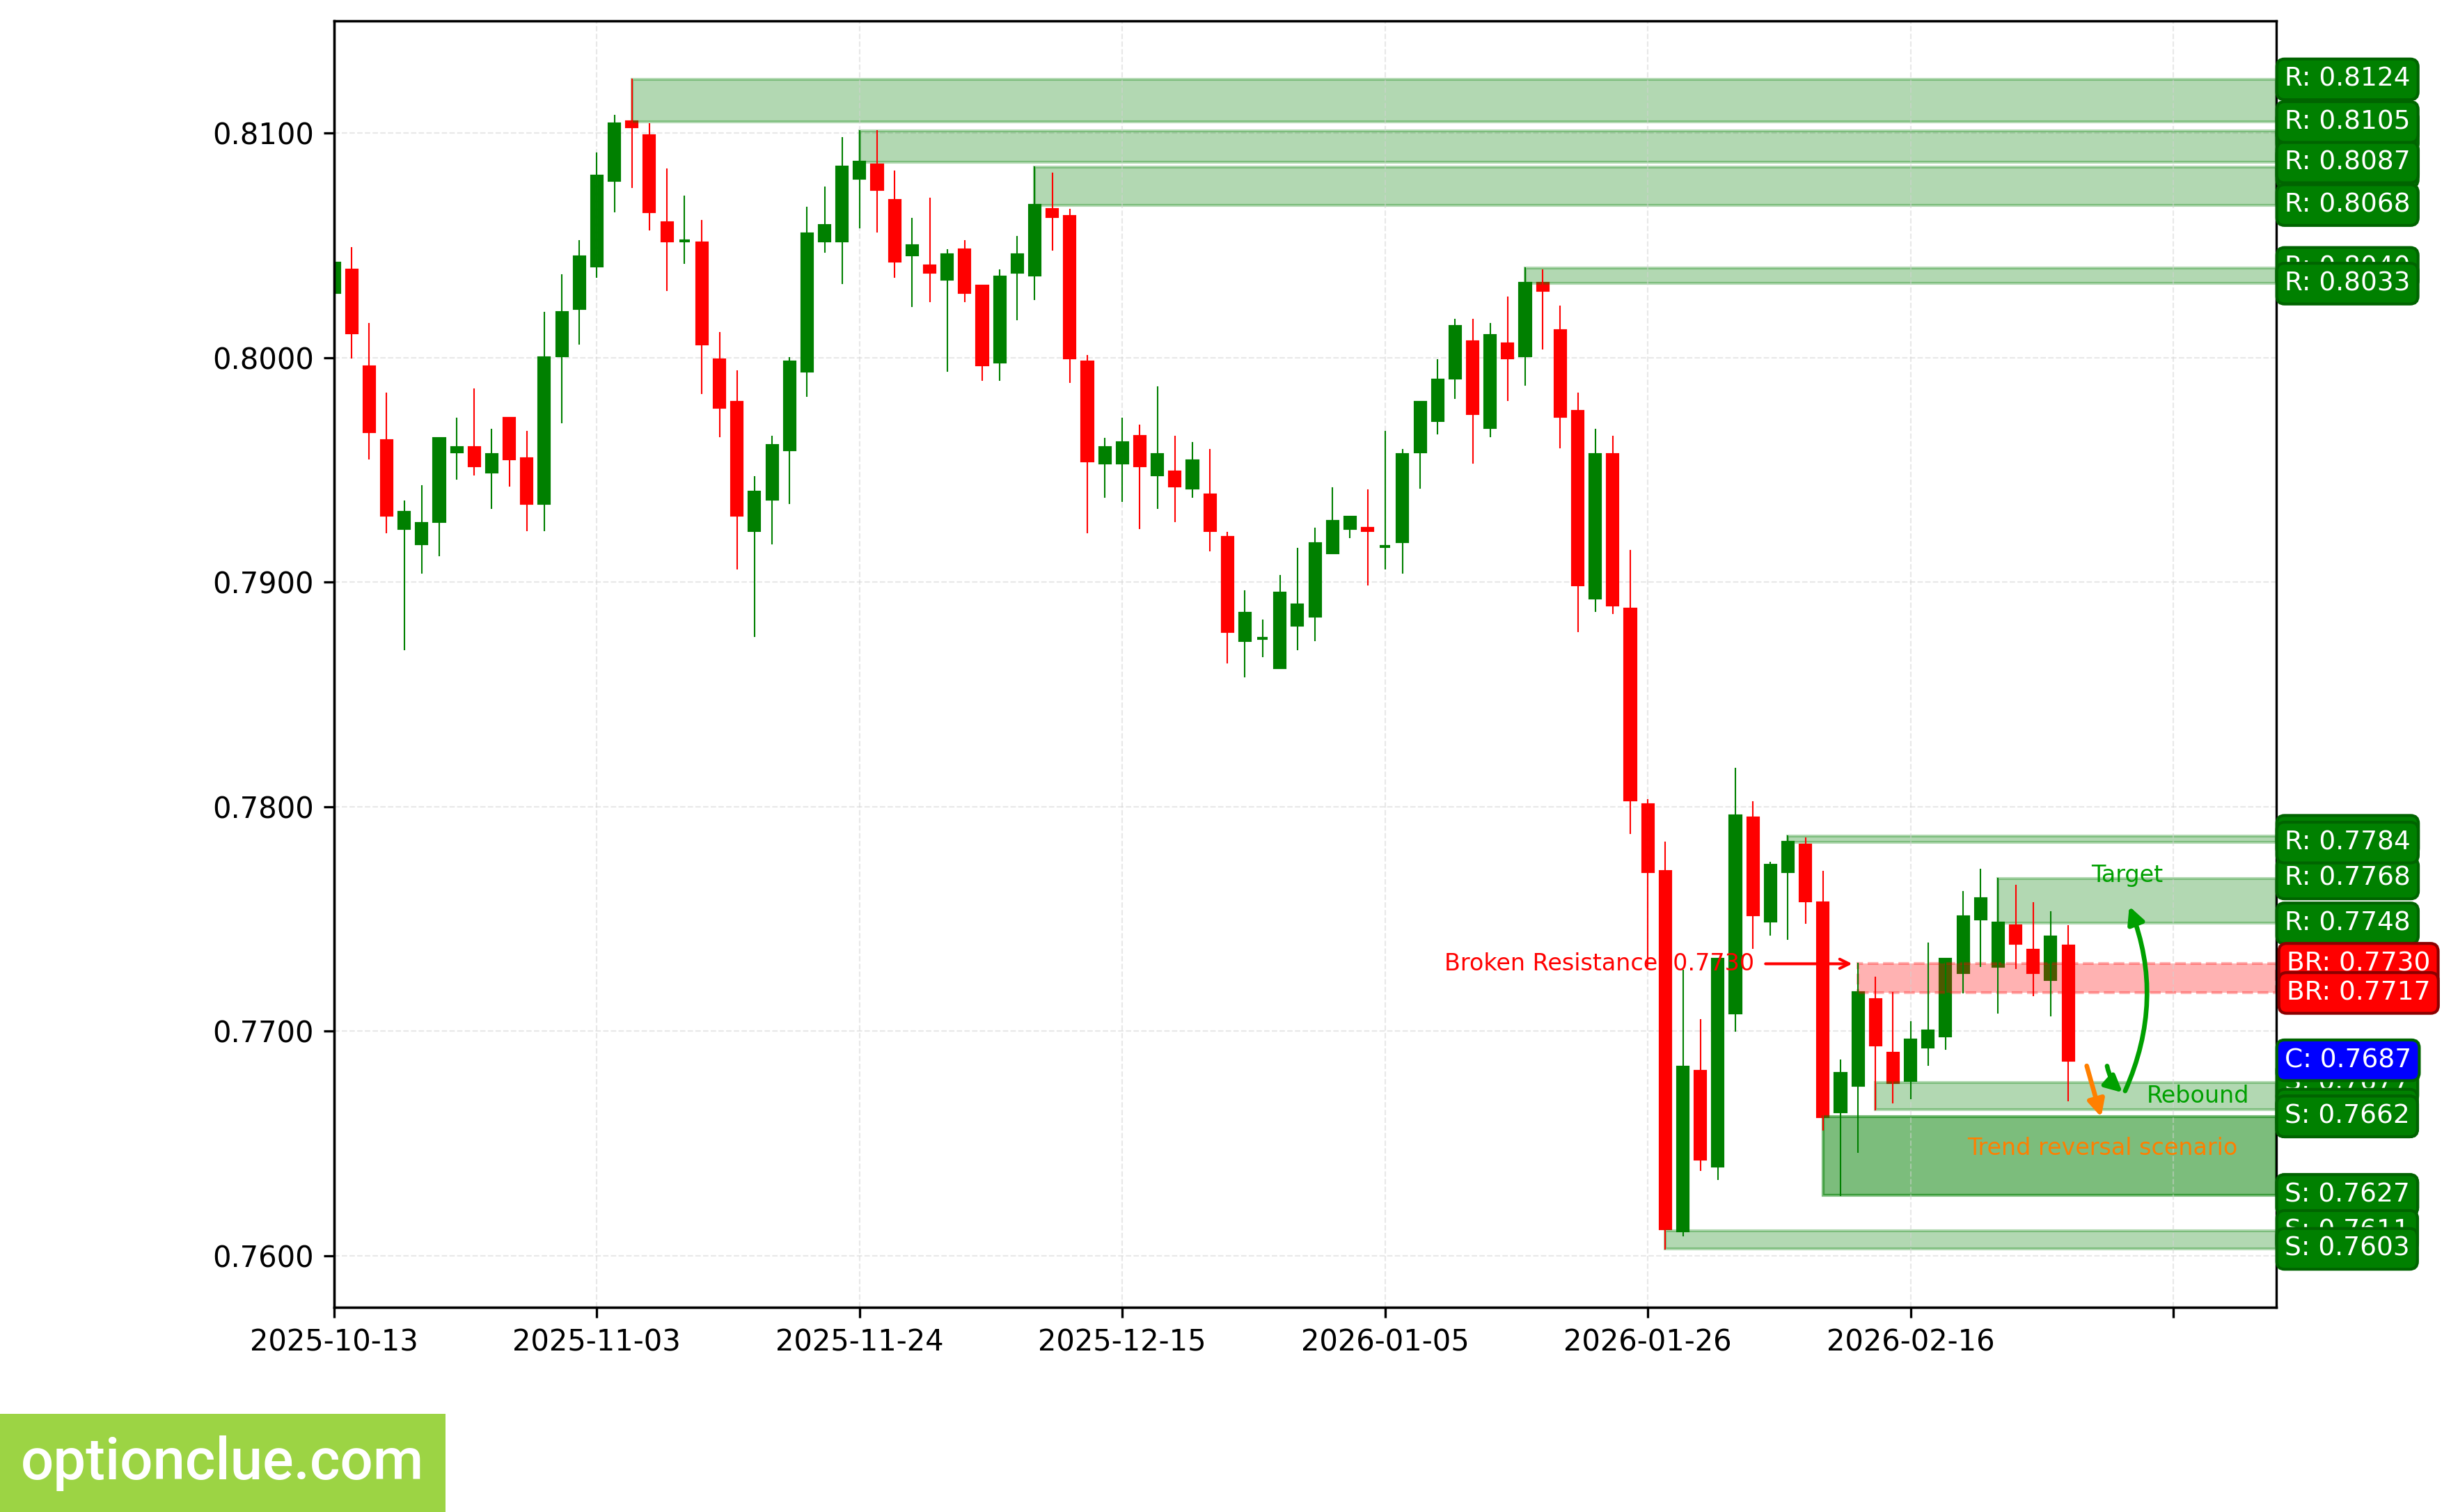
USDCHF. Technical analysis. D1.
Canadian Dollar (USDCAD)
Bearish trend continues, impulse wave is developing after breakout. The last broken level is support (1.3646 — 1.3678). Breakout occurred on the last closed candlestick.
Intermediate target for the downward movement is the support level with boundaries 1.3501 — 1.3550.
If the new correction completes around the resistance level (1.3712 — 1.3724), the potential profit/risk ratio may be approximately 2:1.
Short positions will remain relevant, as long as the market remains below the nearest resistance level with boundaries 1.3712 — 1.3724. If the market successfully settles above this nearest resistance, the trend will reverse to the opposite (bullish).
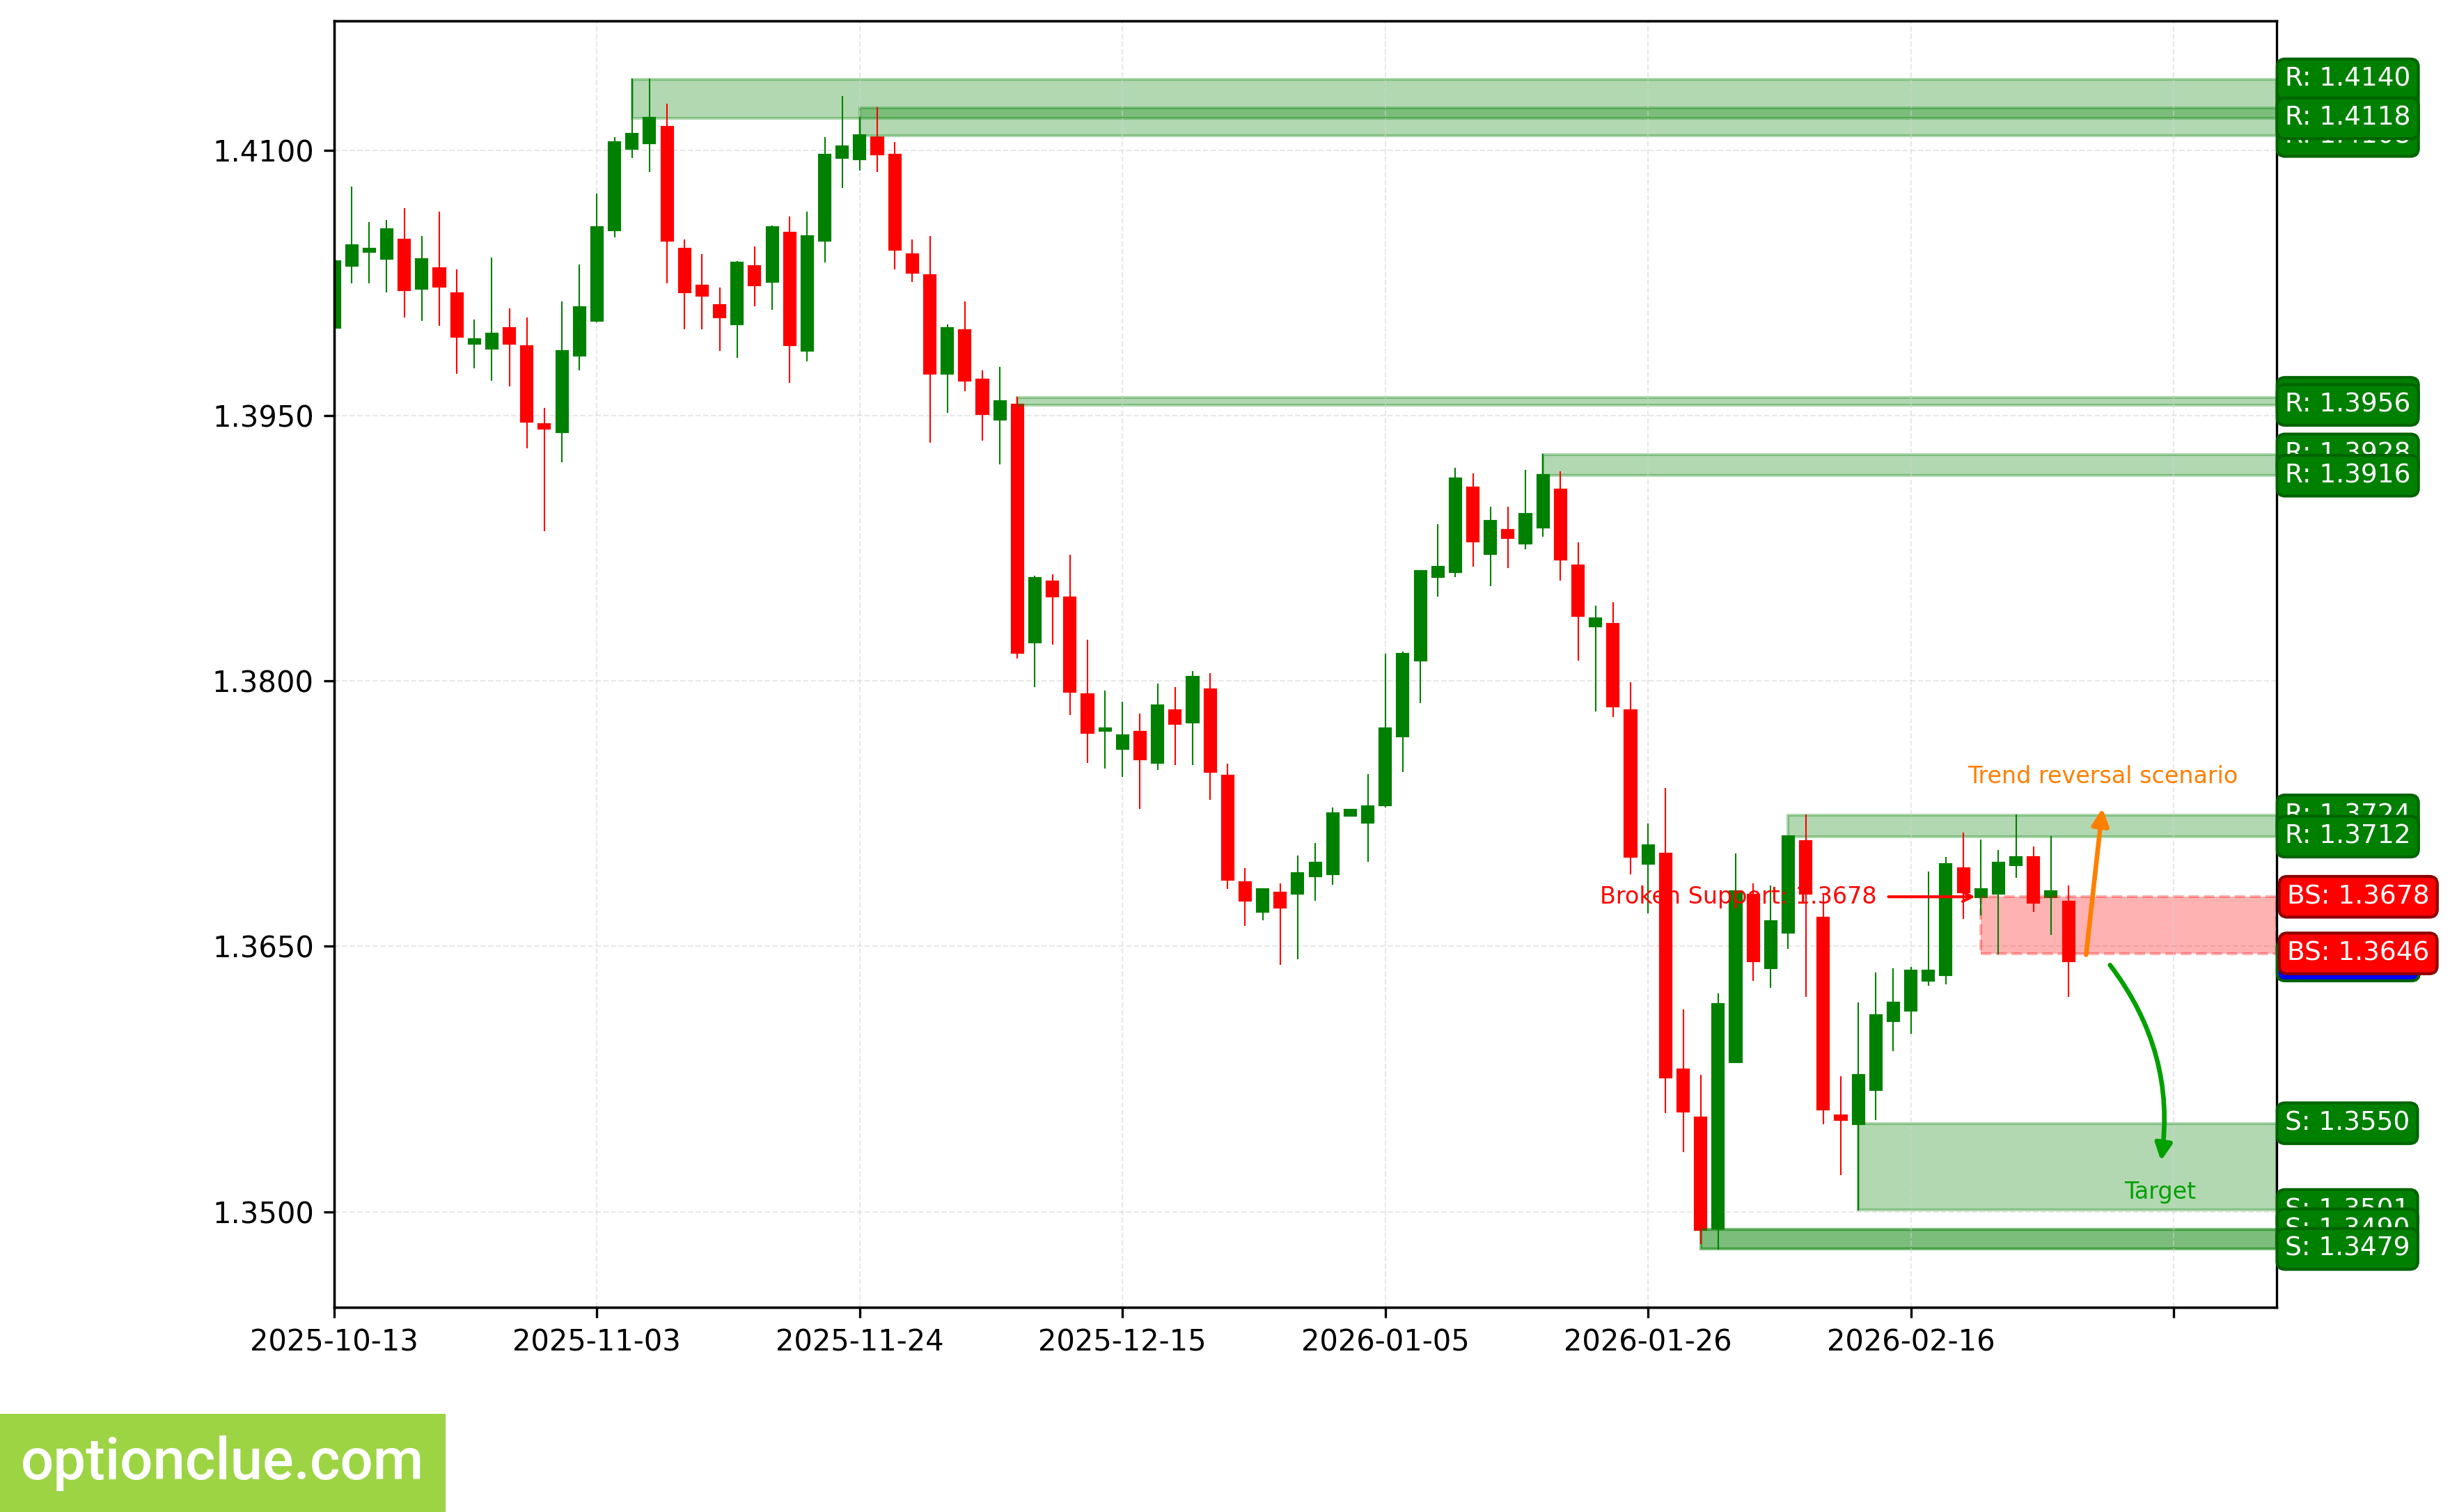
USDCAD. Technical analysis. D1.
Australian Dollar (AUDUSD)
Bullish trend continues, correction completed 4 candlesticks ago, impulse wave is developing. The last broken level is resistance (0.7023 — 0.7050). Breakout occurred 15 candlesticks ago.
Intermediate target for the upward movement is the resistance level with boundaries 0.7127 — 0.7147.
From current prices, the profit/risk ratio is small (around 0.1:1).
Long positions will remain relevant, as long as the market is above the nearest support level with boundaries 0.7024 — 0.7054. If the market successfully settles below this support, the trend will reverse to the opposite (bearish).
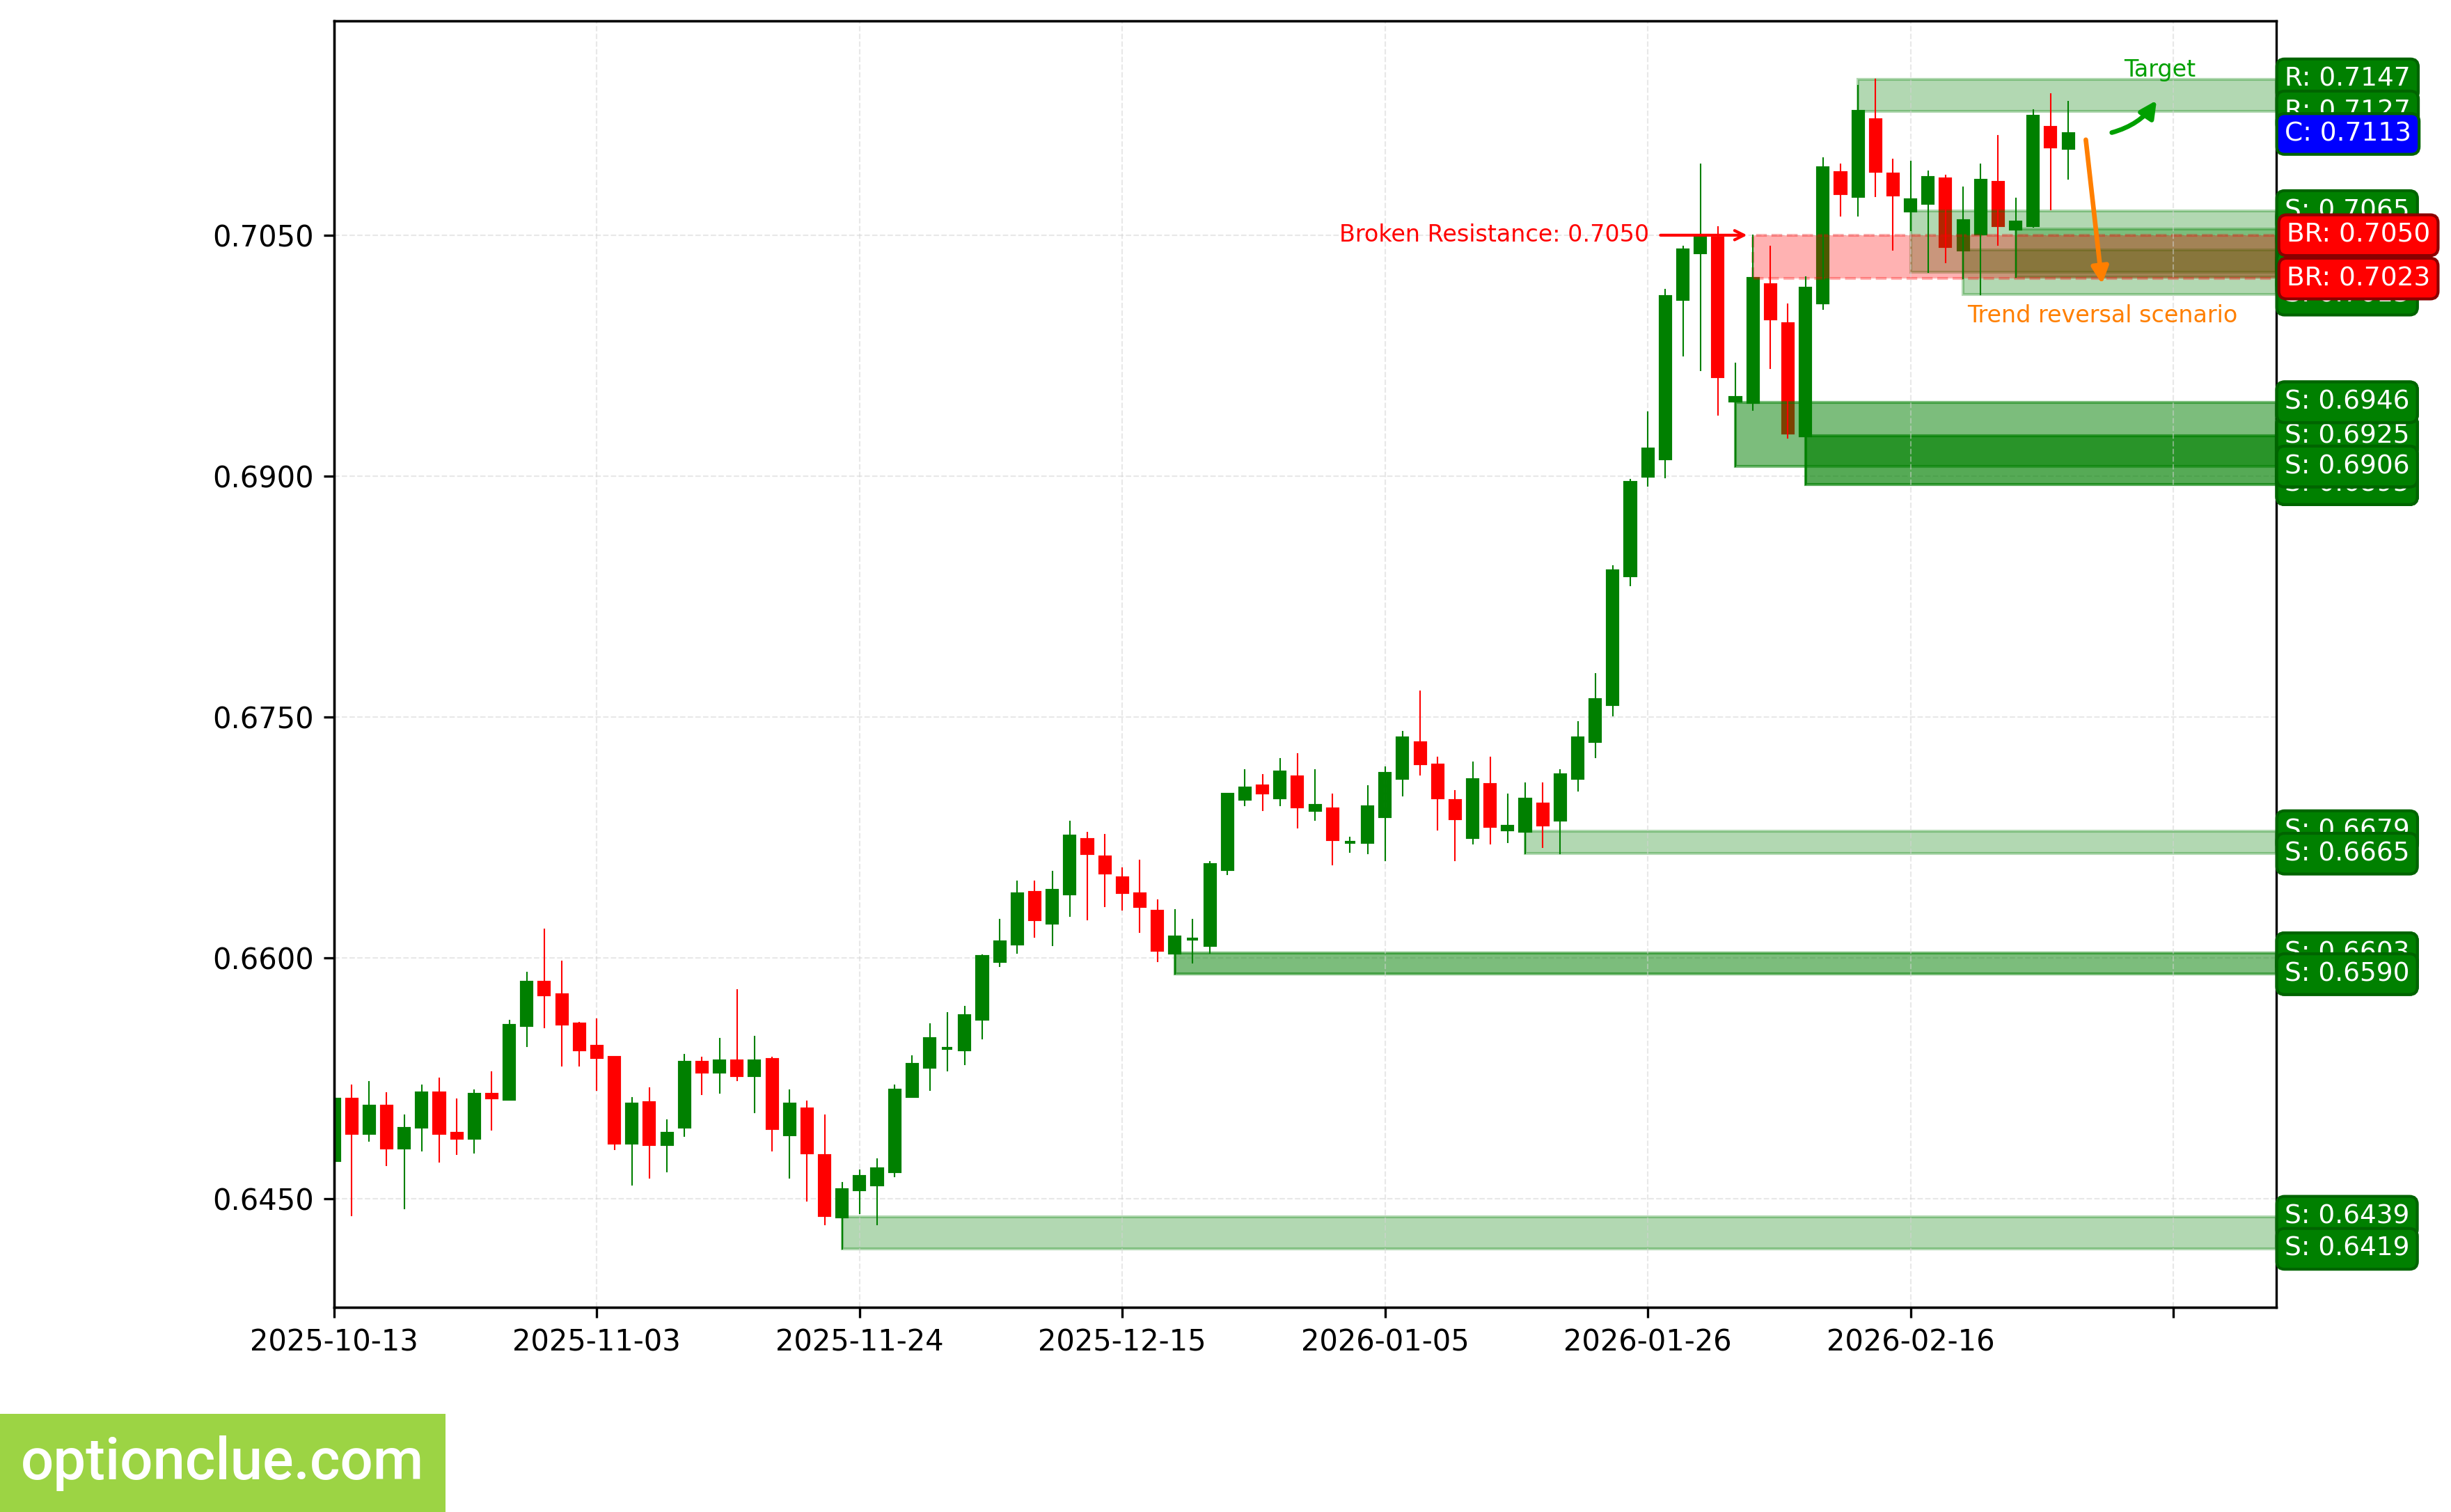
AUDUSD. Technical analysis. D1.
Bitcoin (BTC)
Bearish trend continues, correction likely completed 2 candlesticks ago, impulse wave is developing. The last broken level is support (65637 — 66425). Breakout occurred 5 candlesticks ago, and price has returned to this last broken level.
Intermediate target for the downward movement is the support level with boundaries 60074 — 62702.
Potential profit/risk ratio from current prices when setting targets and fixing risks based on daily timeframe levels may be small (approximately 0.3:1).
Short positions will remain relevant, as long as the market remains below the nearest resistance level with boundaries 67960 — 69954. If the market successfully settles above this nearest resistance, the trend will reverse to the opposite (bullish).
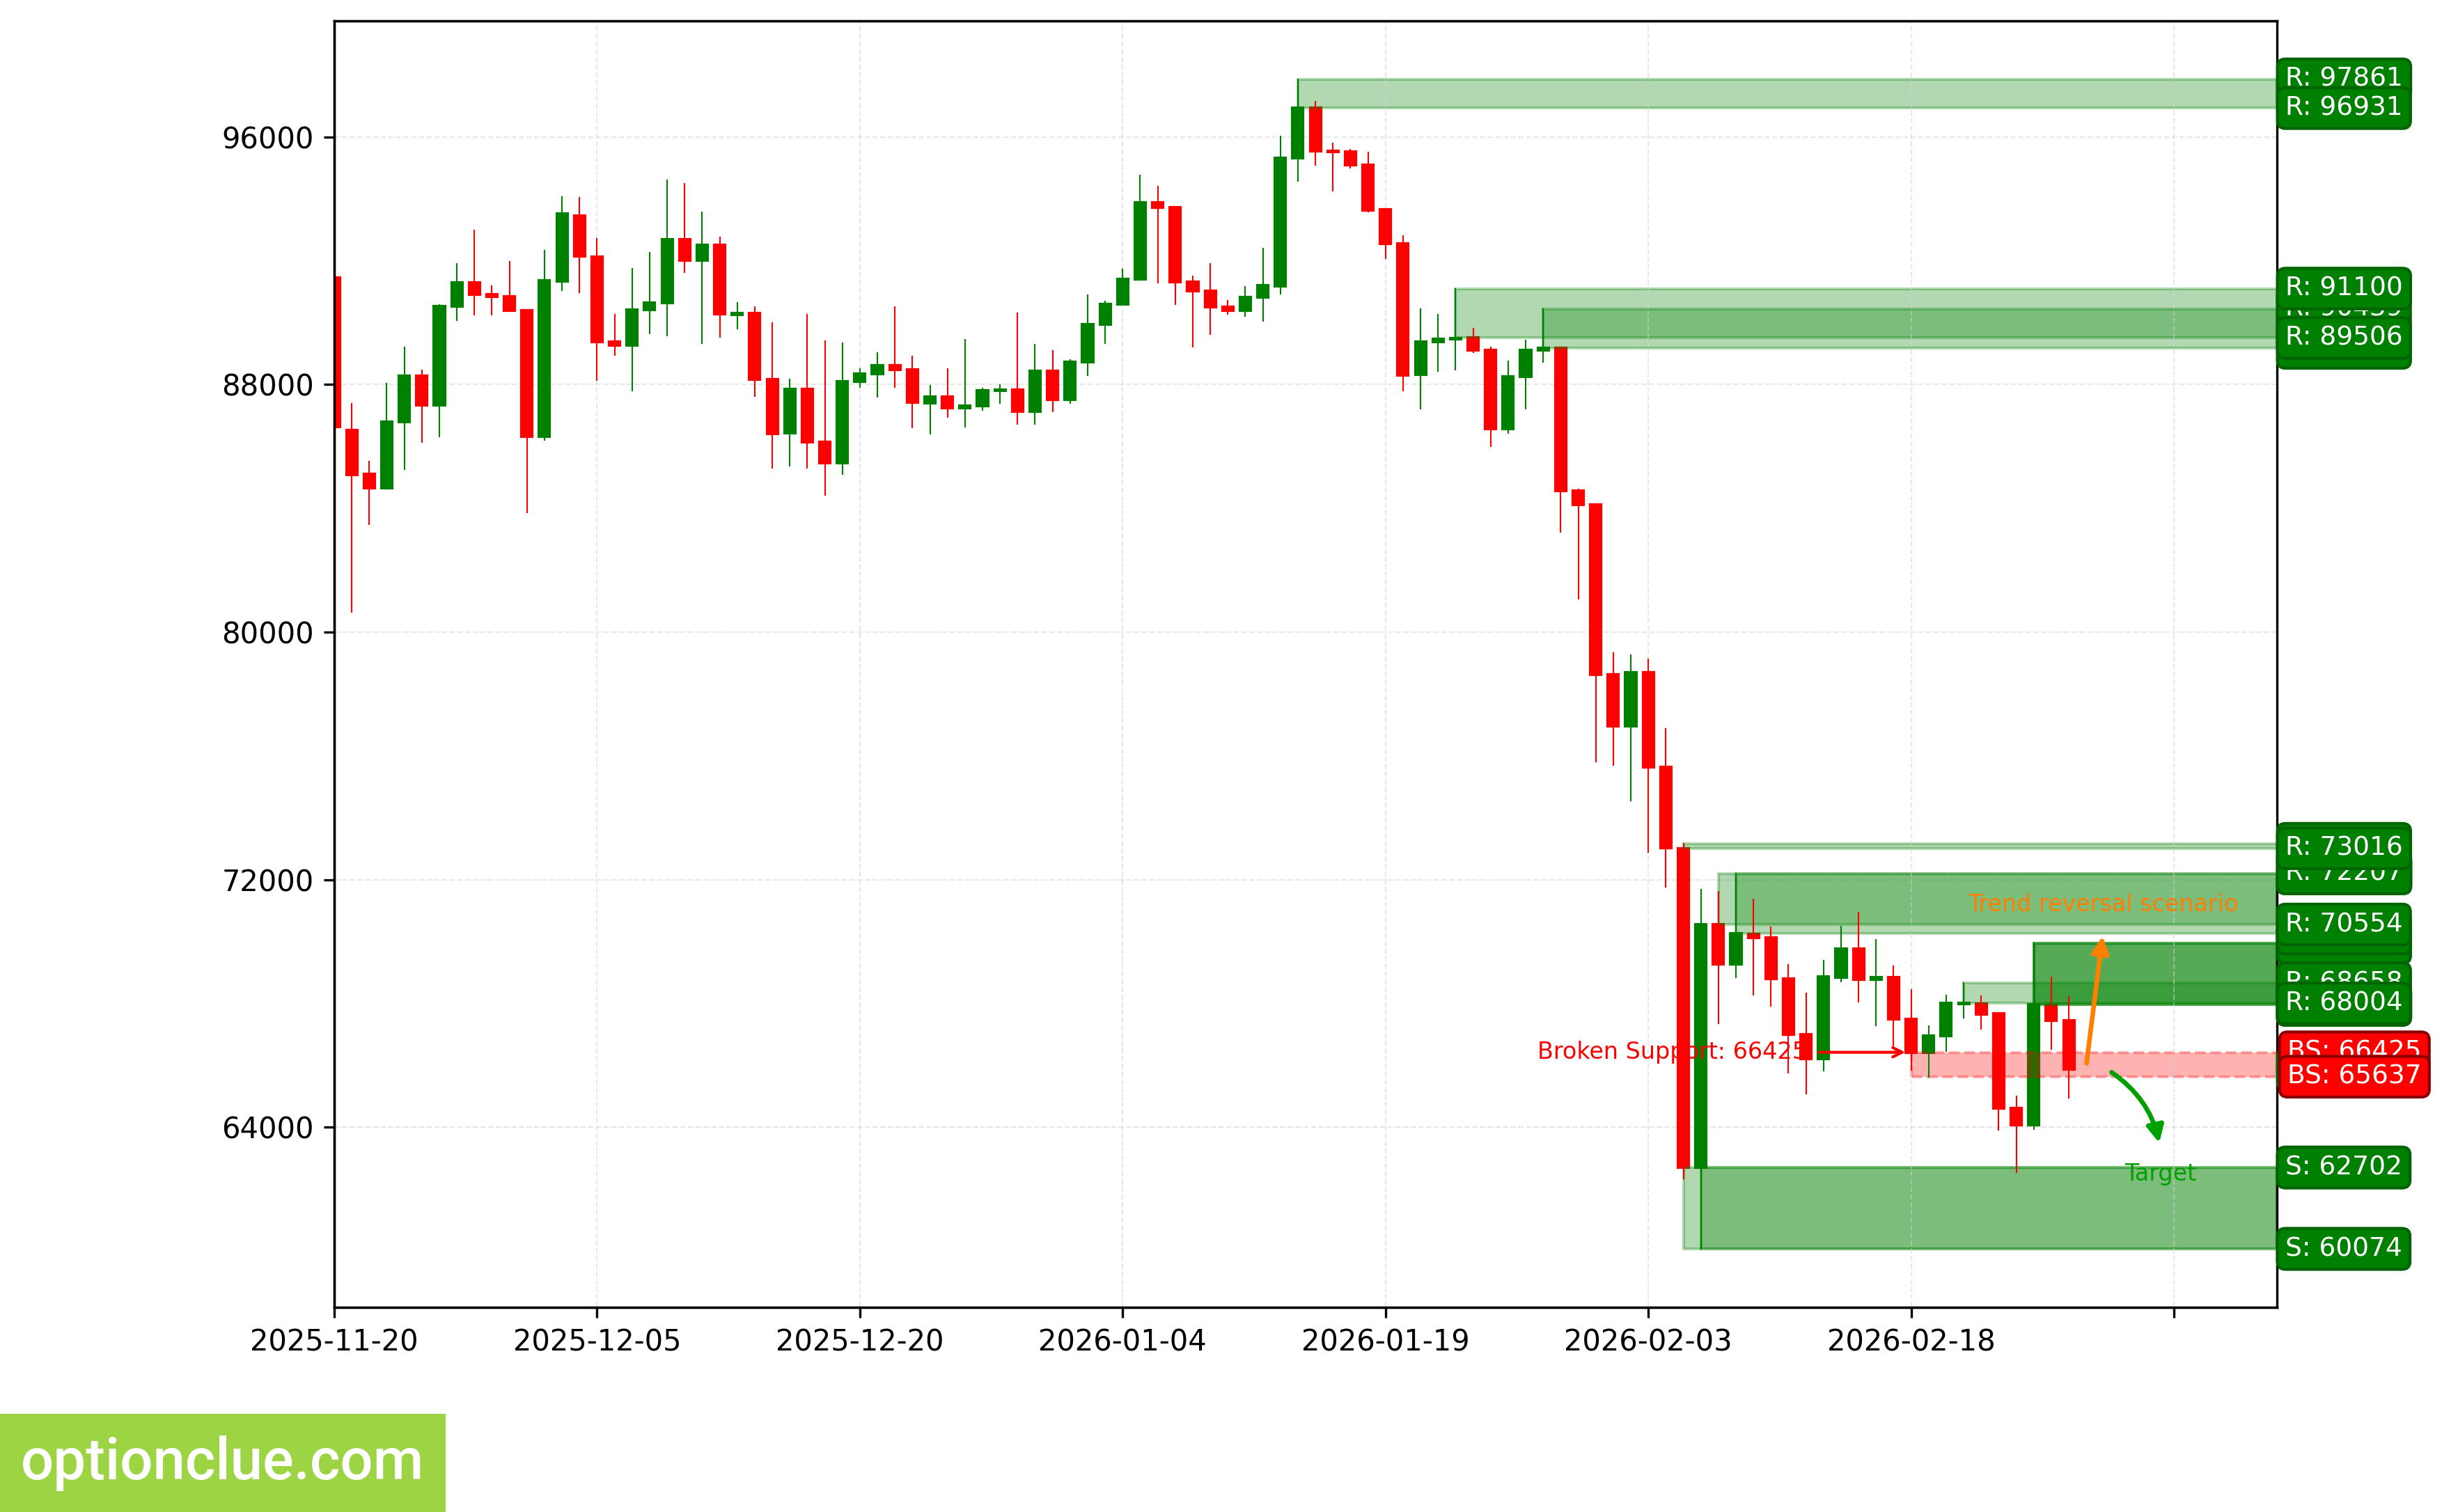
BTC. Technical analysis. D1.
Ether (ETH)
Trend has turned bullish, when resistance level (1974 — 1995) was broken last week. Breakout occurred 3 candlesticks ago. Corrective wave is developing. Entry point for buying on rebound may form after the current correction completes.
Intermediate target for the upward movement is the resistance level with boundaries 2055 — 2146. In case of successful trend development, a further target will be at the resistance level with boundaries 3022 — 3041.
Potential profit/risk ratio from current prices when setting targets and fixing risks based on daily timeframe levels may be small (approximately 0.4:1). When using a further target — more than 3:1. If the correction completes around the support level (1749 — 1821), the potential profit/risk ratio may be approximately 1.8:1. When choosing a further target — more than 8:1.
Long positions will remain relevant, as long as the market is above the nearest support level with boundaries 1749 — 1821. If the market successfully settles below this nearest support, the trend will reverse to the opposite (bearish).
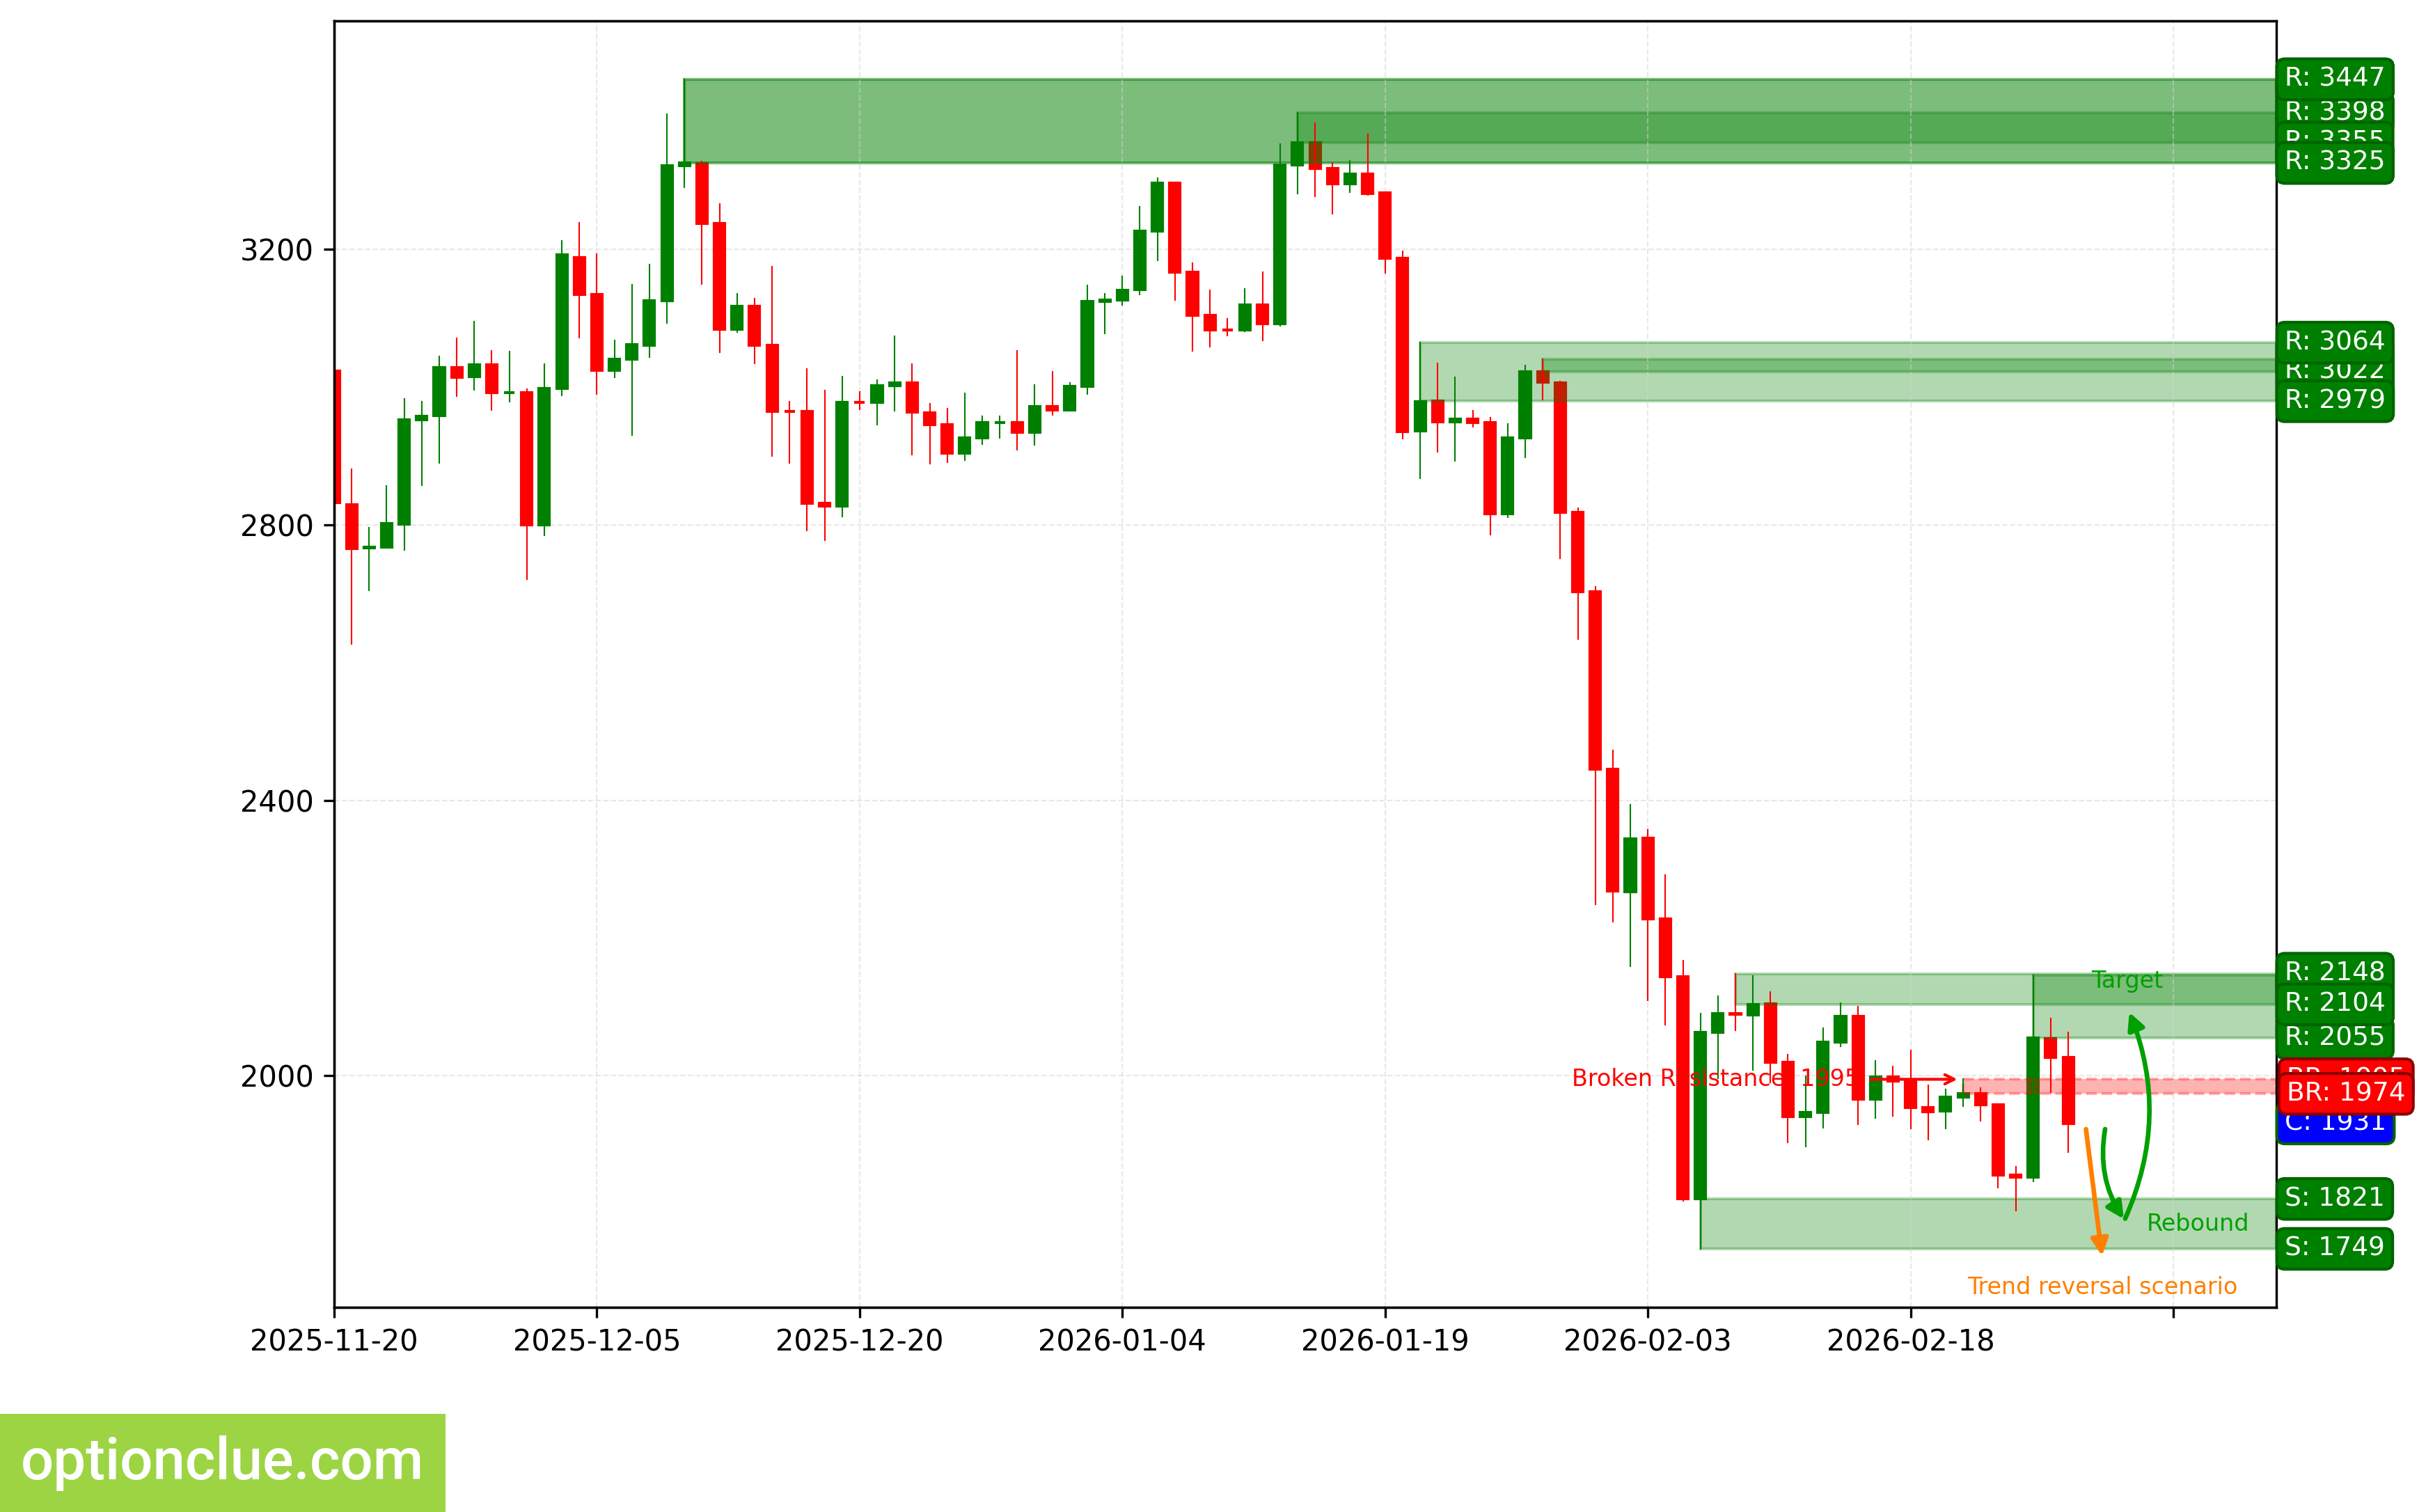
ETH. Technical analysis. D1.
Apple Inc (AAPL)
Bullish trend continues, corrective wave is developing. Entry point for buying on rebound may form after the current correction completes. The last broken level is resistance (264.35 — 266.82). Breakout occurred 4 candlesticks ago.
Upon resumption of the upward movement, the first target will be the resistance level with boundaries 274.95 — 276.11. A further target is the resistance level with boundaries 286.20 — 288.62.
Potential profit/risk ratio from current prices when setting targets and fixing risks based on daily timeframe levels may be small (approximately 0.7:1). When using a further target — approximately 1.4:1. If the correction completes around the support level (255.45 — 255.78), the potential profit/risk ratio may be more than 2:1. When choosing a further target — more than 4:1.
Long positions will remain relevant, as long as the market is above the nearest support level with boundaries 255.45 — 255.78. If the market successfully settles below this support, the trend will reverse to the opposite (bearish).
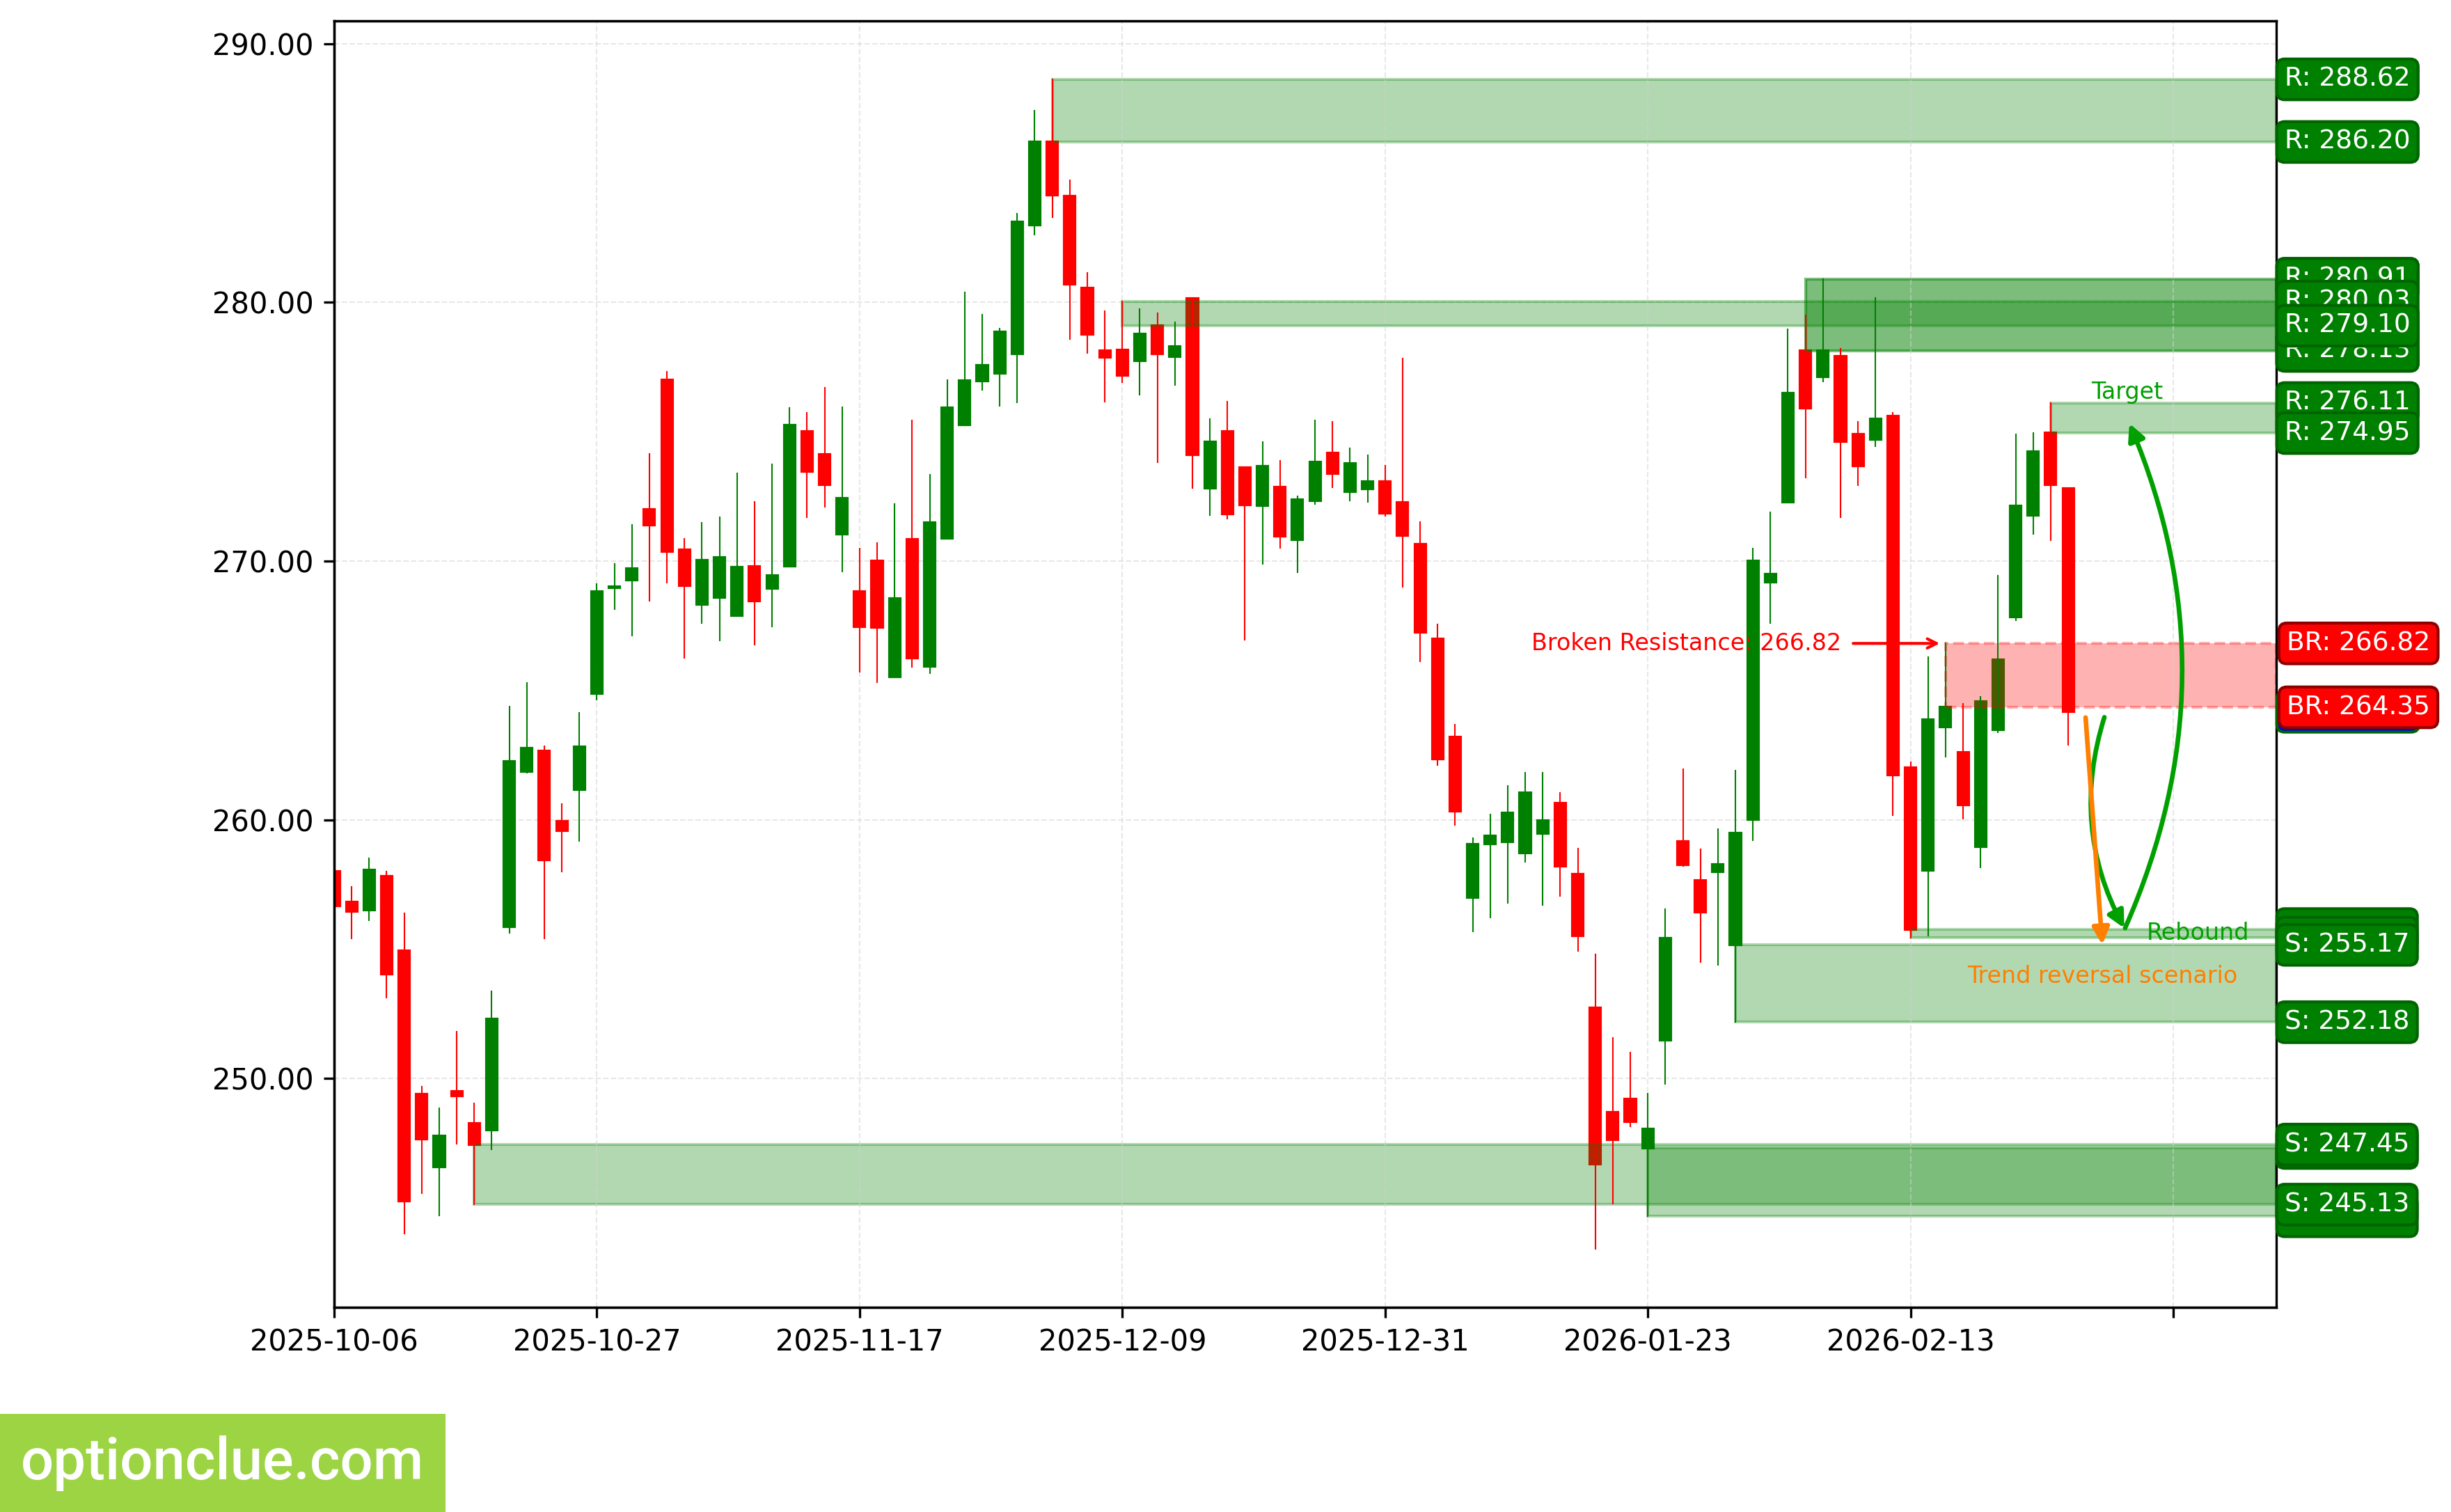
AAPL. Technical analysis. D1.
NVIDIA Corp (NVDA)
Trend has turned bullish, when resistance level (192.45 — 193.66) was broken 3 candlesticks ago. Corrective wave is developing. Entry point for buying on rebound may form after the current correction completes.
Intermediate target for the upward movement is the resistance level with boundaries 195.56 — 197.63. In case of successful trend development, a further target will be at the resistance level with boundaries 208.08 — 211.34.
Potential profit/risk ratio from current prices when setting targets and fixing risks based on daily timeframe levels may be around 1.5:1. When using a further target — approximately 2.5:1. If the correction completes around the support level (171.03 — 171.88), the potential profit/risk ratio may be around 3.5:1. When choosing a further target — around 5.3:1.
Long positions will remain relevant, as long as the market is above the nearest support level with boundaries 171.03 — 171.88. If the market successfully settles below this support, the trend will reverse to the opposite (bearish).
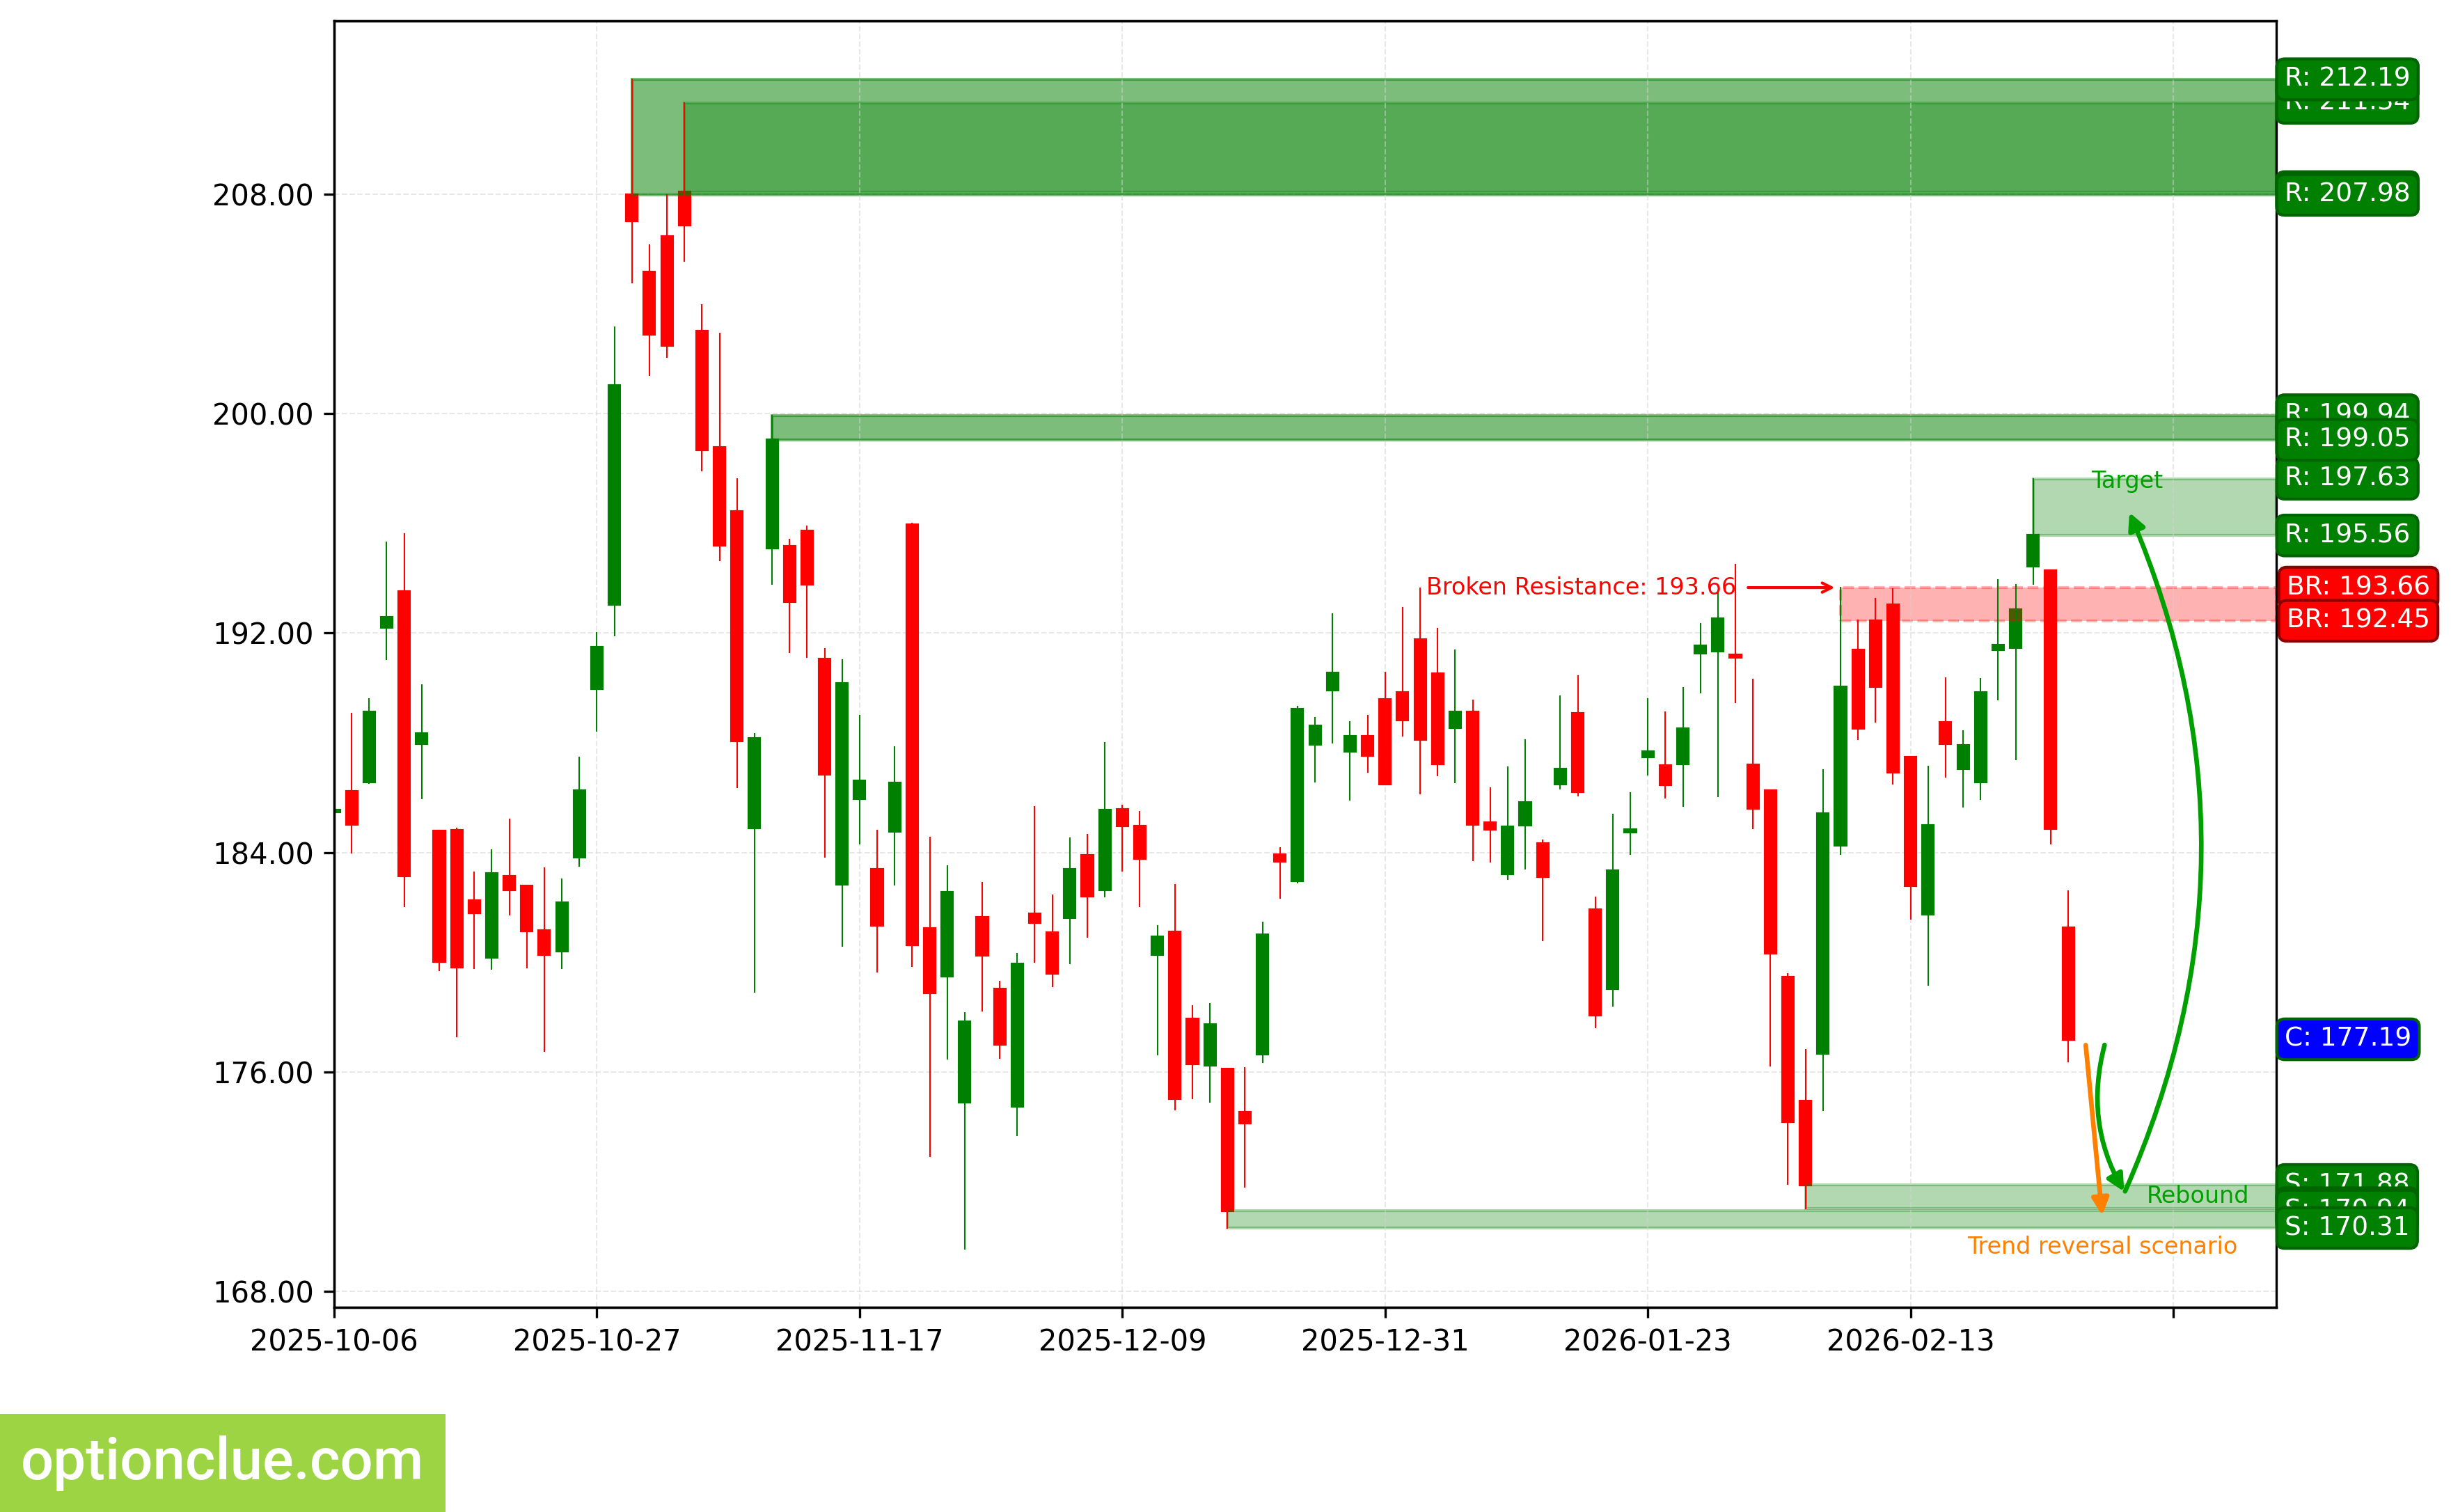
NVDA. Technical analysis. D1.
Tesla Inc (TSLA)
Bearish trend continues, correction likely completed 2 candlesticks ago, impulse wave is developing. The last broken level is support (414.50 — 416.56). Breakout occurred 17 candlesticks ago.
Intermediate target for the downward movement is the support level with boundaries 387.53 — 397.02. In case of successful trend development, a further target will be at the support level with boundaries 370.24 — 370.94.
Potential profit/risk ratio from current prices when setting targets and fixing risks based on daily timeframe levels may be small (around 0.2:1). When using a further target — around 1:1.
Short positions will remain relevant, as long as the market remains below the nearest resistance level with boundaries 417.40 — 420.34. If the market successfully settles above this nearest resistance, the trend will reverse to the opposite (bullish).
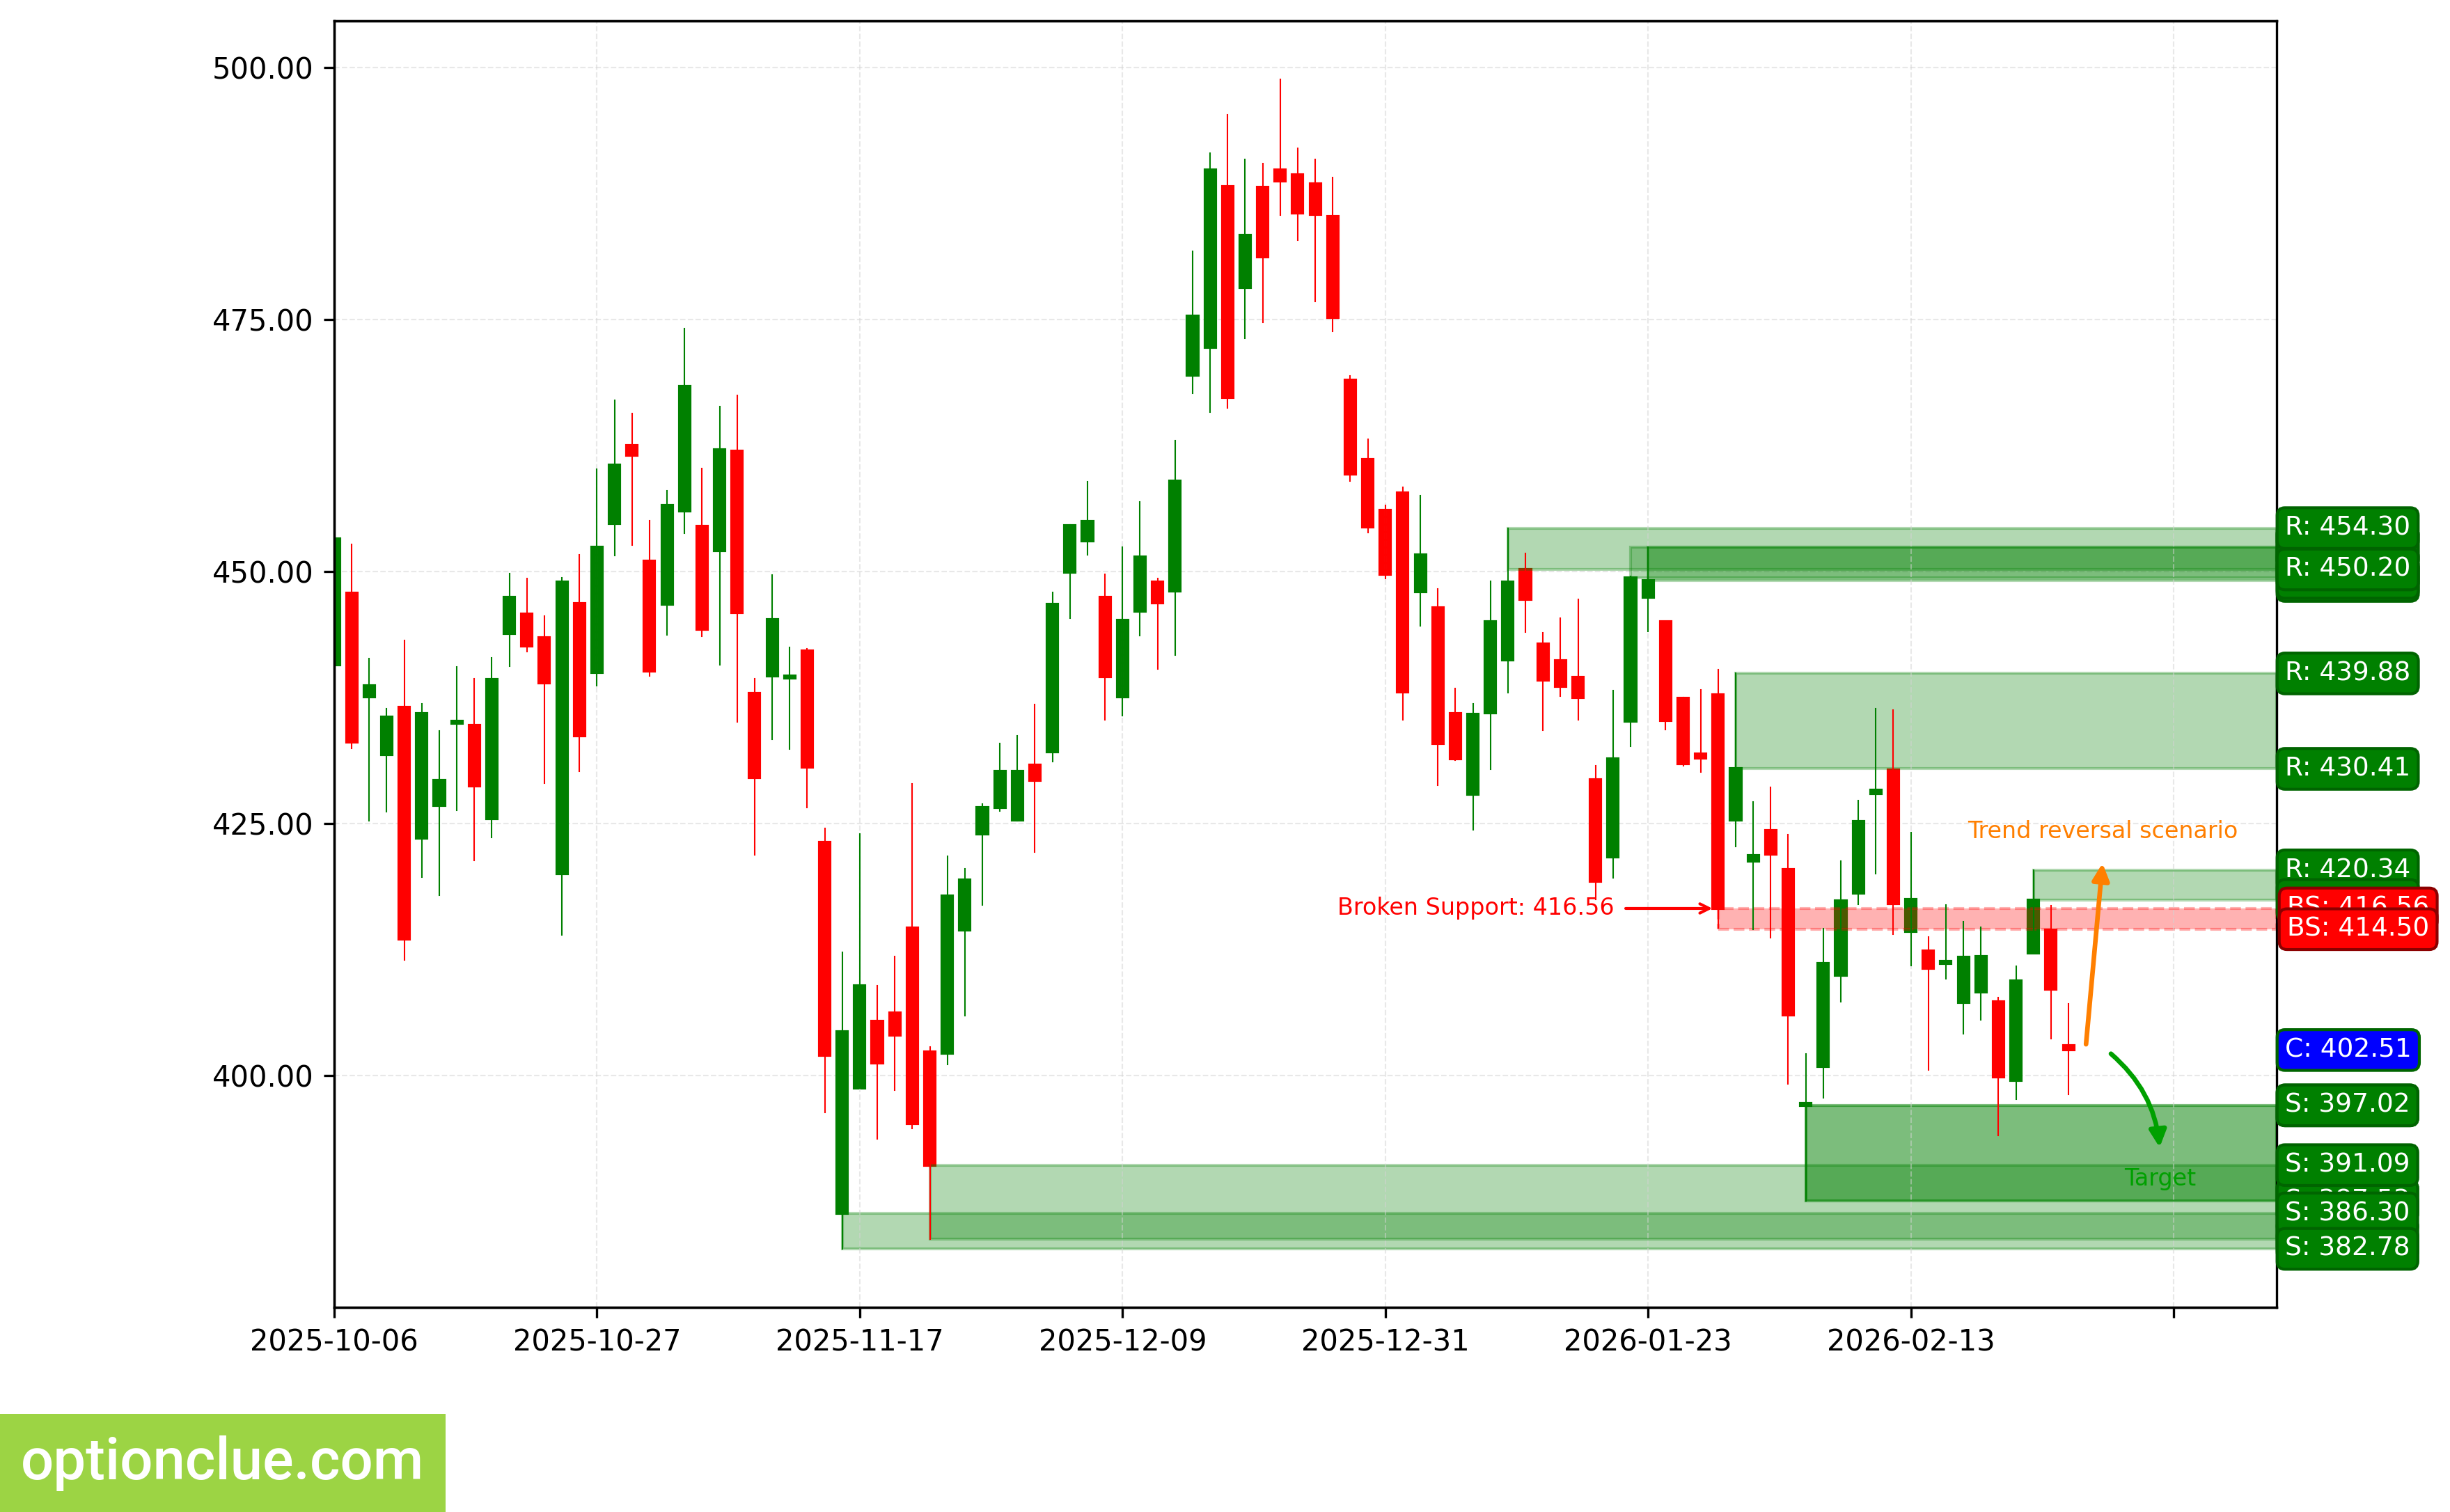
TSLA. Technical analysis. D1.
Summary
From the perspective of medium-term trading, financial instruments with correction close to completion on Daily and/or potentially the most promising profit/risk ratios include: USDCHF and AAPL. Soon may be worth attention depending on the depth of market correction: NVDA, TSLA.
The rest of the trading list financial instruments may also be interesting, but on these markets, Daily rebound signals will likely appear no earlier than in a week.