
[article-horurovni]
In this article we will discuss why we need a trading plan and what main points it should contain for successful trading in the market.
Chaotic and systemless trading is a kind of gambling and in the long-term such approach guarantees loss of funds and has nothing to do with trading.
Each trader who is responsible for the trading process must follow the clear principles when entering and exiting the market. Therefore, each trader needs a trading plan. And now we will analyze its key points.
Contents
- When is it possible to trade?
- Determination of the trend direction
- Choice of trading tactics
- Targets determination in trading
- Silver. Support and resistance levels application in the trading plan. Example 1
- NZDUSD. Levels application in the trading plan. Example 2
When is it possible to trade?
First of all it is necessary to understand if it is worth trading on this financial instrument (Figure1). If you see the market is in a trend, rises actively or declines, impulse and corrective waves are formed, then this is a trading market and you may trade.
Otherwise, if the market is in a flat or in a triangle, in other words, when the market is in a narrow price range, then you should not trade and you have to wait until the market gets out of this condition.
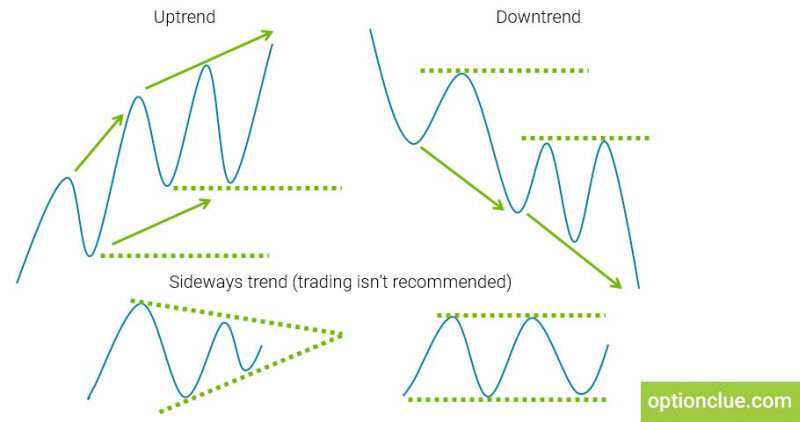
Figure 1. Market conditions
Determination of the trend direction
The next point of the trading plan is the determination of the direction for trading (Figure 2). As we discussed in the previous articles, the direction of the breakout indicates the direction of the trend. This is the first property of horizontal levels. Therefore, the last broken level indicates the direction in which you should trade.

Figure 2. Trade direction
Choice of trading tactics
In addition, you need to understand where the potential market entry and exit points are. Therefore, you have to decide which trading tactics is close to you – breakout or pullback trading (Figure 3).
When using the breakout trading system, the search for an entry point is carried out above the resistance level or below the support level. Once the market is closed and the important level is updated, it becomes possible to open a position in the breakout direction.
The second tactics is the pullback trading. In this case, you ignore the breakout signal and wait for the correction. Only after its completion and the pullback candle formation, you should determine the entry points that is on the current or smaller timeframe.
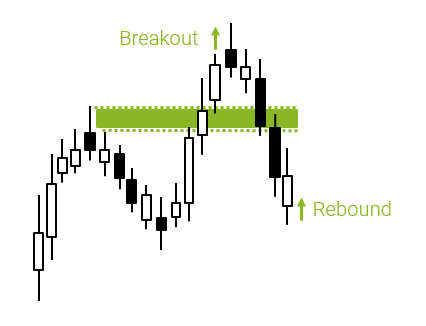
Figure 3. Trading tactics
Targets determination in trading
In order to understand whether it is worth opening a position when a breakout or pullback signal appears, you have to determine potential targets (Figure 4) and understand when to exit the market. You should also take into account which marks the price can reach, where the movement can stop and at which point the loss must be fixed, if the market goes in the unfavorable direction. In this situation the properties of horizontal levels, which we analyzed earlier, can help us.
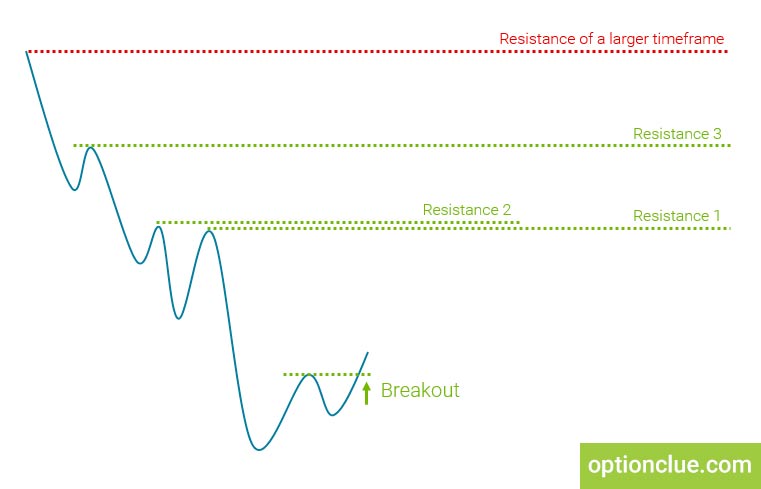
Figure 4. Targets determination
Apart from this, each trader should take into account risks in his trading plan. Before opening a position, you must clearly understand what maximum level of risk is acceptable in each trade as a percentage of your trading capital.
Silver. Support and resistance levels application in the trading plan. Example 1
Let’s take a few examples and see how exactly the levels help determine the targets and market entry points.
The first asset that we will examine is silver, the Daily timeframe since February.
We have a bull trend. If we were trading this trend, we would close some positions and a correction or a market reversal could be expected.
On March the 2nd a huge bear candle is formed, which broke through the support level formed a week before. The borders of this level are from 17.81 to 17.93. After the candle closing a sell breakout signal has been formed. The market is closed in bear condition, which means that the bull trend ceases to exist and the bear trend is dominating now on the Daily timeframe (Figure 5).
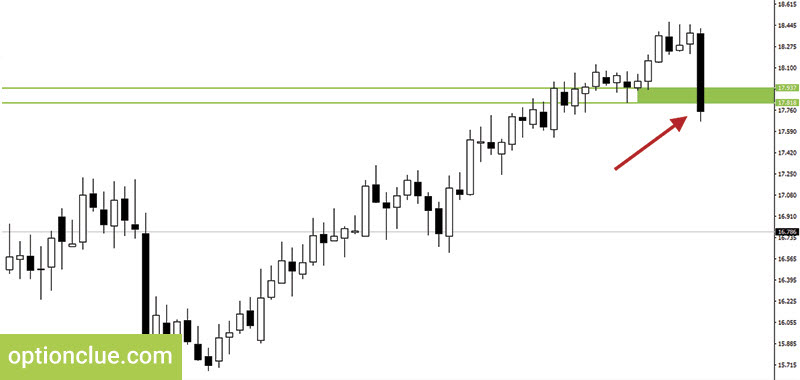
Figure 5. Silver. Support level breakout
Traders, who trade breakouts, understand at such moments that the market has formed a potential entry point. However, whether to open a position or refrain from entering the market depends on what risks to take and what is the profit potential.
When opening sell positions the targets are the support levels. In this case, the next support level was formed at the end of January after the bull candle formation. This candle overlapped three previous bear ones which means that we could plot a completed support level. The upper border of this level is 16.74, the lower border is 16.61.
Before opening a position you have to determine the market exit points. Defense stop loss orders, when opening a bear position, are usually placed above the nearest resistance level. This level is in the range of prices from 18.47 to 18.38 (Figure 6).
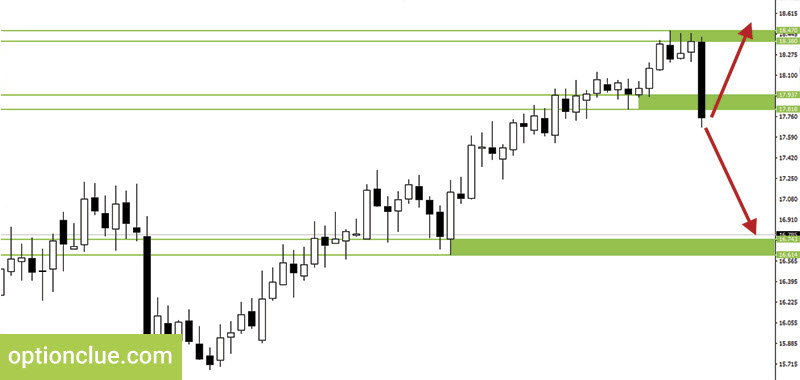
Figure 6. Silver. Stop loss and Take profit placement
We have determined the point for a stop loss placement. Now it is necessary to estimate the market movement potential. The potential profit is desirable to be at least twice the risk and the risk-reward ratio should be at least one to two.
The target determination for the full or partial close of the position can also be based on the levels as, according to one of the properties of horizontal levels, the price will be more likely to bounce off the level than it will break it through. This is especially true for large timeframes, for instance, the Daily.
There is a potential for the movement, but as the market approaches the target, it can slow down, transform into a flat or a triangle and a correction may start (Figure 7).
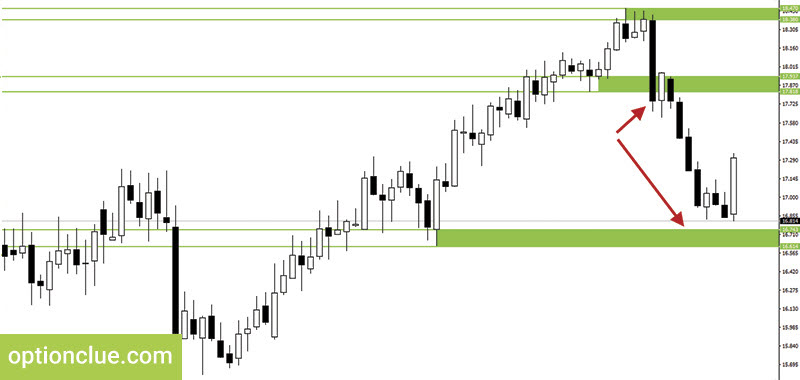
Figure 7. Silver. The first target for downward movement
If the price does break through the support level, the next targets can also be determined according to the nearest levels. In our situation such target is around the levels formed at the end of the year. The lower border is 15.61, the upper border is 15.72. You can use as targets the first, second or third level of the current timeframe or the nearest level of the larger timeframe (Figure 8).
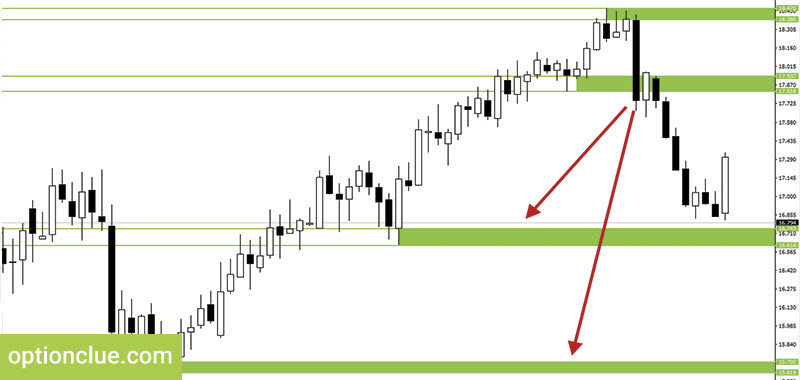
Figure 8. Silver. Targets for movement
Having plotted the horizontal levels, it is possible to understand where it is necessary to place a defense stop loss order and the order for profit fixing that is a take profit. Before entering the market, I recommend you to estimate possible risks in trading and profit potential. Not each breakout or pullback is noteworthy.
Situations are different. The price does not always move linearly after the level breakout. Often correction starts after one or two candles. In our situation the correction lasts only during one day. After that the market dropped down.
After the breakout the price sometimes moves in the direction we need. However, after this ambiguous situations can take place. It means that the price is at one point and flats and triangles can appear. In such situations you have to replot levels. If the price is fluctuating between newly formed levels for a long time, I recommend you to close positions.
NZDUSD. Levels application in the trading plan. Example 2
Let’s take one more example. It’s New Zealand dollar, the Daily timeframe. The support level is formed in the market. The lower border is 0.72221 the upper border is 0.7240. The bull movement ends up overlapping and the level has been formed.
After that the price is rising for some time, but on February the 9th the market is closed below the support level. This means that in terms of technical analysis the trend has reversed and the bears begin to dominate in the market (Figure 9).
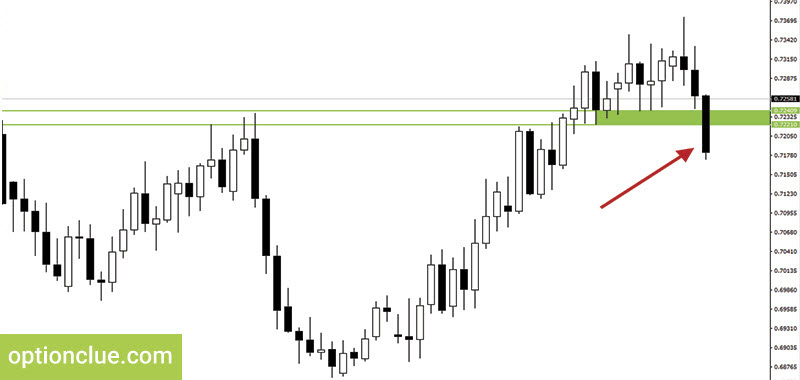
Figure 9. NZDUSD. Support level breakout
The question is what to do in this case. After the candle closing a level breakout signal has been formed. This means that traders, who prefer such trading tactics, can open the sell positions.
However, the question arises whether to enter the market or not. Search for the nearest resistance level, where defense orders are set, can help us. A reliable stop loss when opening a sell position is always placed above the upper border of the resistance level. If the price mark is about 0.7374 then stop loss can be set around 0.7385 (Figure 10).
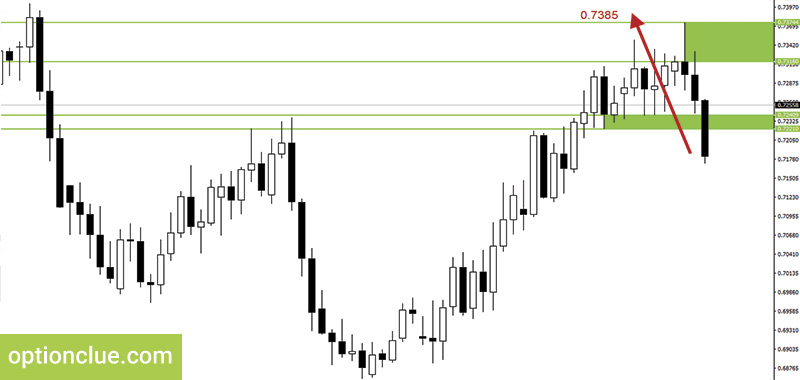
Figure 10. NZDUSD. Price for stop loss placement
The next question is how to determine the target. In the previous example we’ve determined the targets on the Daily timeframe which was used to seek for the market entry point.
However, timeframes of a higher value are often used to determine targets. For example, when trading on the Daily timeframe, the target is determined by the Weekly one.
The nearest support level of the Weekly timeframe is the potential target which is in the area of 0.6866. This is the upper border of the level. You can fix profit at this point (Figure 11).
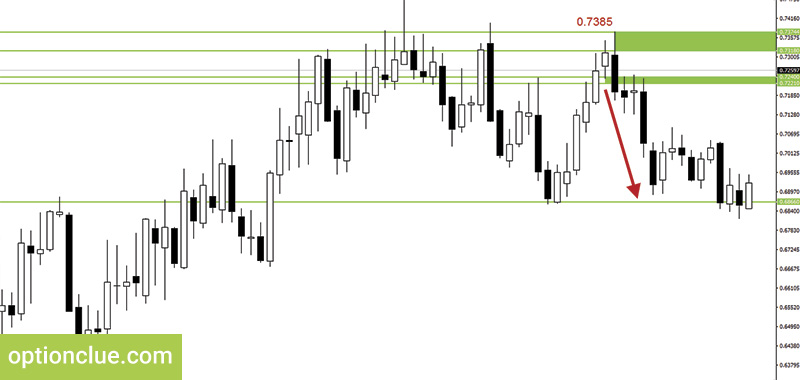
Figure 11. NZDUSD. Weekly target
If you trade on the Daily timeframe you can place take profit orders in accordance with daily targets which will often coincide with the weekly ones. But in order to see a complete set of prices for setting targets you have to plot levels on several timeframes.
Anyway, when entering the market you have to calculate the profit and risk potential, to understand where the position will be closed if the price moves against you and where it is necessary to fix the profit.
Having determined the targets, you can calculate the risk-reward ratio potential. If the risk-reward ratio is at least one to two, this is a good position.
If we traded only on the Daily timeframe and did not see larger timeframes, then the first target would be closer. I recommend to indicate the first target on the current timeframe. In this example it’s the Daily timeframe. And after that I recommend to look at the targets plotted on larger timeframes.
Let’s summarize. A good trading plan contains the principles of entering and exiting the market and algorithm for determining the trend direction and setting targets. Apart from this, the trading plan should contain requirements for the minimum risk-reward ratio and the principle of the position sizing.
Traders often make the process of plotting horizontal support and resistance levels much more difficult than it needs to be. Some of them tend to complicate this task by plotting unnecessary levels confusing them in determining further price movements in directed trading. After getting the Levels indicator you won’t have any difficulty in this due to the simplicity of its use. It can help not only identify price zones where the market movement can slow down or price reversal is likely to occur but also find entry signals that appear during a deep market correction or calculate stop-loss and take-profit.
Good luck in trading!