




We review the most important levels for key financial instruments and probable scenarios.
Key topics
- Euro (EURUSD)
- Swiss Franc (USDCHF)
- Japanese Yen (USDJPY)
- Canadian Dollar (USDCAD)
- Australian Dollar (AUDUSD)
- Bitcoin (BTC)
- Ethereum (ETH)
- Apple Inc (AAPL)
- Tesla Inc (TSLA)
- Summary
Euro (EURUSD)
The trend changed to bearish when the support level (1.1376 — 1.1383) was broken on the last closed candlestick. An impulse wave is developing.
The intermediate target for the downward movement is the support level with boundaries 1.1324 — 1.1359. In the event of a successful trend development, the further target will be at the support level with boundaries 1.1211 — 1.1280.
If the next correction ends near the resistance level (1.1464 — 1.1482), the potential profit/risk ratio could be approximately 1.6:1. If choosing the further target — around 2.8:1. If the correction ends near the last broken level (1.1376 — 1.1383), the potential profit/risk ratio could be small (about 0.1:1). For the further target — also small (approximately 0.6:1).
Short positions will remain relevant as long as the market is below the nearest resistance level of the daily timeframe with boundaries 1.1464 — 1.1482. If the market successfully consolidates above this nearest resistance, the trend will change to the opposite (bullish).
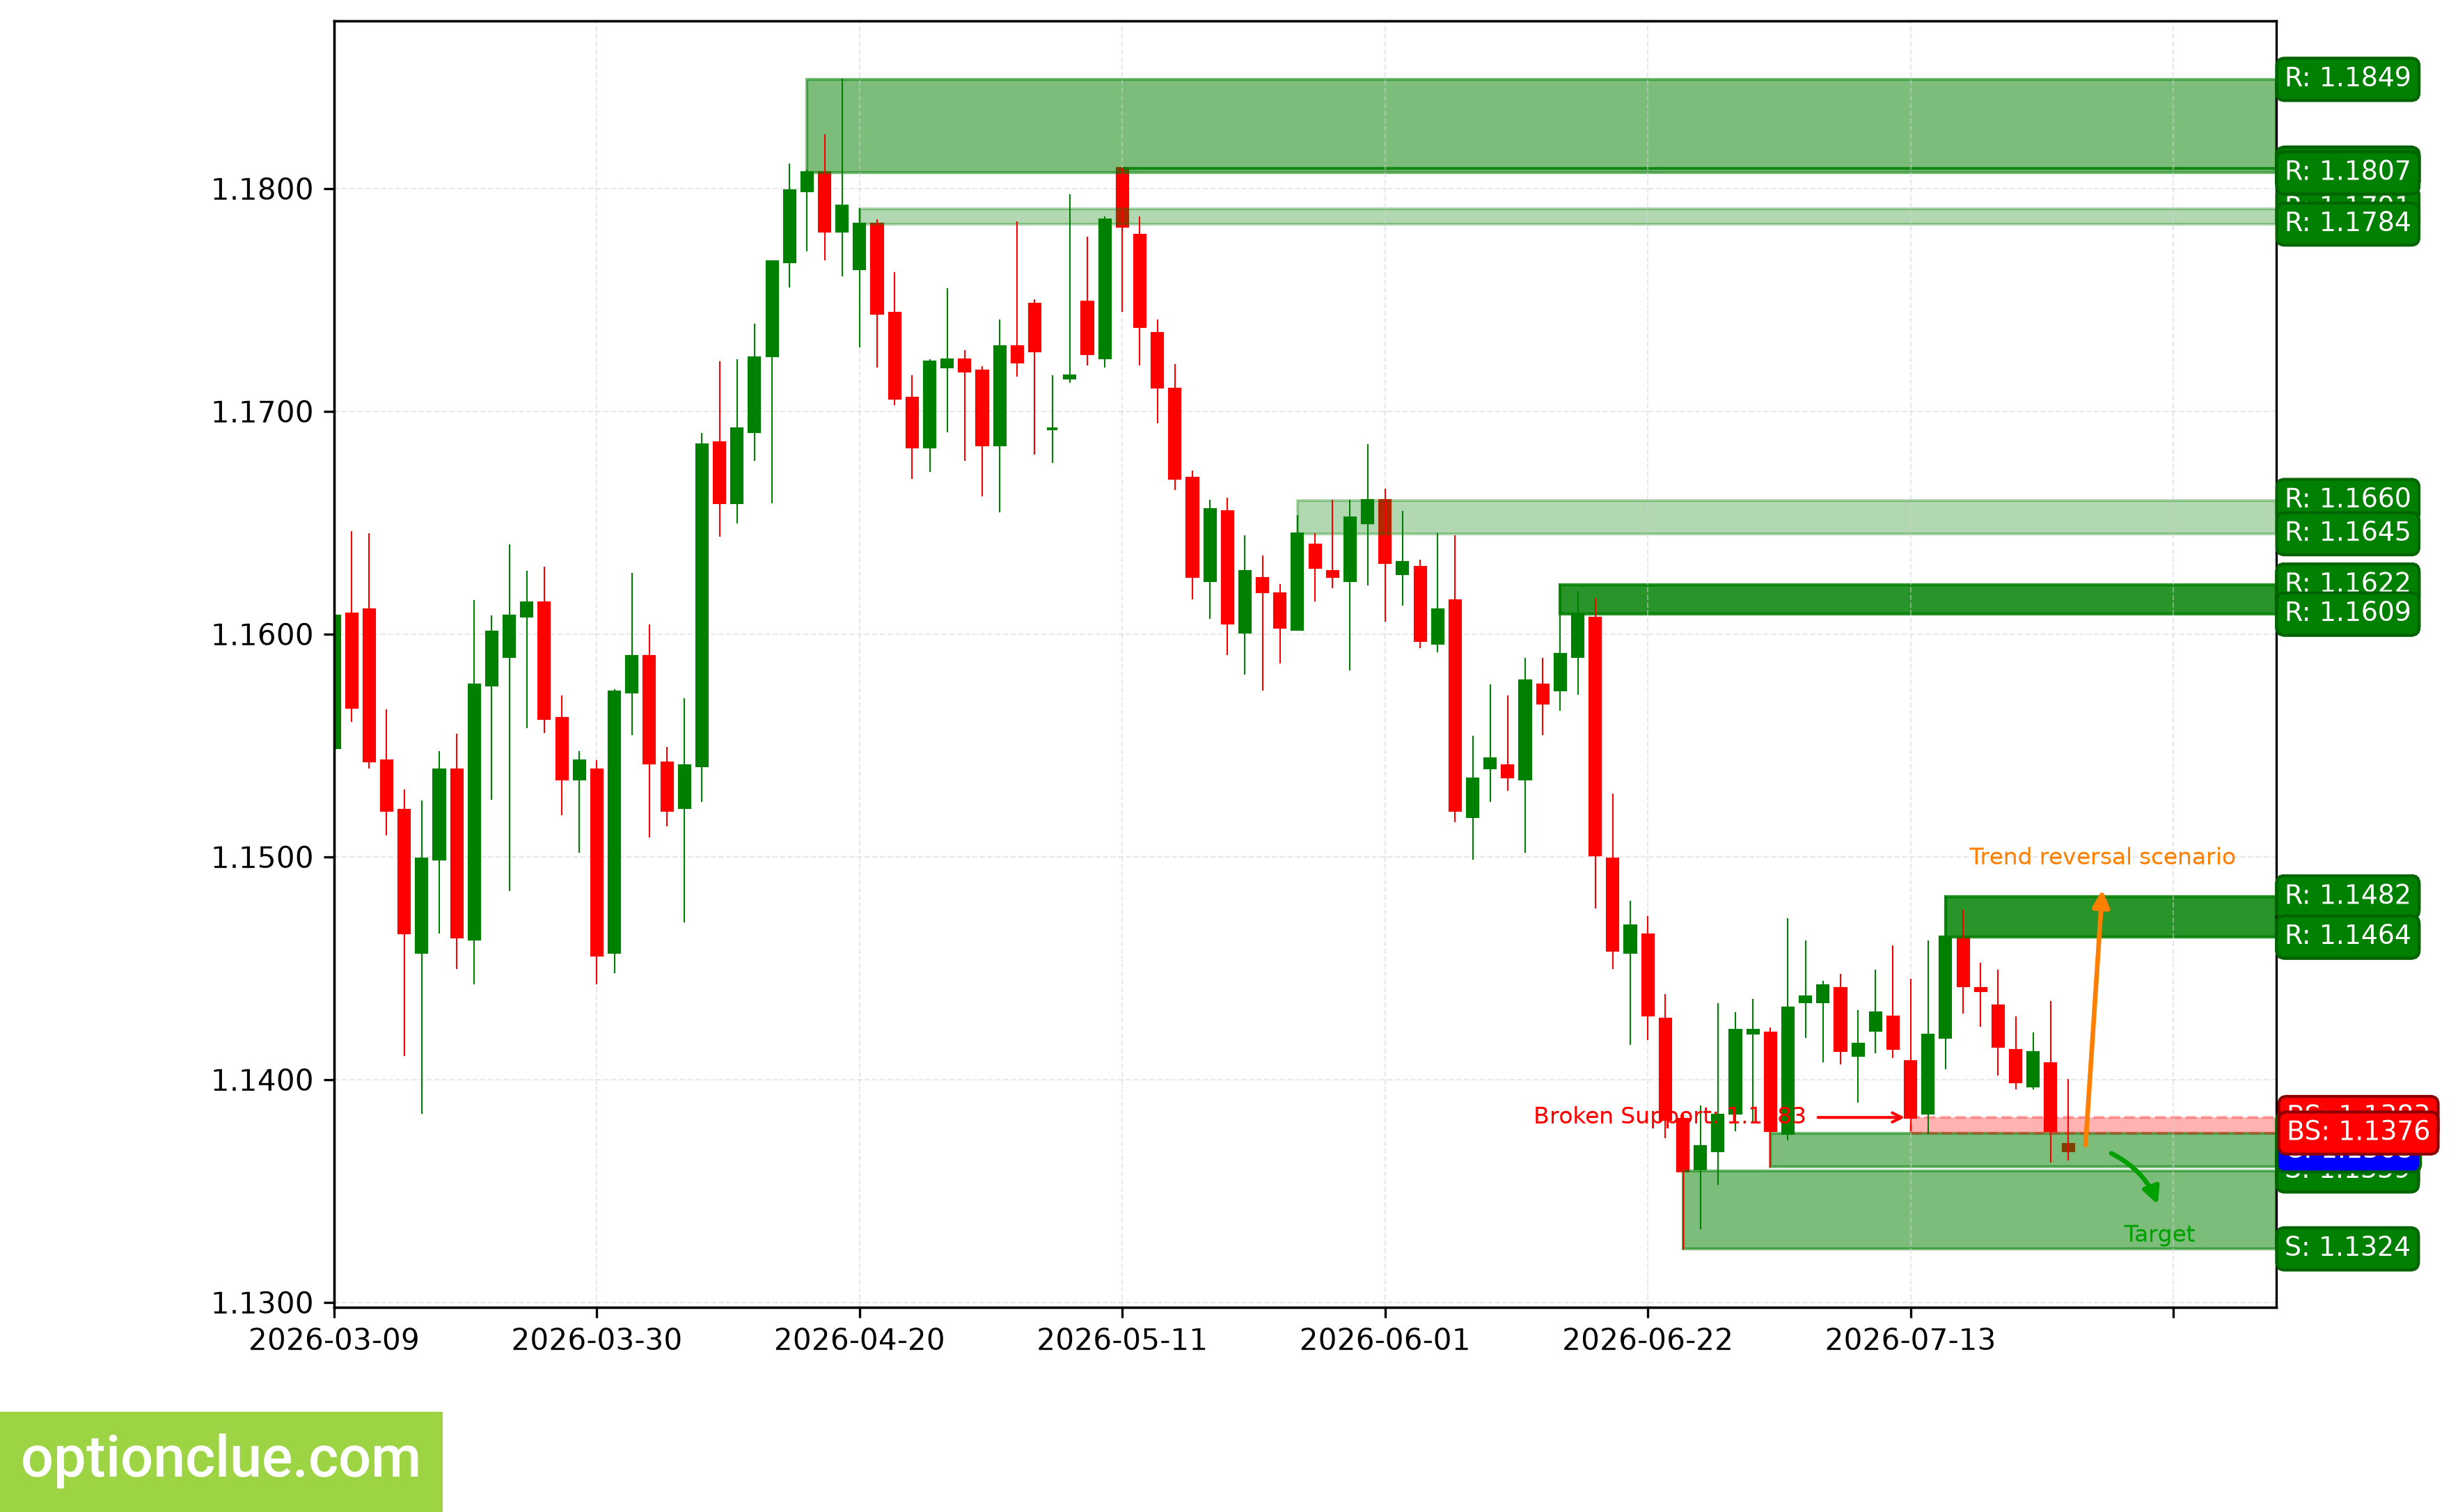
EURUSD. Technical analysis. D1.
Swiss Franc (USDCHF)
The bullish trend continues, an impulse wave is developing. The last broken level is resistance (0.8089 — 0.8114). The breakout occurred 4 candlesticks ago.
The intermediate target for the upward movement is the resistance level with boundaries 0.8189 — 0.8215. In the event of a successful trend development, the further target will be at the resistance level with boundaries 0.8275 — 0.8348.
If the next correction ends near the support level (0.8032 — 0.8045), the potential profit/risk ratio could be approximately 2:1. For the further target — more than 3:1. If the correction ends near the last broken level (0.8089 — 0.8114), the potential profit/risk ratio could be insignificant (about 0.7:1). If choosing the further target — around 1.3:1.
Long positions will remain relevant as long as the market is above the nearest support level of the daily timeframe with boundaries 0.8032 — 0.8045. If the market successfully consolidates below this support, the trend will change to the opposite (bearish).
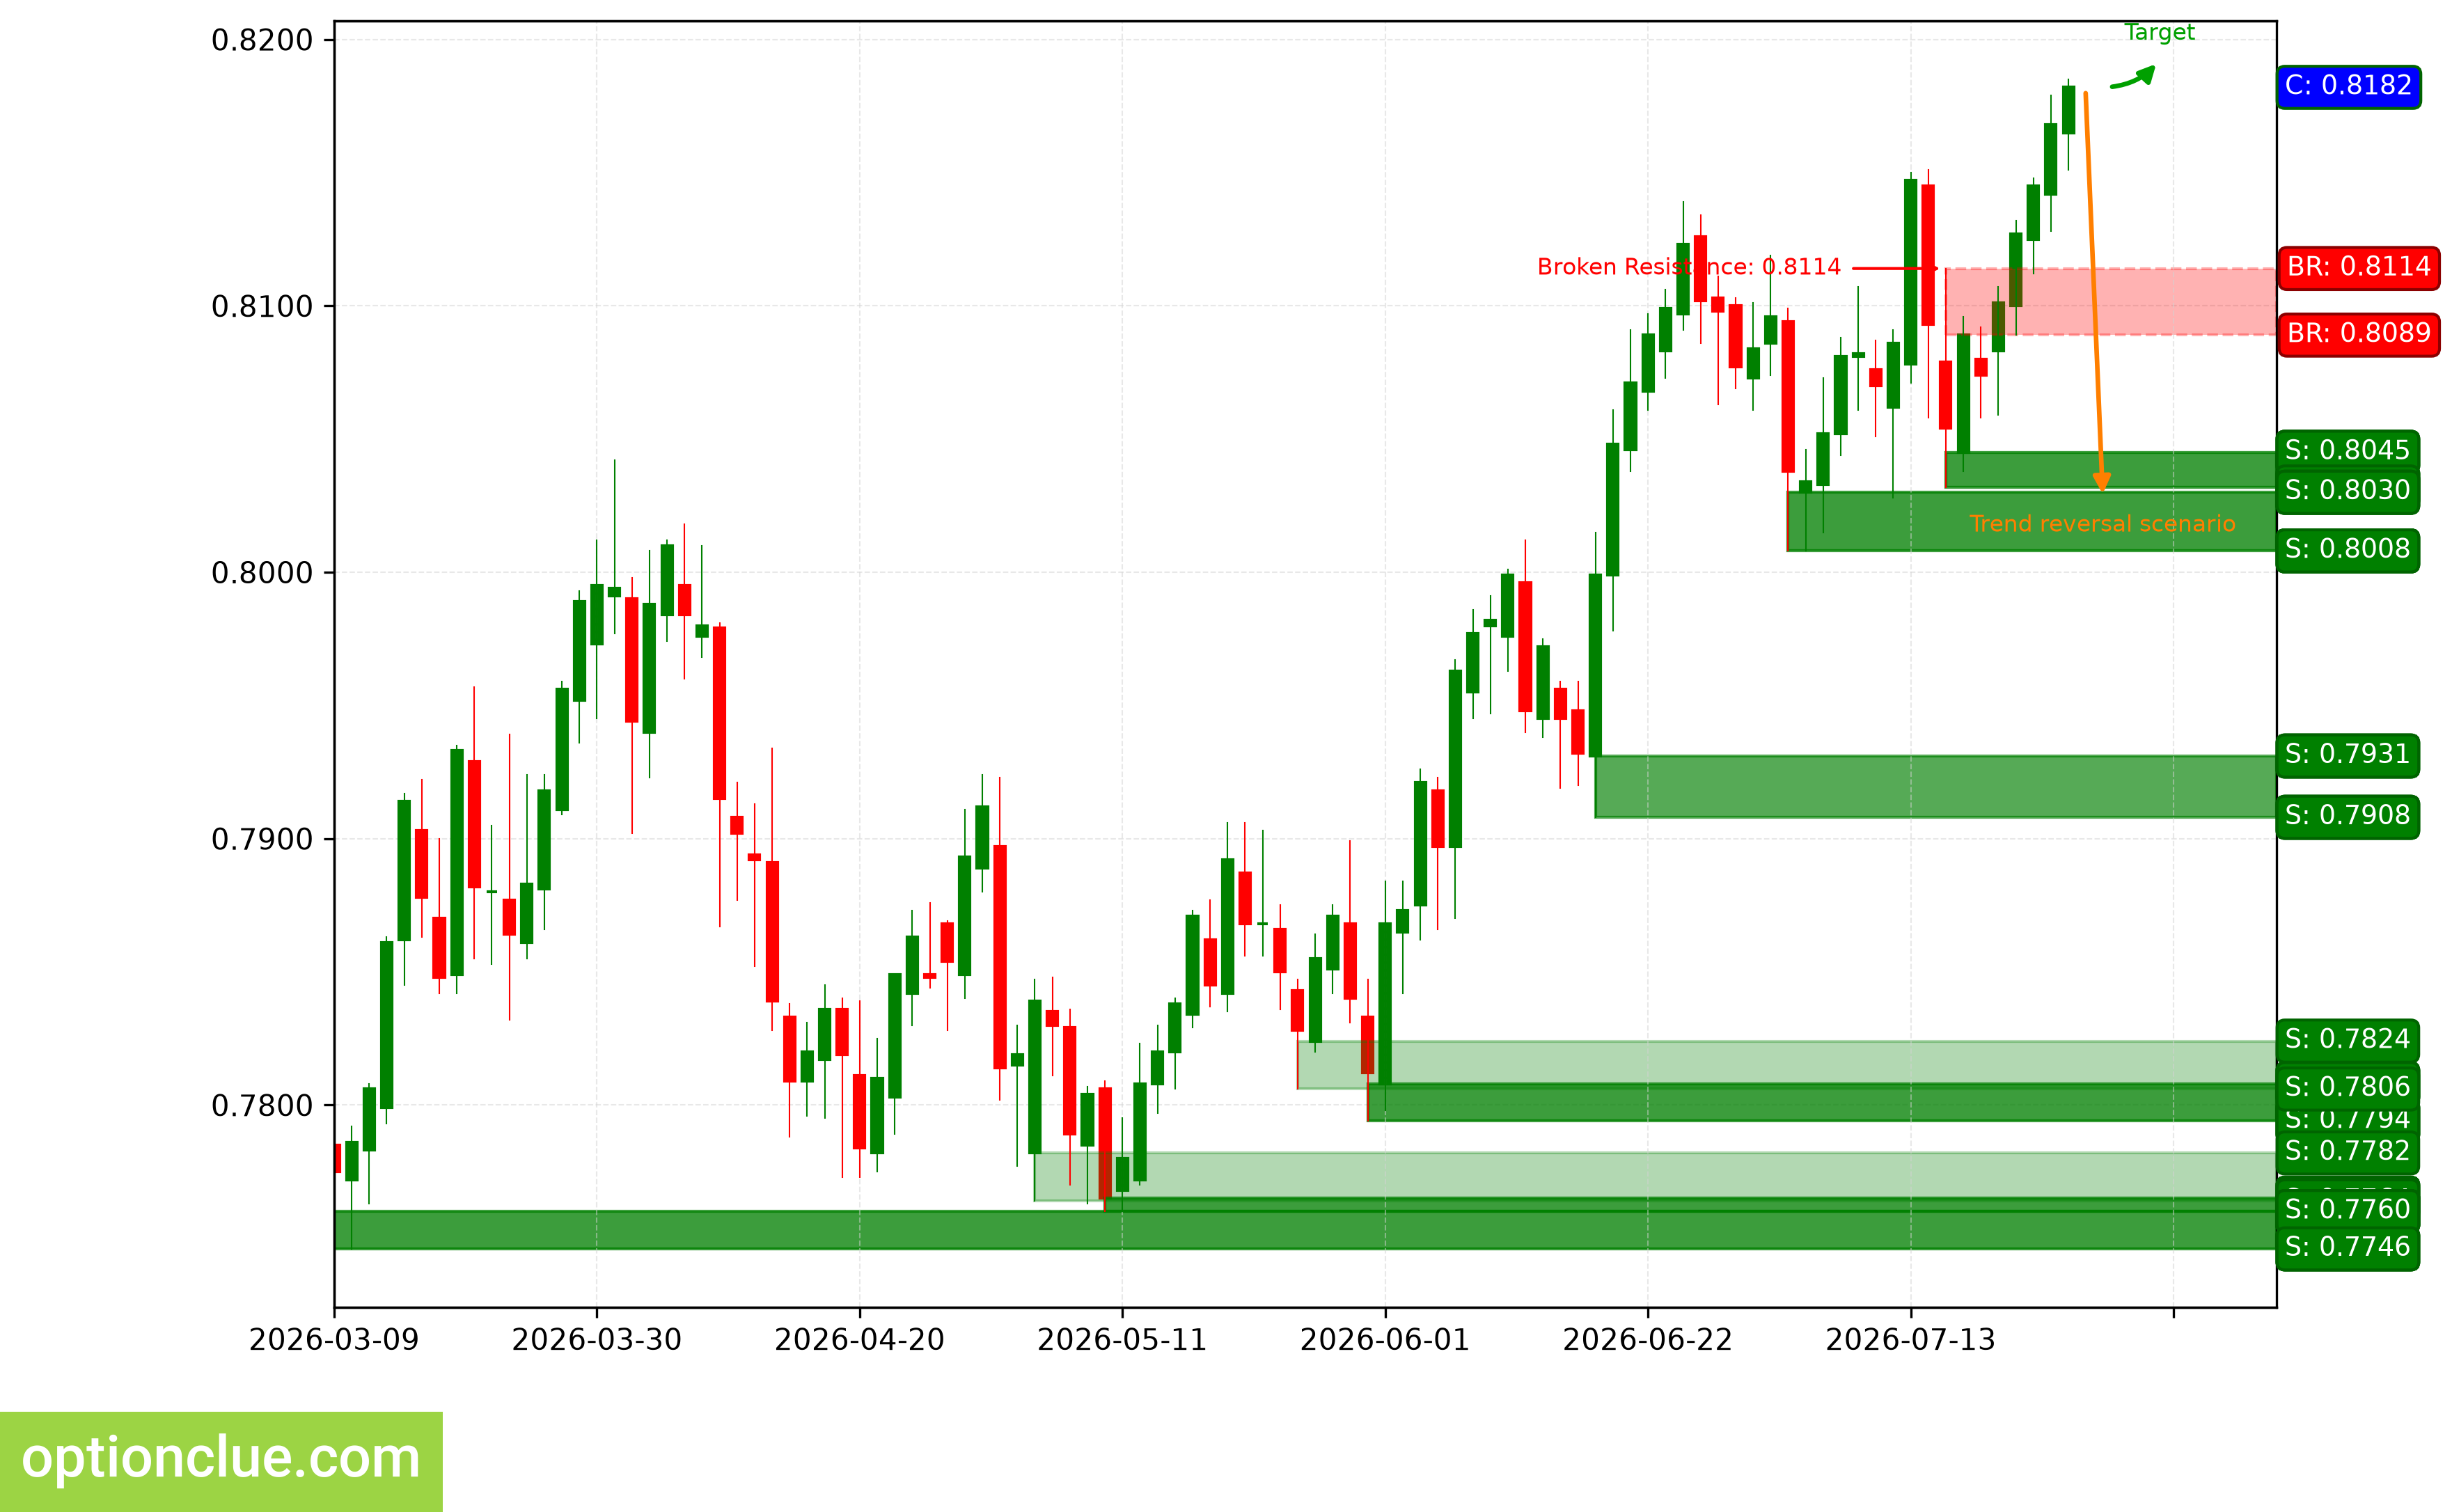
USDCHF. Technical analysis. D1.
Japanese Yen (USDJPY)
The bullish trend continues; 2 candlesticks ago, a correction likely ended, and an impulse wave is now developing. The last broken level is resistance (162.44 — 162.48). The breakout occurred 5 candlesticks ago.
No relevant levels have been found to determine targets for the upward movement on the current timeframe.
Long positions will remain relevant as long as the market is above the nearest support level of the daily timeframe with boundaries 161.26 — 161.66. If the market successfully consolidates below this nearest support, the trend will change to the opposite (bearish).
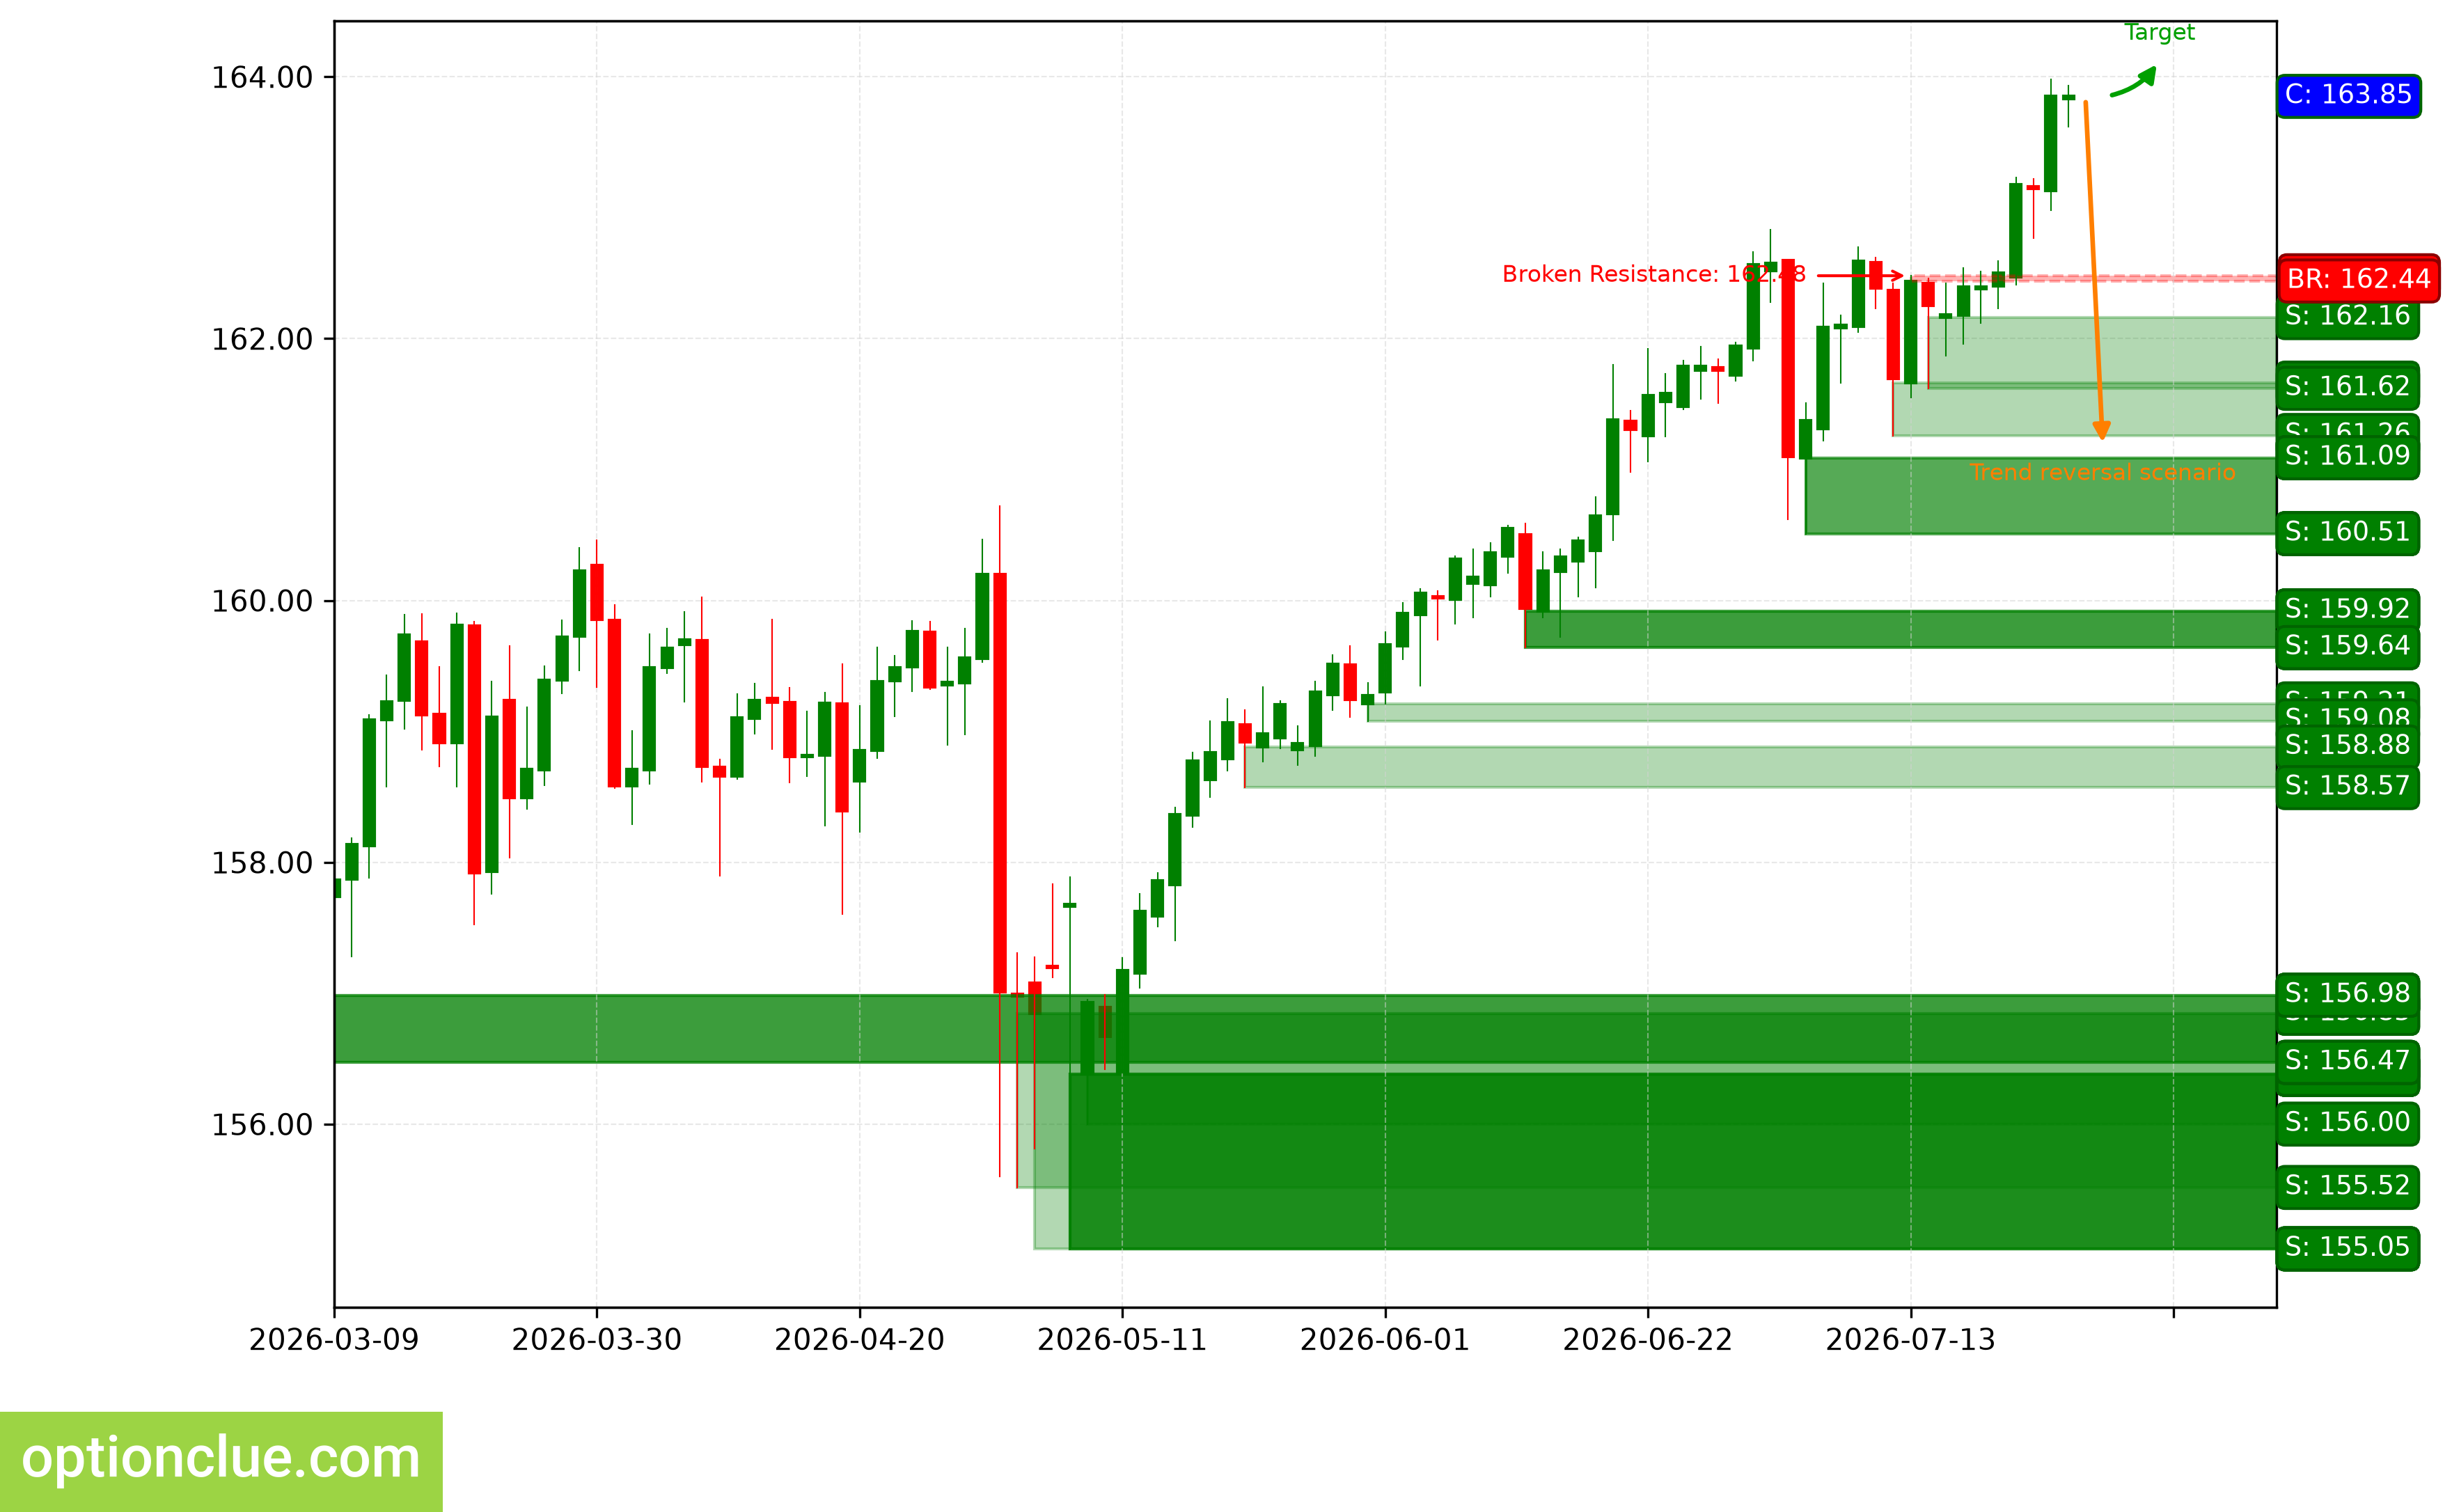
USDJPY. Technical analysis. D1.
Canadian Dollar (USDCAD)
The bearish trend continues; 9 candlesticks ago, a correction ended, and an impulse wave is developing. The last broken level is support (1.4167 — 1.4189). The breakout occurred 11 candlesticks ago.
The intermediate target for the downward movement is the support level with boundaries 1.4001 — 1.4013. In the event of a successful trend development, the further target will be at the support level with boundaries 1.3897 — 1.3939.
The potential profit/risk ratio from current prices, when setting targets and fixing risks according to the levels of the daily timeframe, could be around 1:1. When using the further target — approximately 1.8:1.
Short positions will remain relevant as long as the market remains below the nearest resistance level with boundaries 1.4108 — 1.4111. If the market successfully consolidates above this nearest resistance, the trend will change to the opposite (bullish).
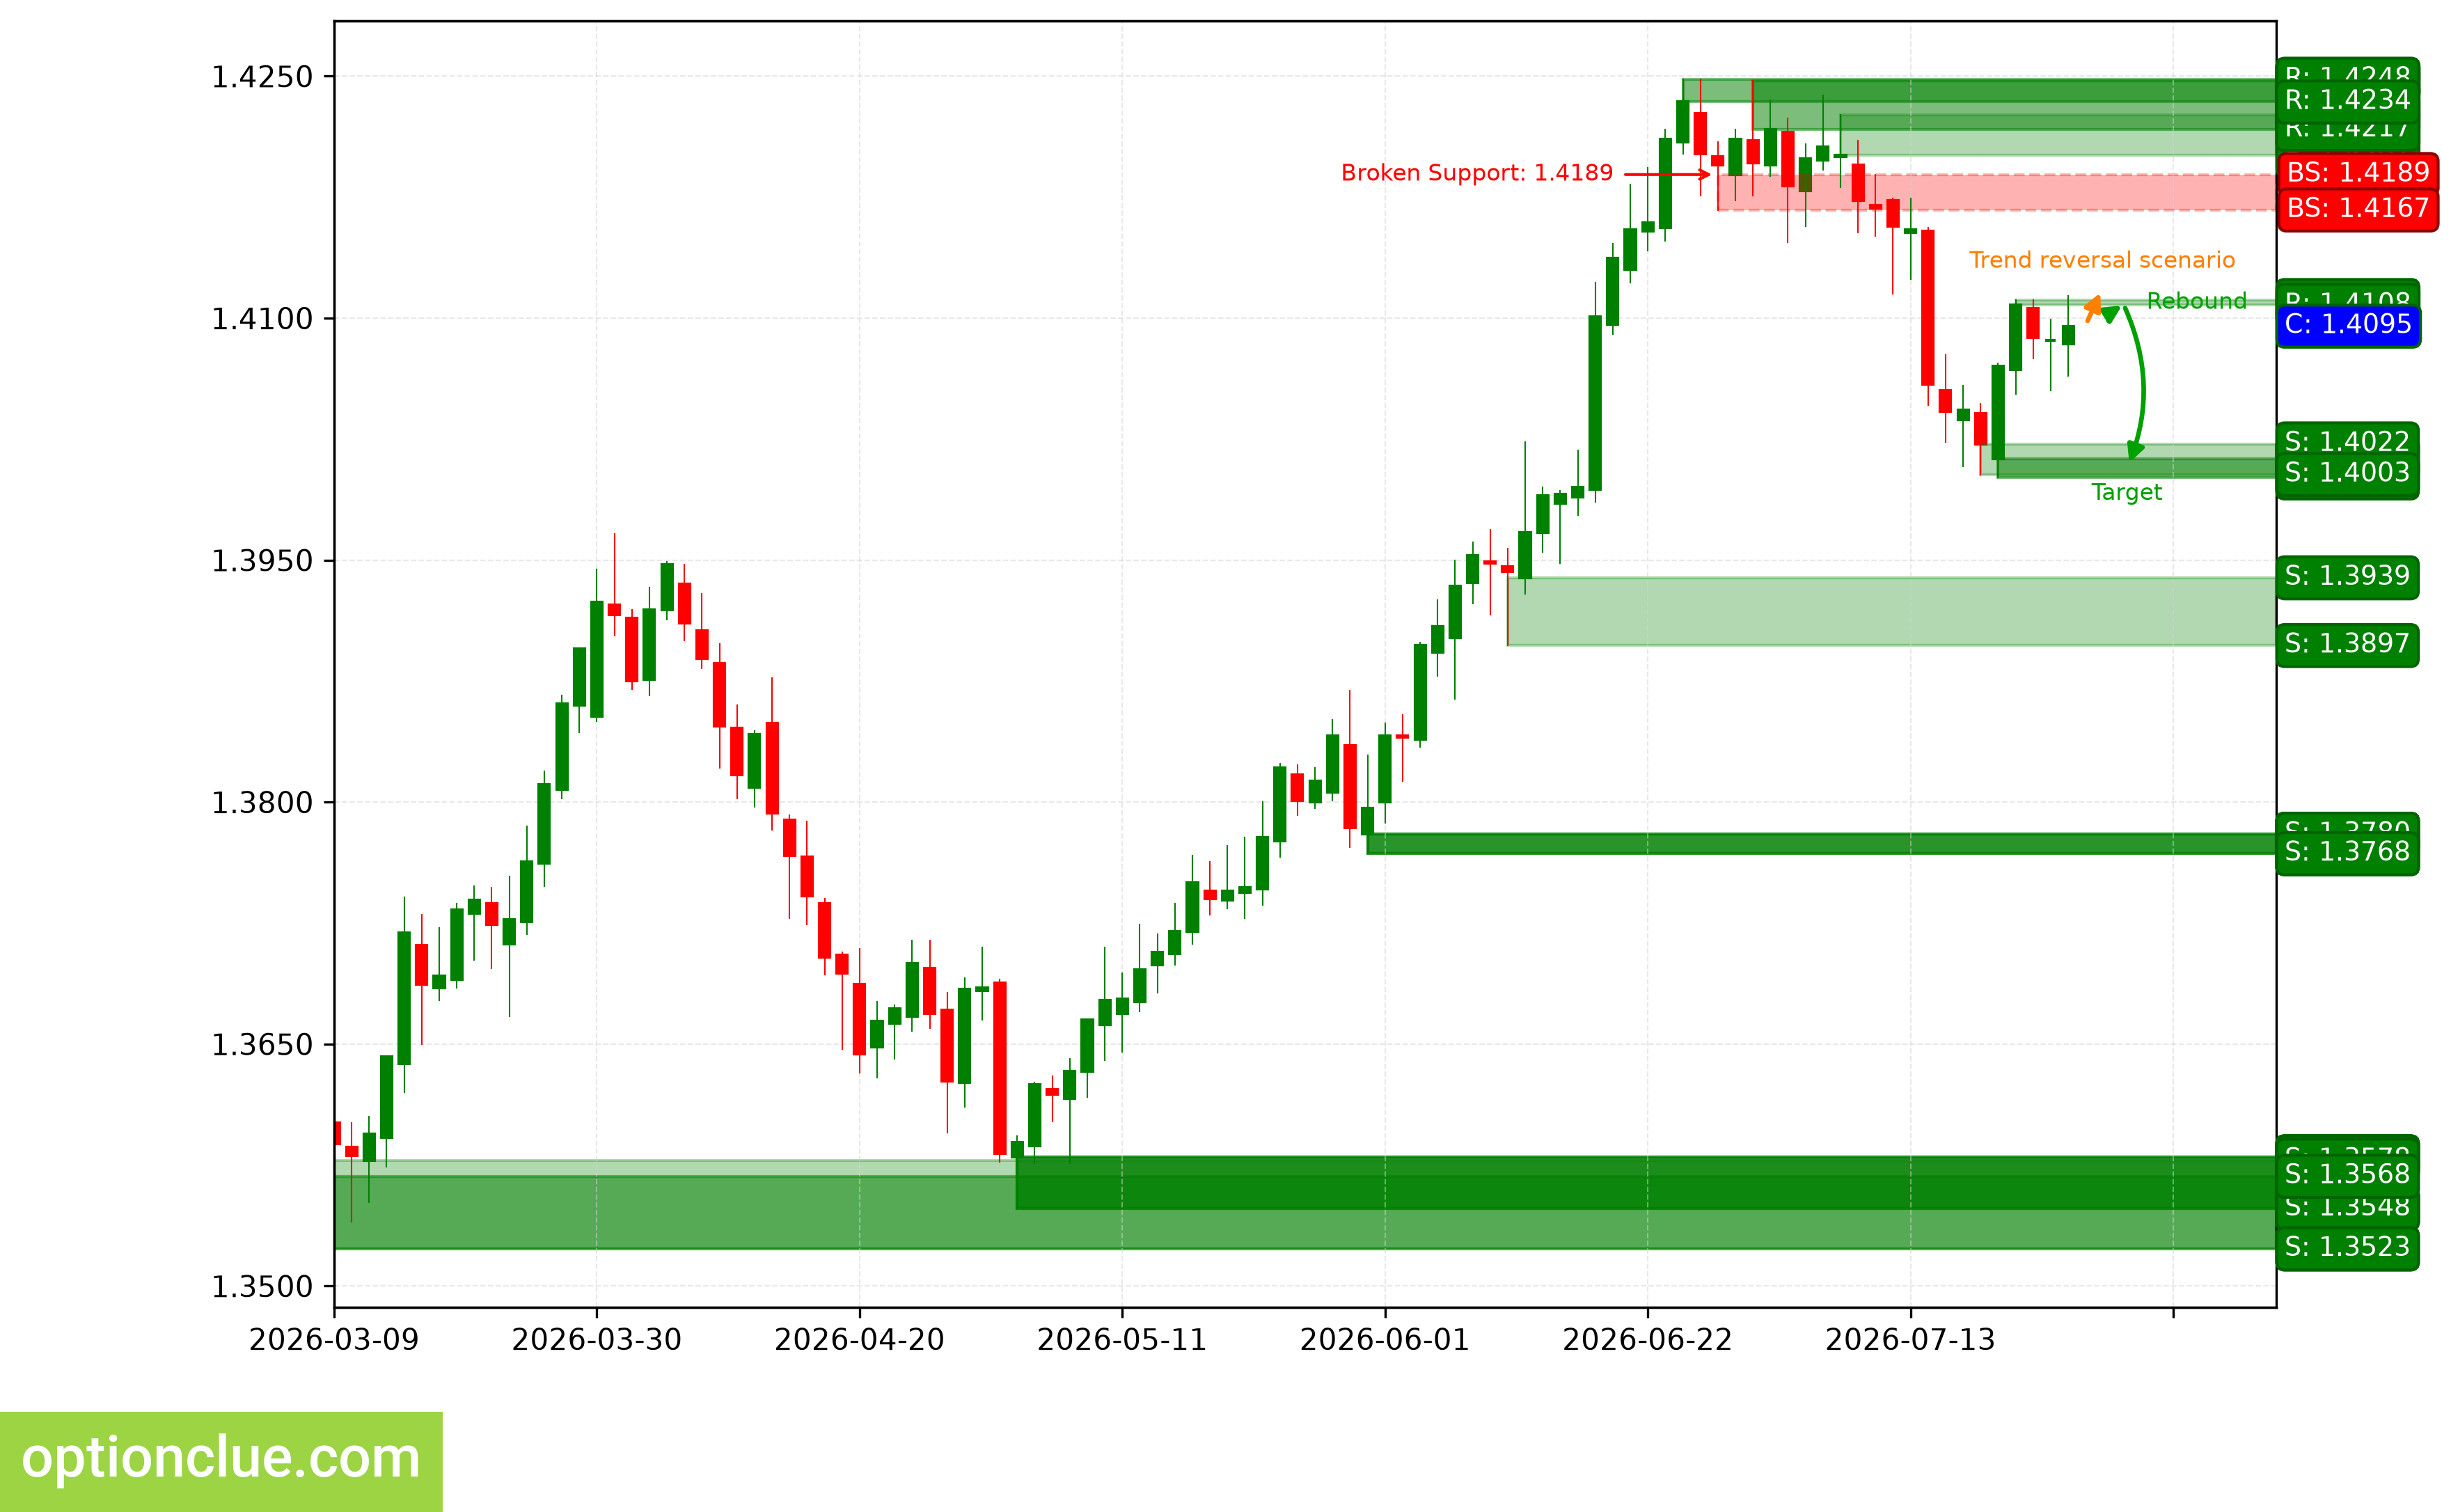
USDCAD. Technical analysis. D1.
Australian Dollar (AUDUSD)
The bullish trend continues; the price reacted to the level, but there is no confirmation yet. The last broken level is resistance (0.6953 — 0.6969). The breakout occurred 9 candlesticks ago.
Upon the resumption of the upward movement, the first target will be the resistance level with boundaries 0.7000 — 0.7026. In the event of a successful trend development, the further target will be at the resistance level with boundaries 0.7073 — 0.7088.
If the correction ends near the support level (0.6958 — 0.6970), the potential profit/risk ratio could be small (about 0.6:1). If choosing the further target — approximately 2:1.
Long positions will remain relevant as long as the market is above the nearest support level with boundaries 0.6958 — 0.6970. If the market successfully consolidates below this nearest support, the trend will change to the opposite (bearish).
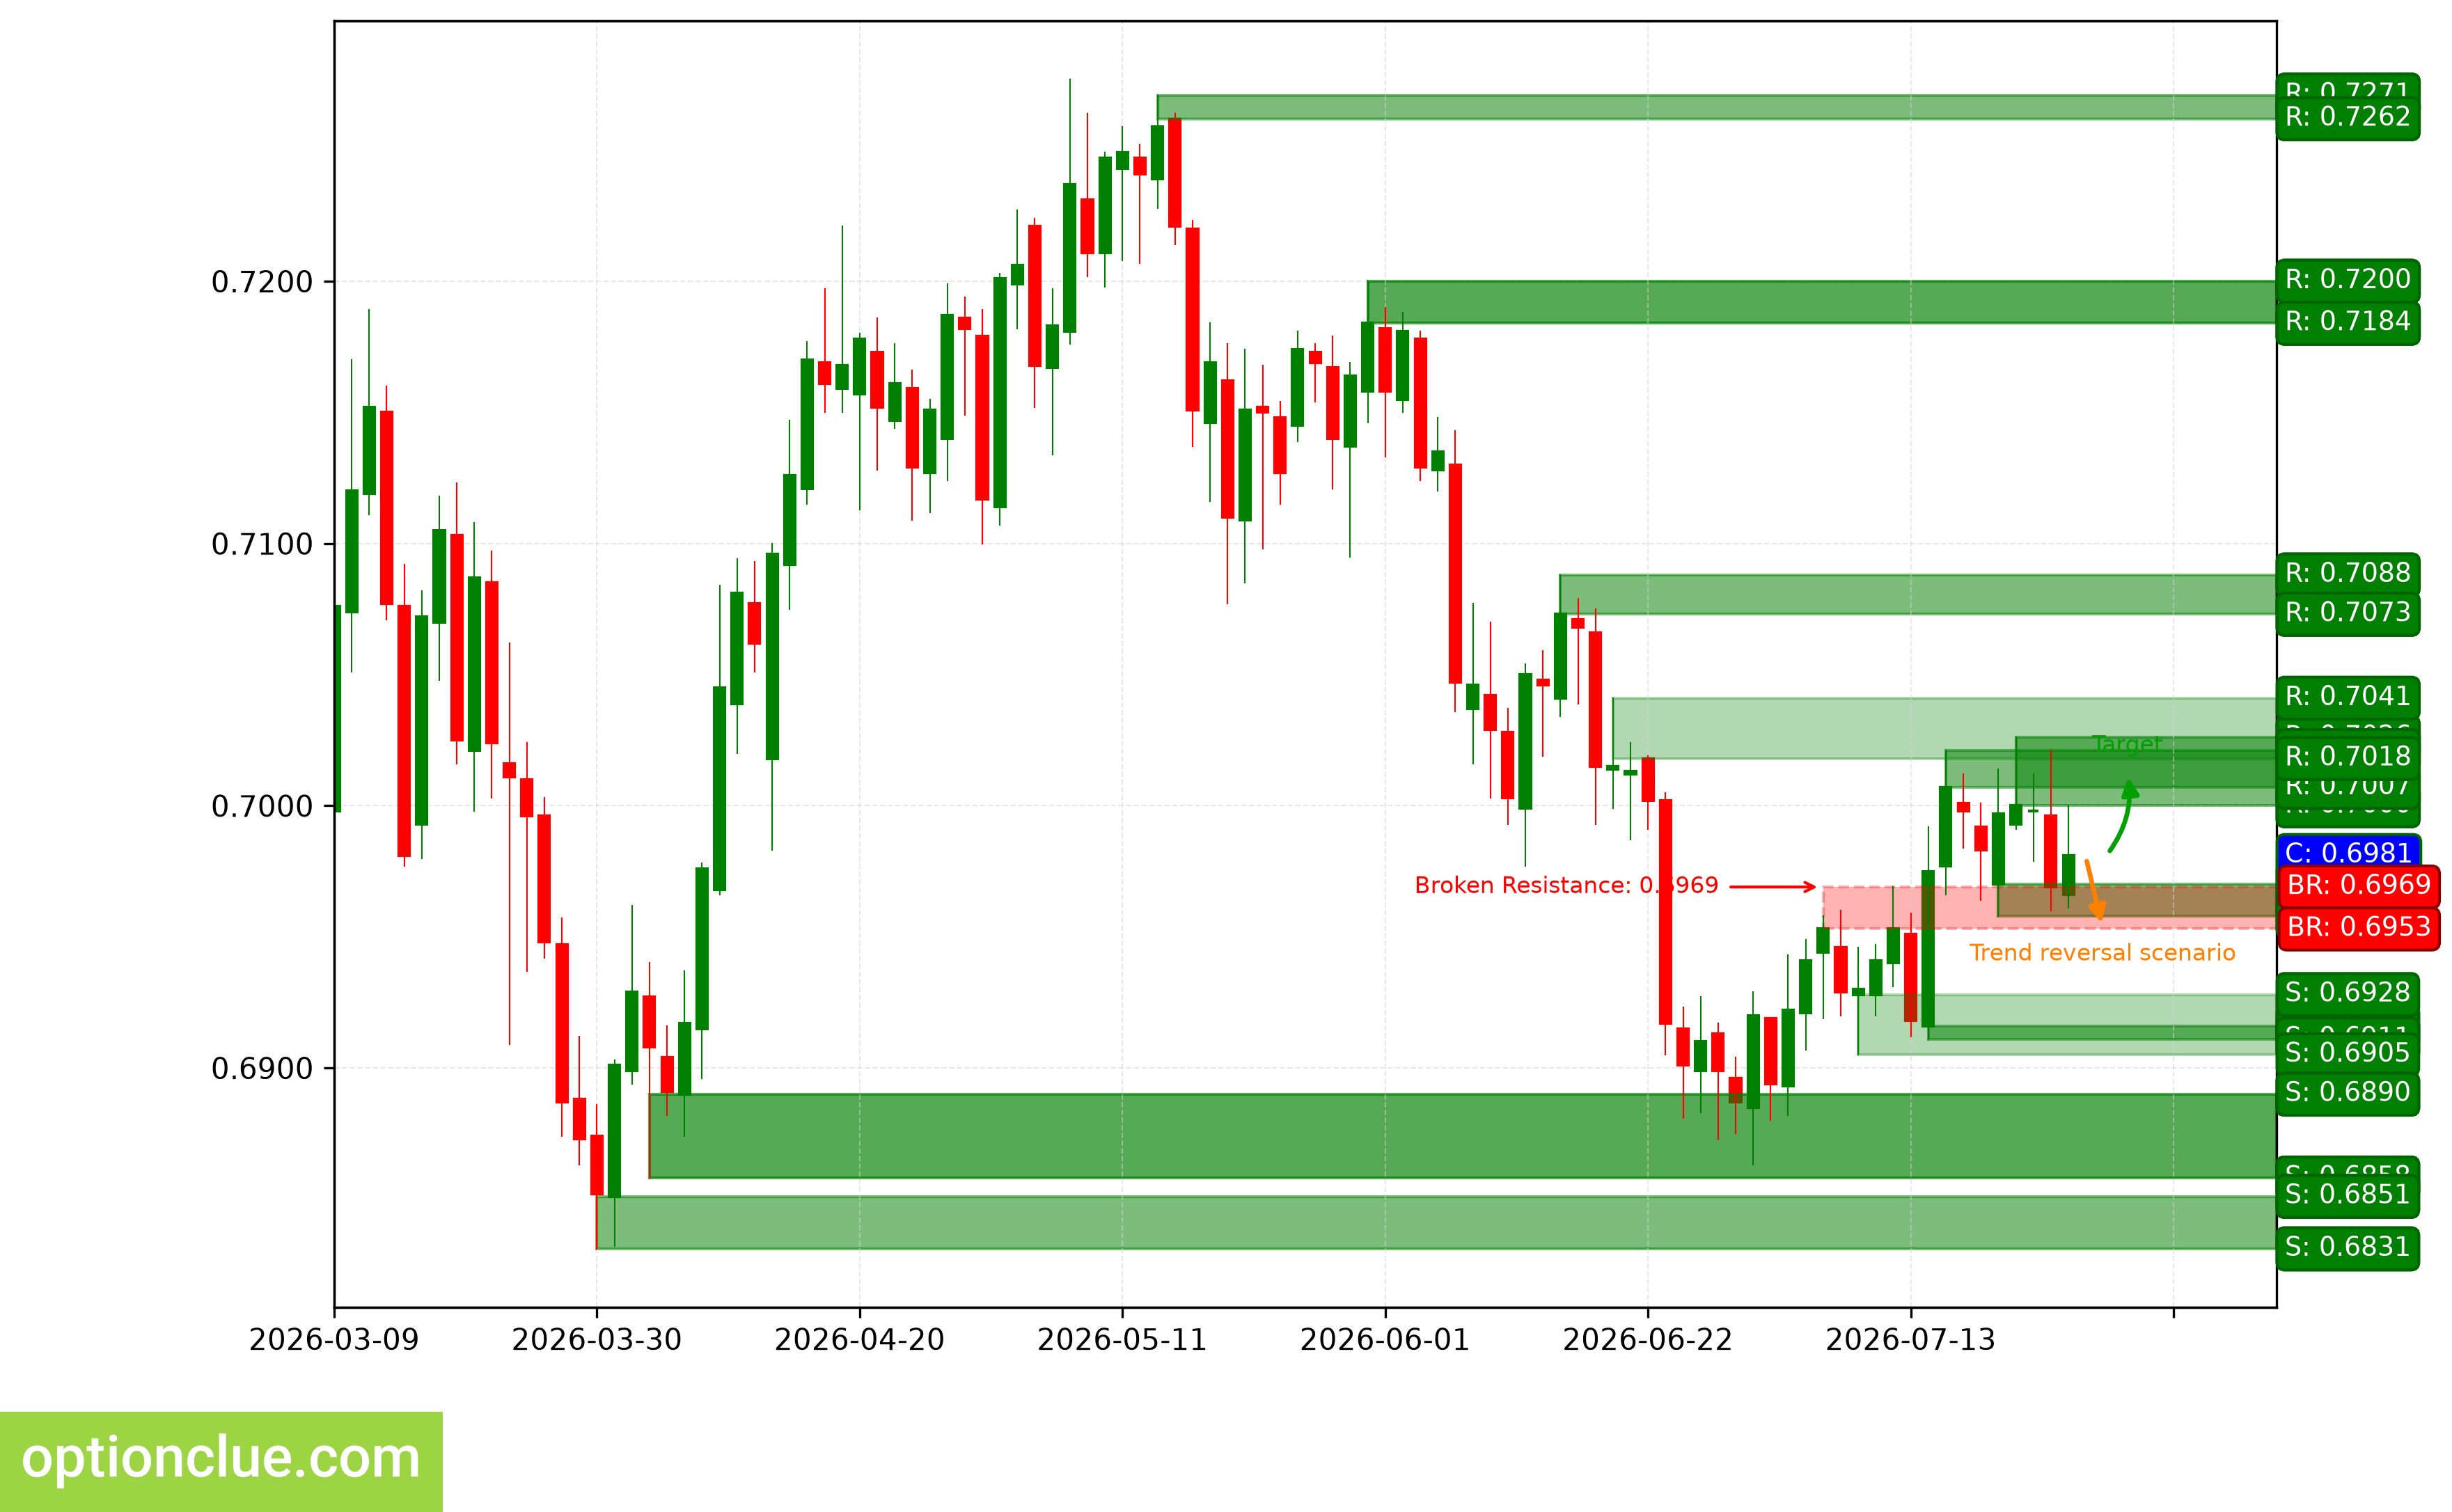
AUDUSD. Technical analysis. D1.
Bitcoin (BTC)
The bullish trend continues; the price reacted to the level, but there is no confirmation yet. The last broken level is resistance (64960 — 65508). The breakout occurred 5 candlesticks ago.
Upon the resumption of the upward movement, the first target will be the resistance level with boundaries 66507 — 66910. If the market successfully consolidates above this resistance, the further target will be at the resistance level with boundaries 73755 — 74154.
If the correction ends near the support level (62489 — 63789), the potential profit/risk ratio could be around 1.5:1. If choosing the further target — more than 4:1.
Long positions will remain relevant as long as the market is above the nearest support level of the daily timeframe with boundaries 62489 — 63789. If the market successfully consolidates below this nearest support, the trend will change to the opposite (bearish).
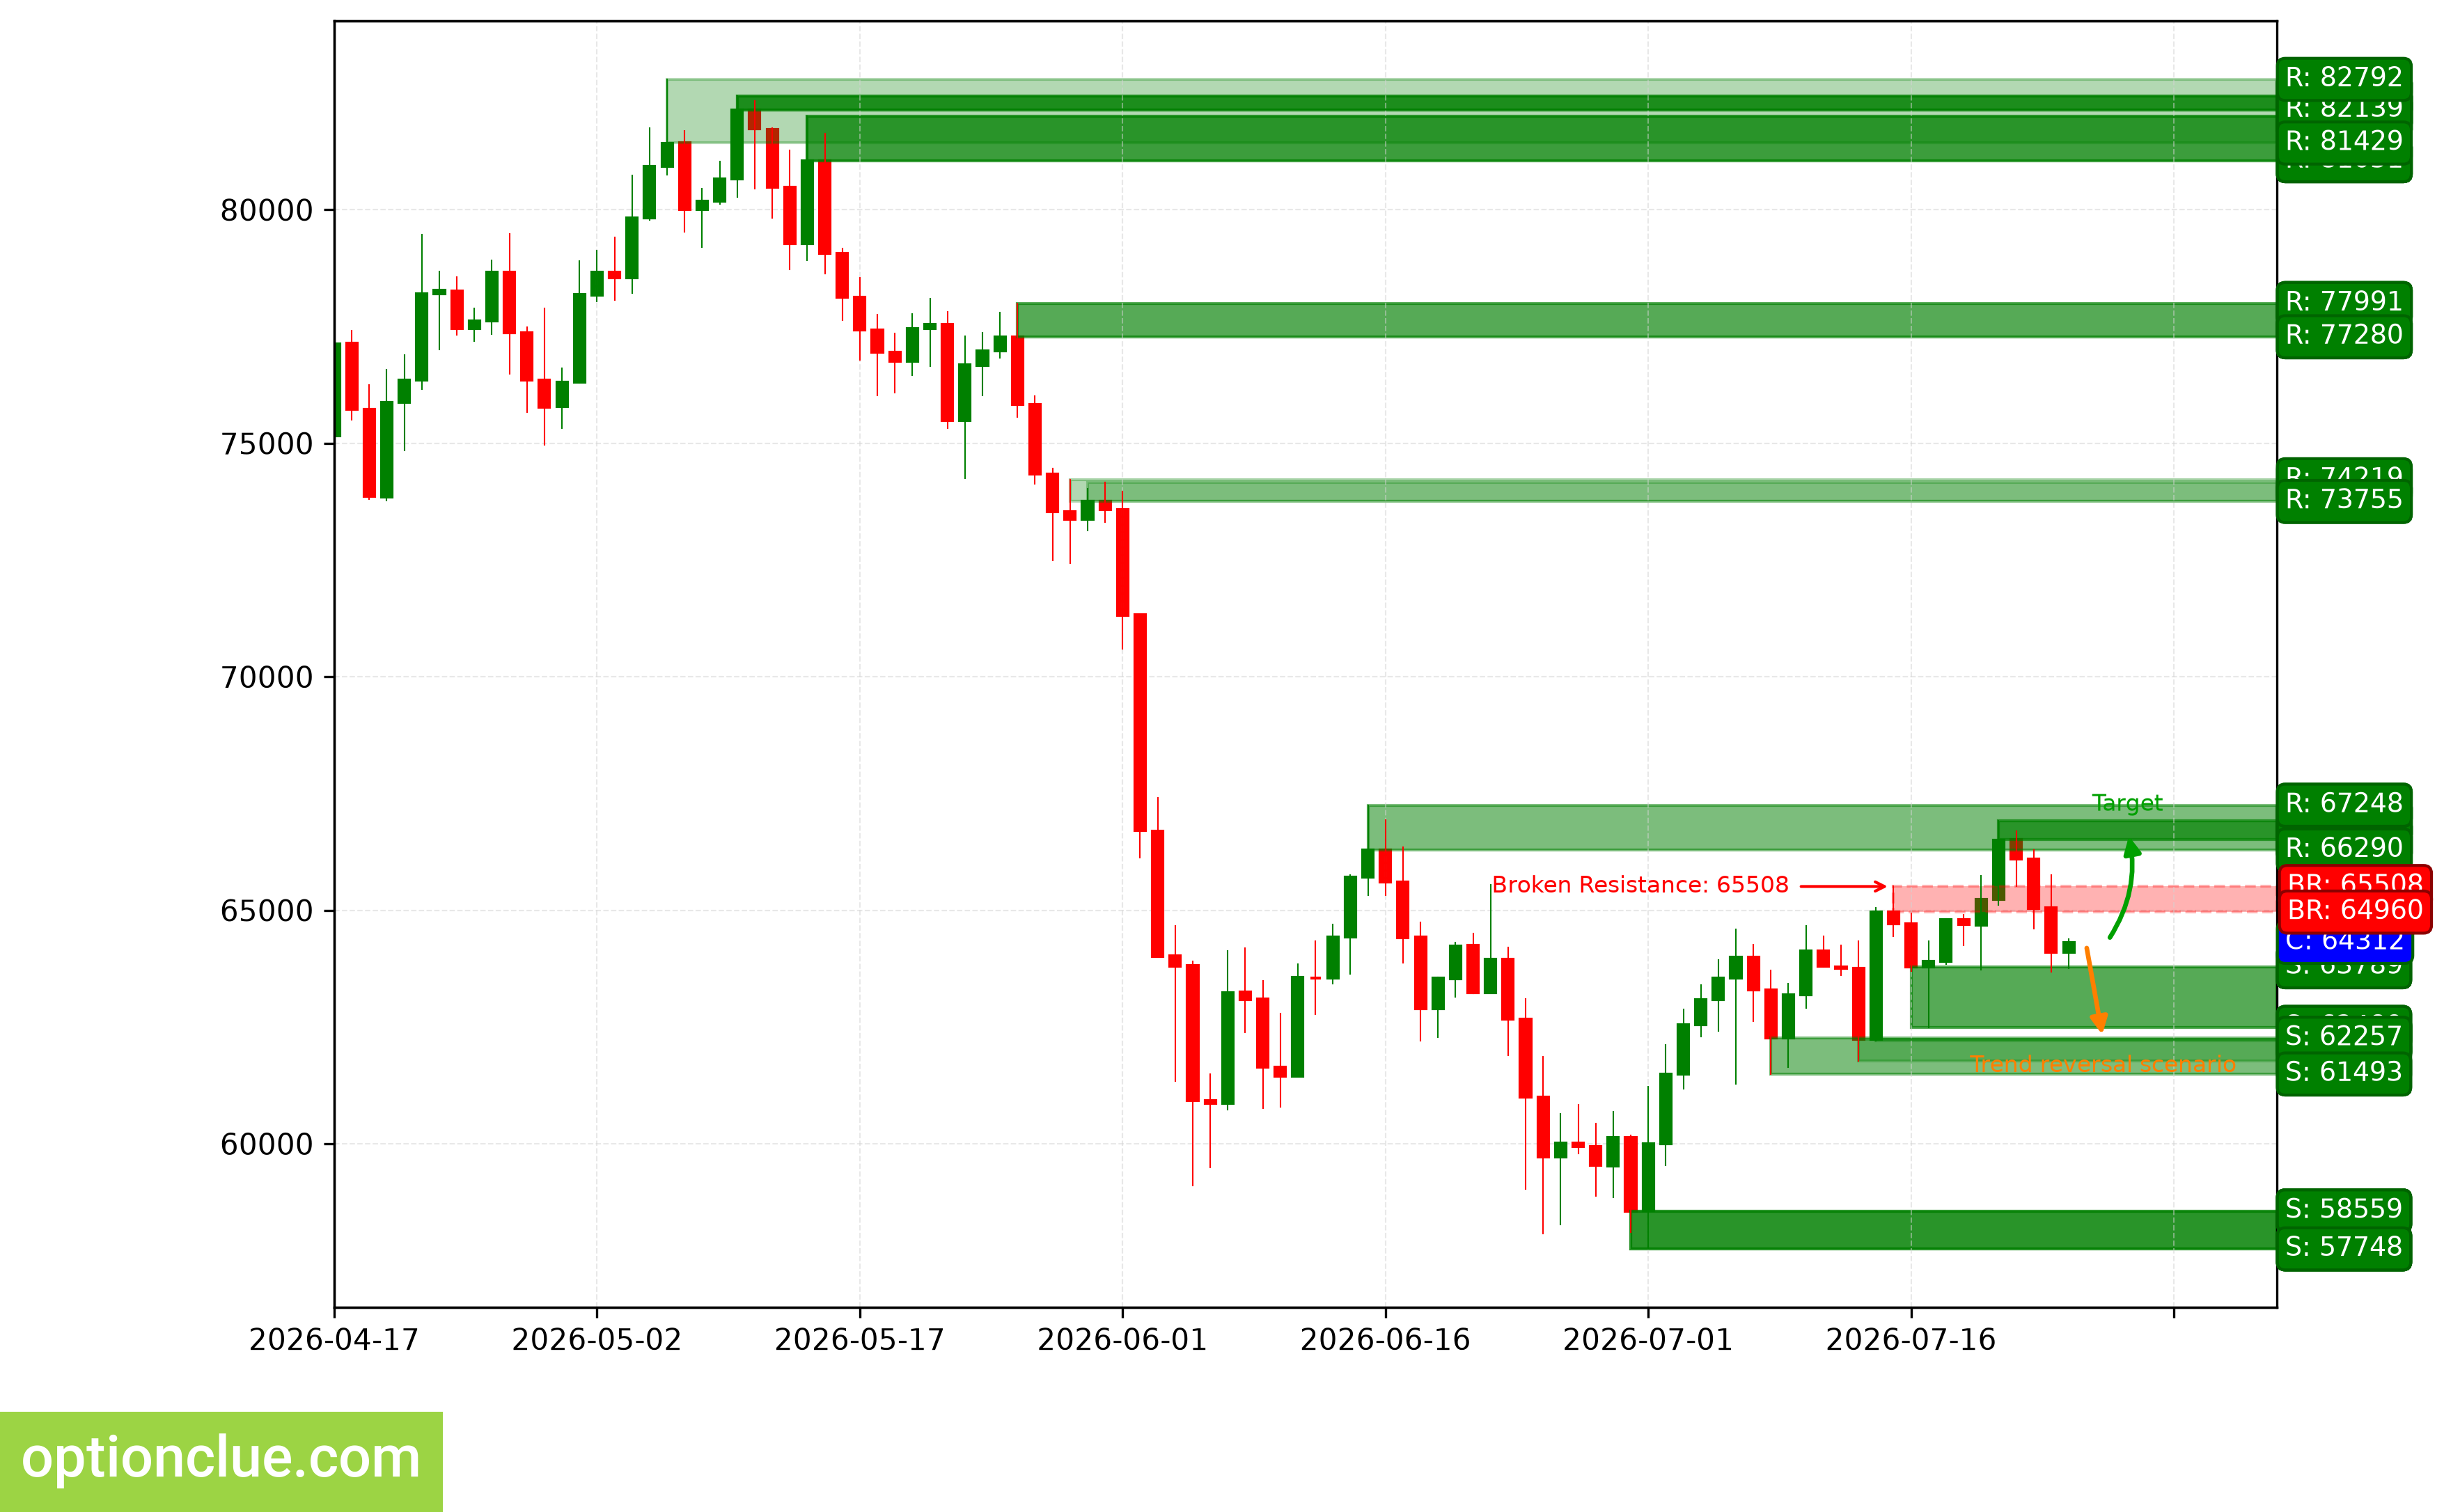
BTC. Technical analysis. D1.
Ethereum (ETH)
The bullish trend continues; a corrective wave is developing again. The last broken level is resistance (1806 — 1842). The breakout occurred 12 candlesticks ago.
Upon the resumption of the upward movement, the first target will be the resistance level with boundaries 1933 — 1955. In the event of a successful trend development, the further target will be at the resistance level with boundaries 2116 — 2146.
If the next correction ends near the support level (1803 — 1841), the potential profit/risk ratio could be around 1.3:1. If choosing the further target — more than 3:1. If the correction ends near the last broken level (1806 — 1842), the potential profit/risk ratio could be approximately 1.3:1.
Long positions will remain relevant as long as the market is above the nearest support level with boundaries 1803 — 1841. If the market successfully consolidates below this support, the trend will change to the opposite (bearish).
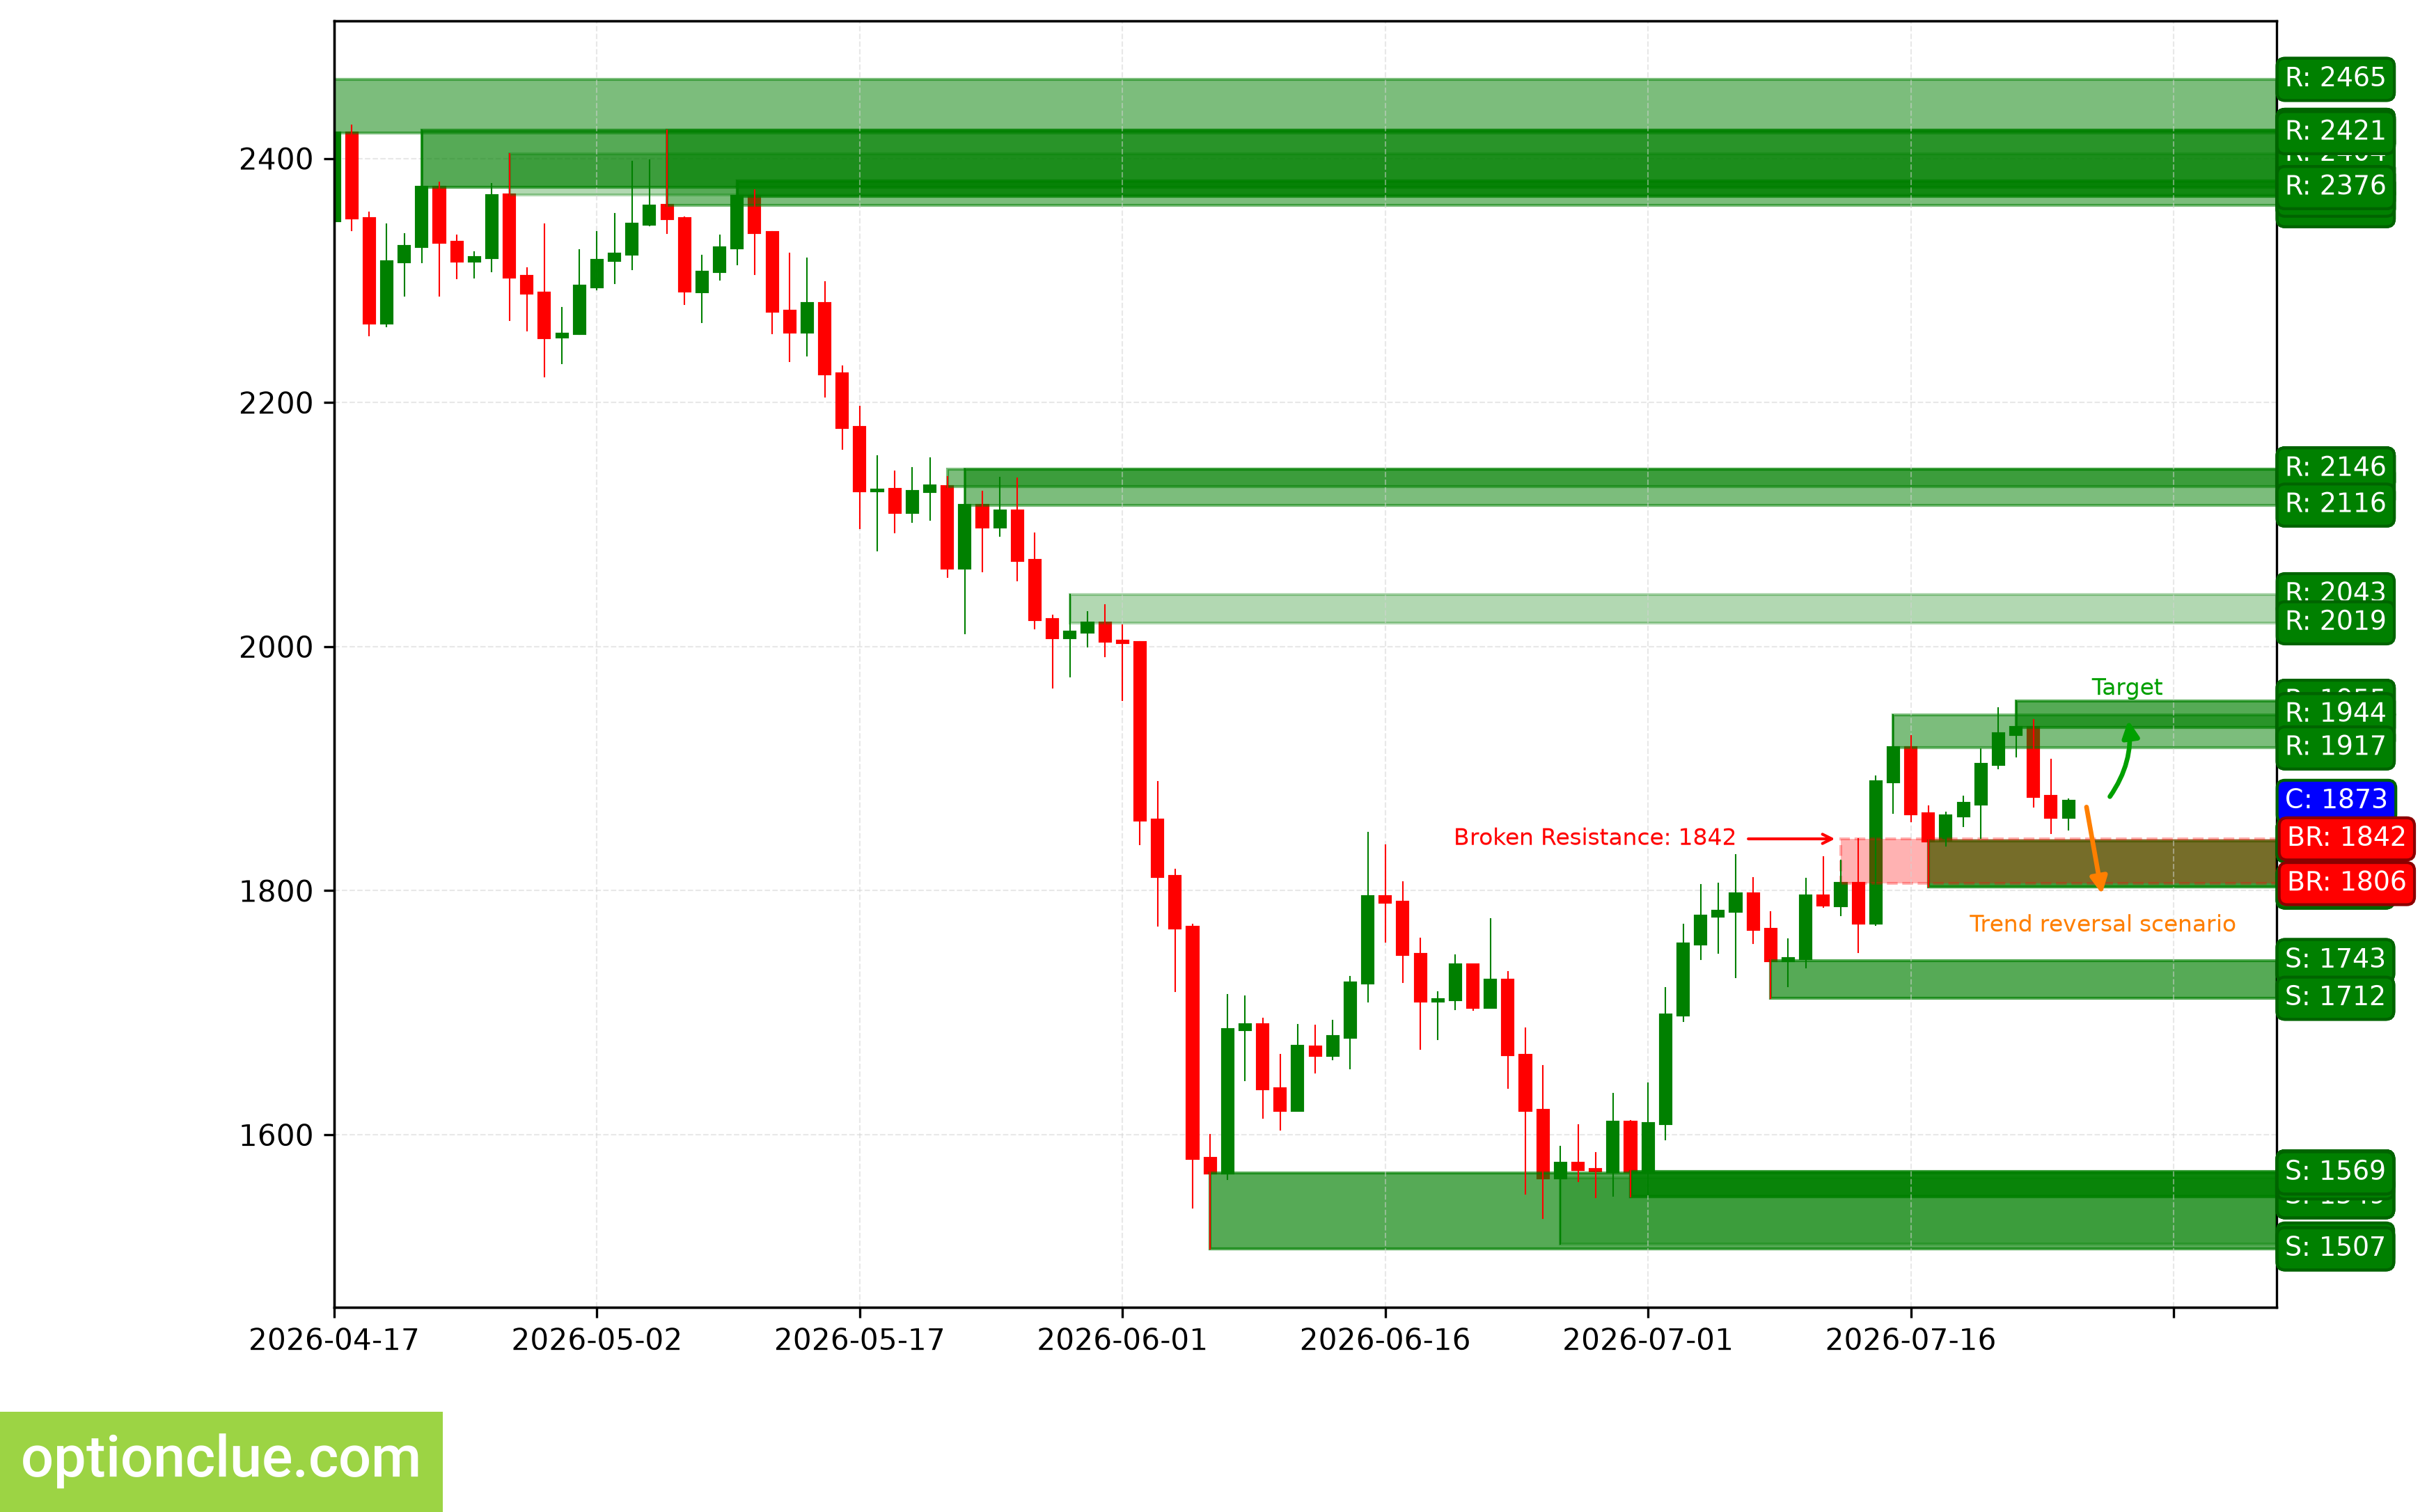
ETH. Technical analysis. D1.
Apple Inc (AAPL)
The bullish trend continues, an impulse wave is developing. The last broken level is resistance (327.87 — 329.60). The breakout occurred on the last closed candlestick.
The intermediate target for the upward movement is the resistance level with boundaries 333.74 — 334.99.
If the next correction ends near the support level (319.35 — 321.66), the potential profit/risk ratio could be approximately 1.4:1. If the correction ends near the last broken level (327.87 — 329.60), the potential profit/risk ratio could be small (about 0.3:1).
Long positions will remain relevant as long as the market is above the nearest support level with boundaries 319.35 — 321.66. If the market successfully consolidates below this support, the trend will change to the opposite (bearish).
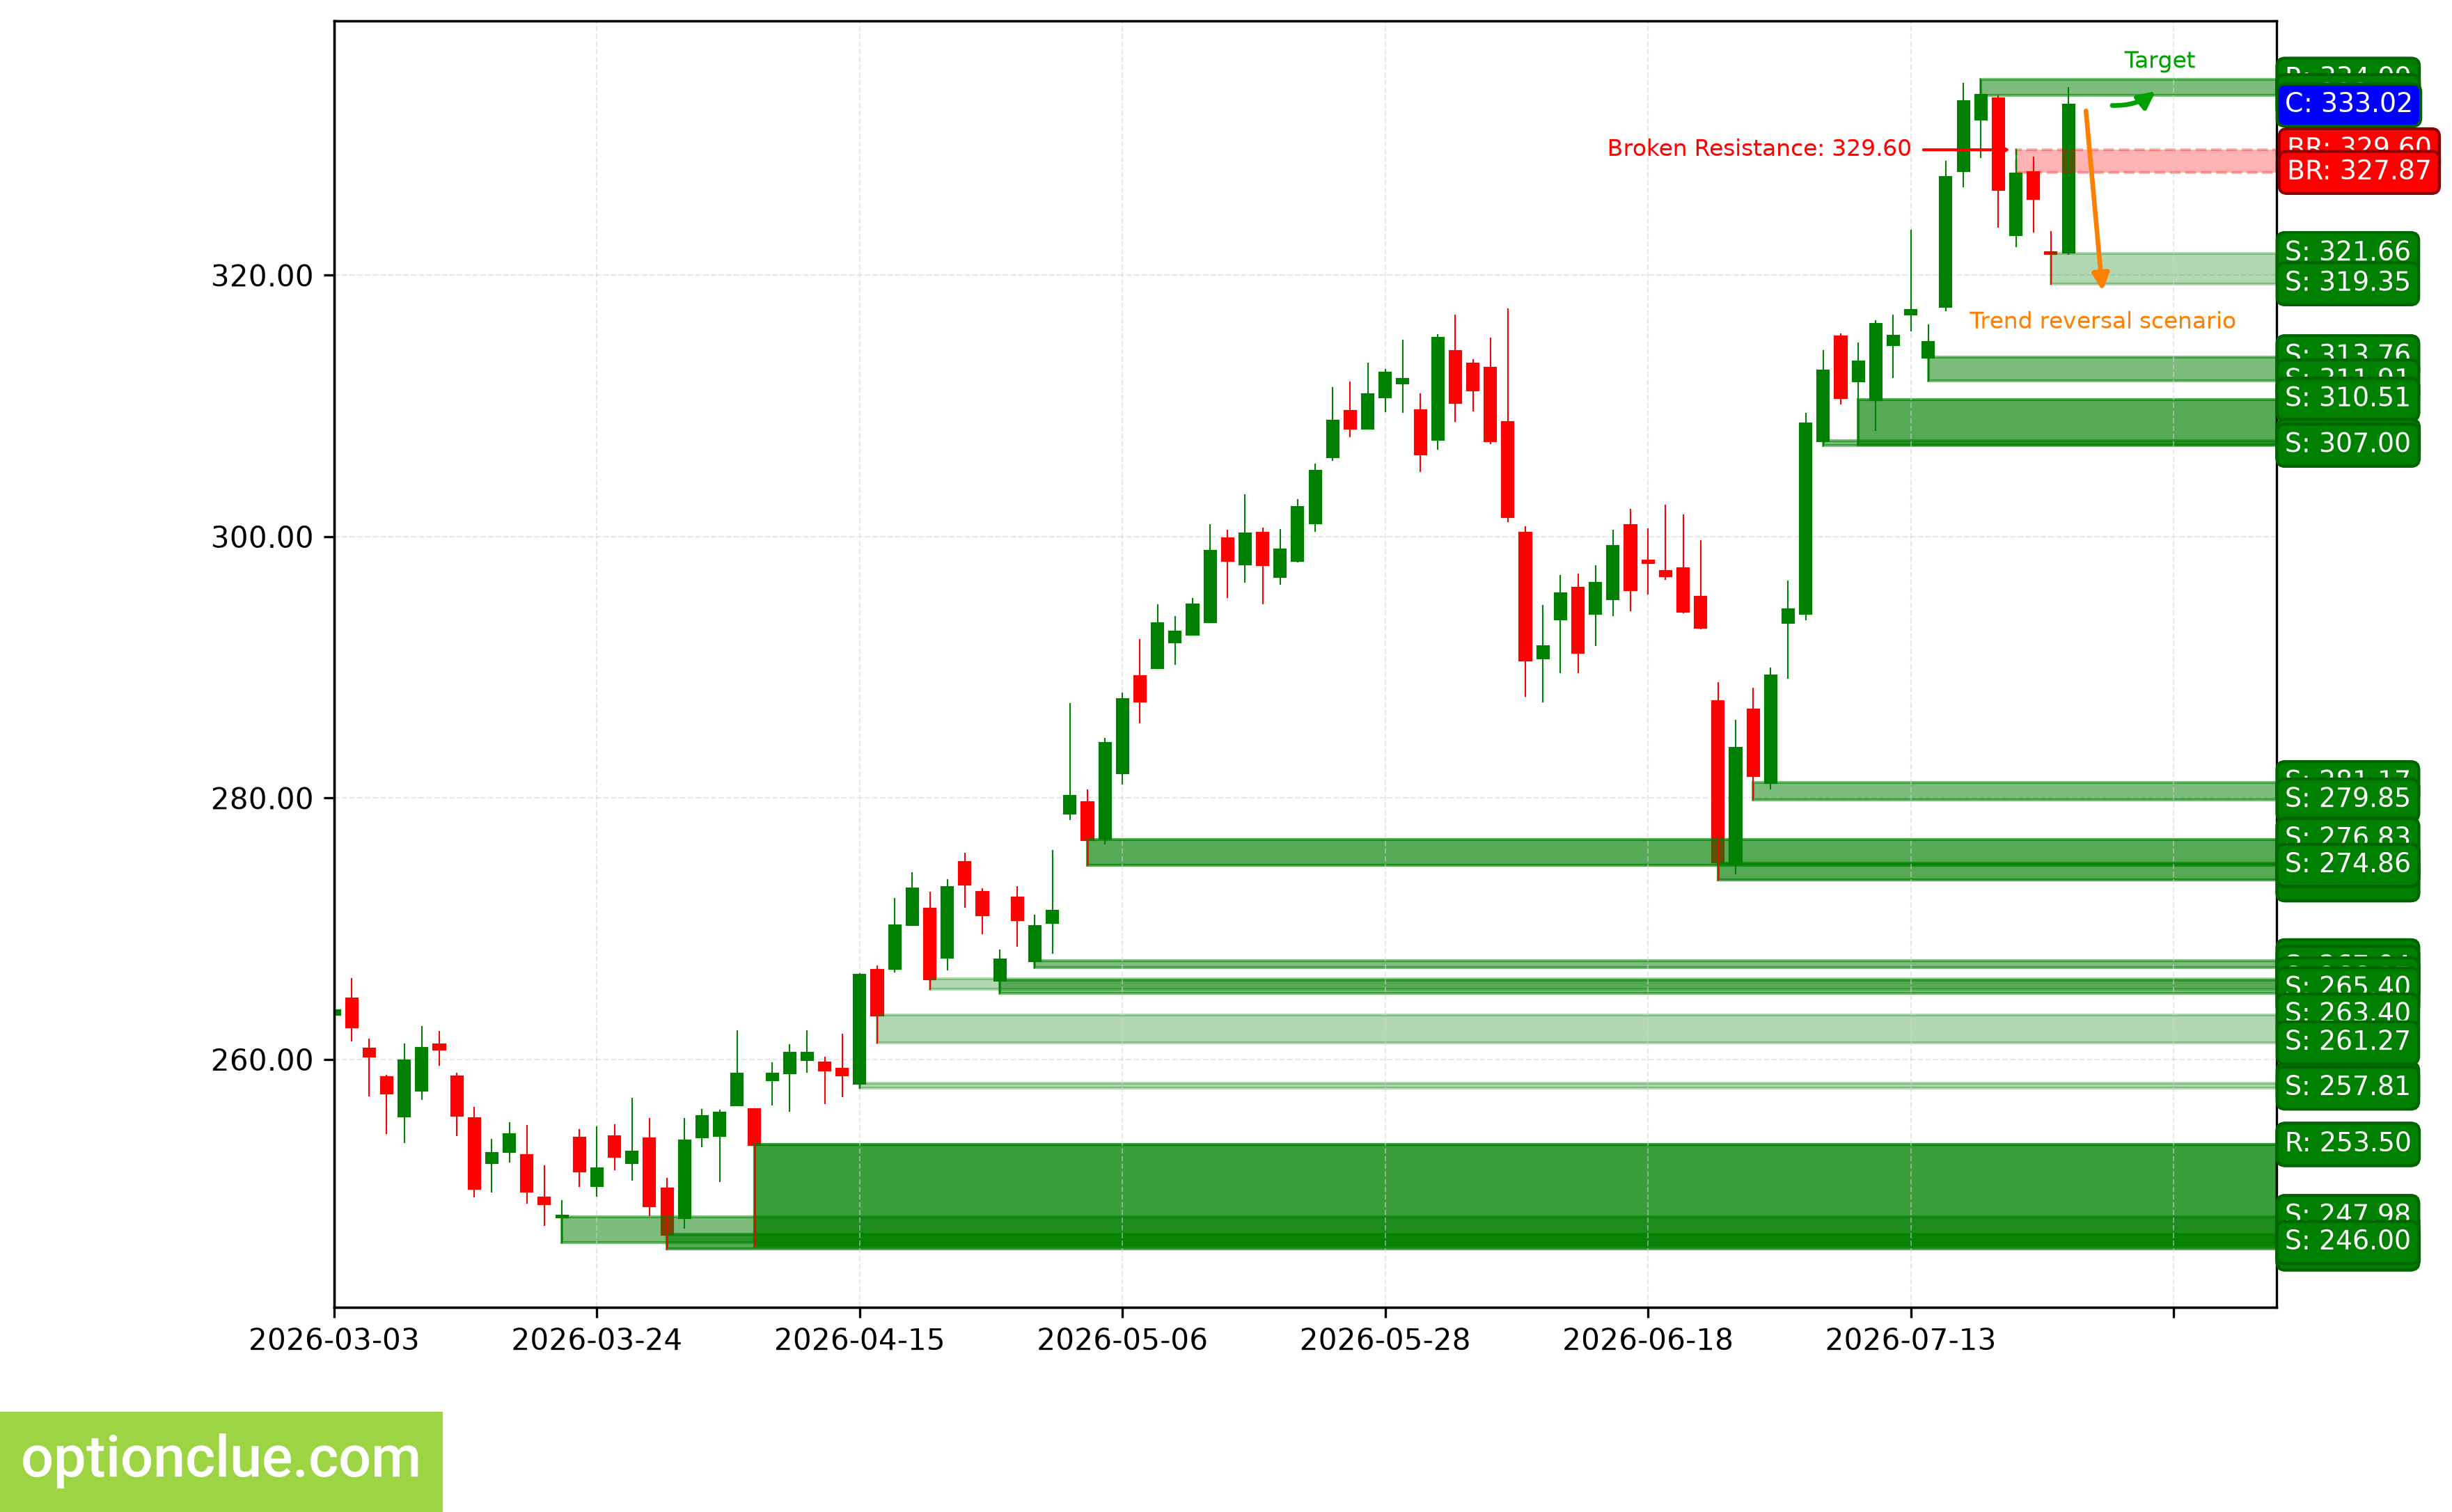
AAPL. Technical analysis. D1.
Tesla Inc (TSLA)
The bearish trend continues, an impulse wave is developing. The last broken level is support (390.50 — 393.99). The breakout occurred 6 candlesticks ago.
The intermediate target for the downward movement is the support level with boundaries 297.82 — 302.63.
The potential profit/risk ratio from current prices, when setting targets and fixing risks according to the levels of the daily timeframe, could be small (about 0.1:1). If the next correction ends near the resistance level (378.93 — 384.07), the potential profit/risk ratio could be approximately 4:1.
Short positions will remain relevant as long as the market remains below the nearest resistance level with boundaries 378.93 — 384.07. If the market successfully consolidates above this nearest resistance, the trend will change to the opposite (bullish).
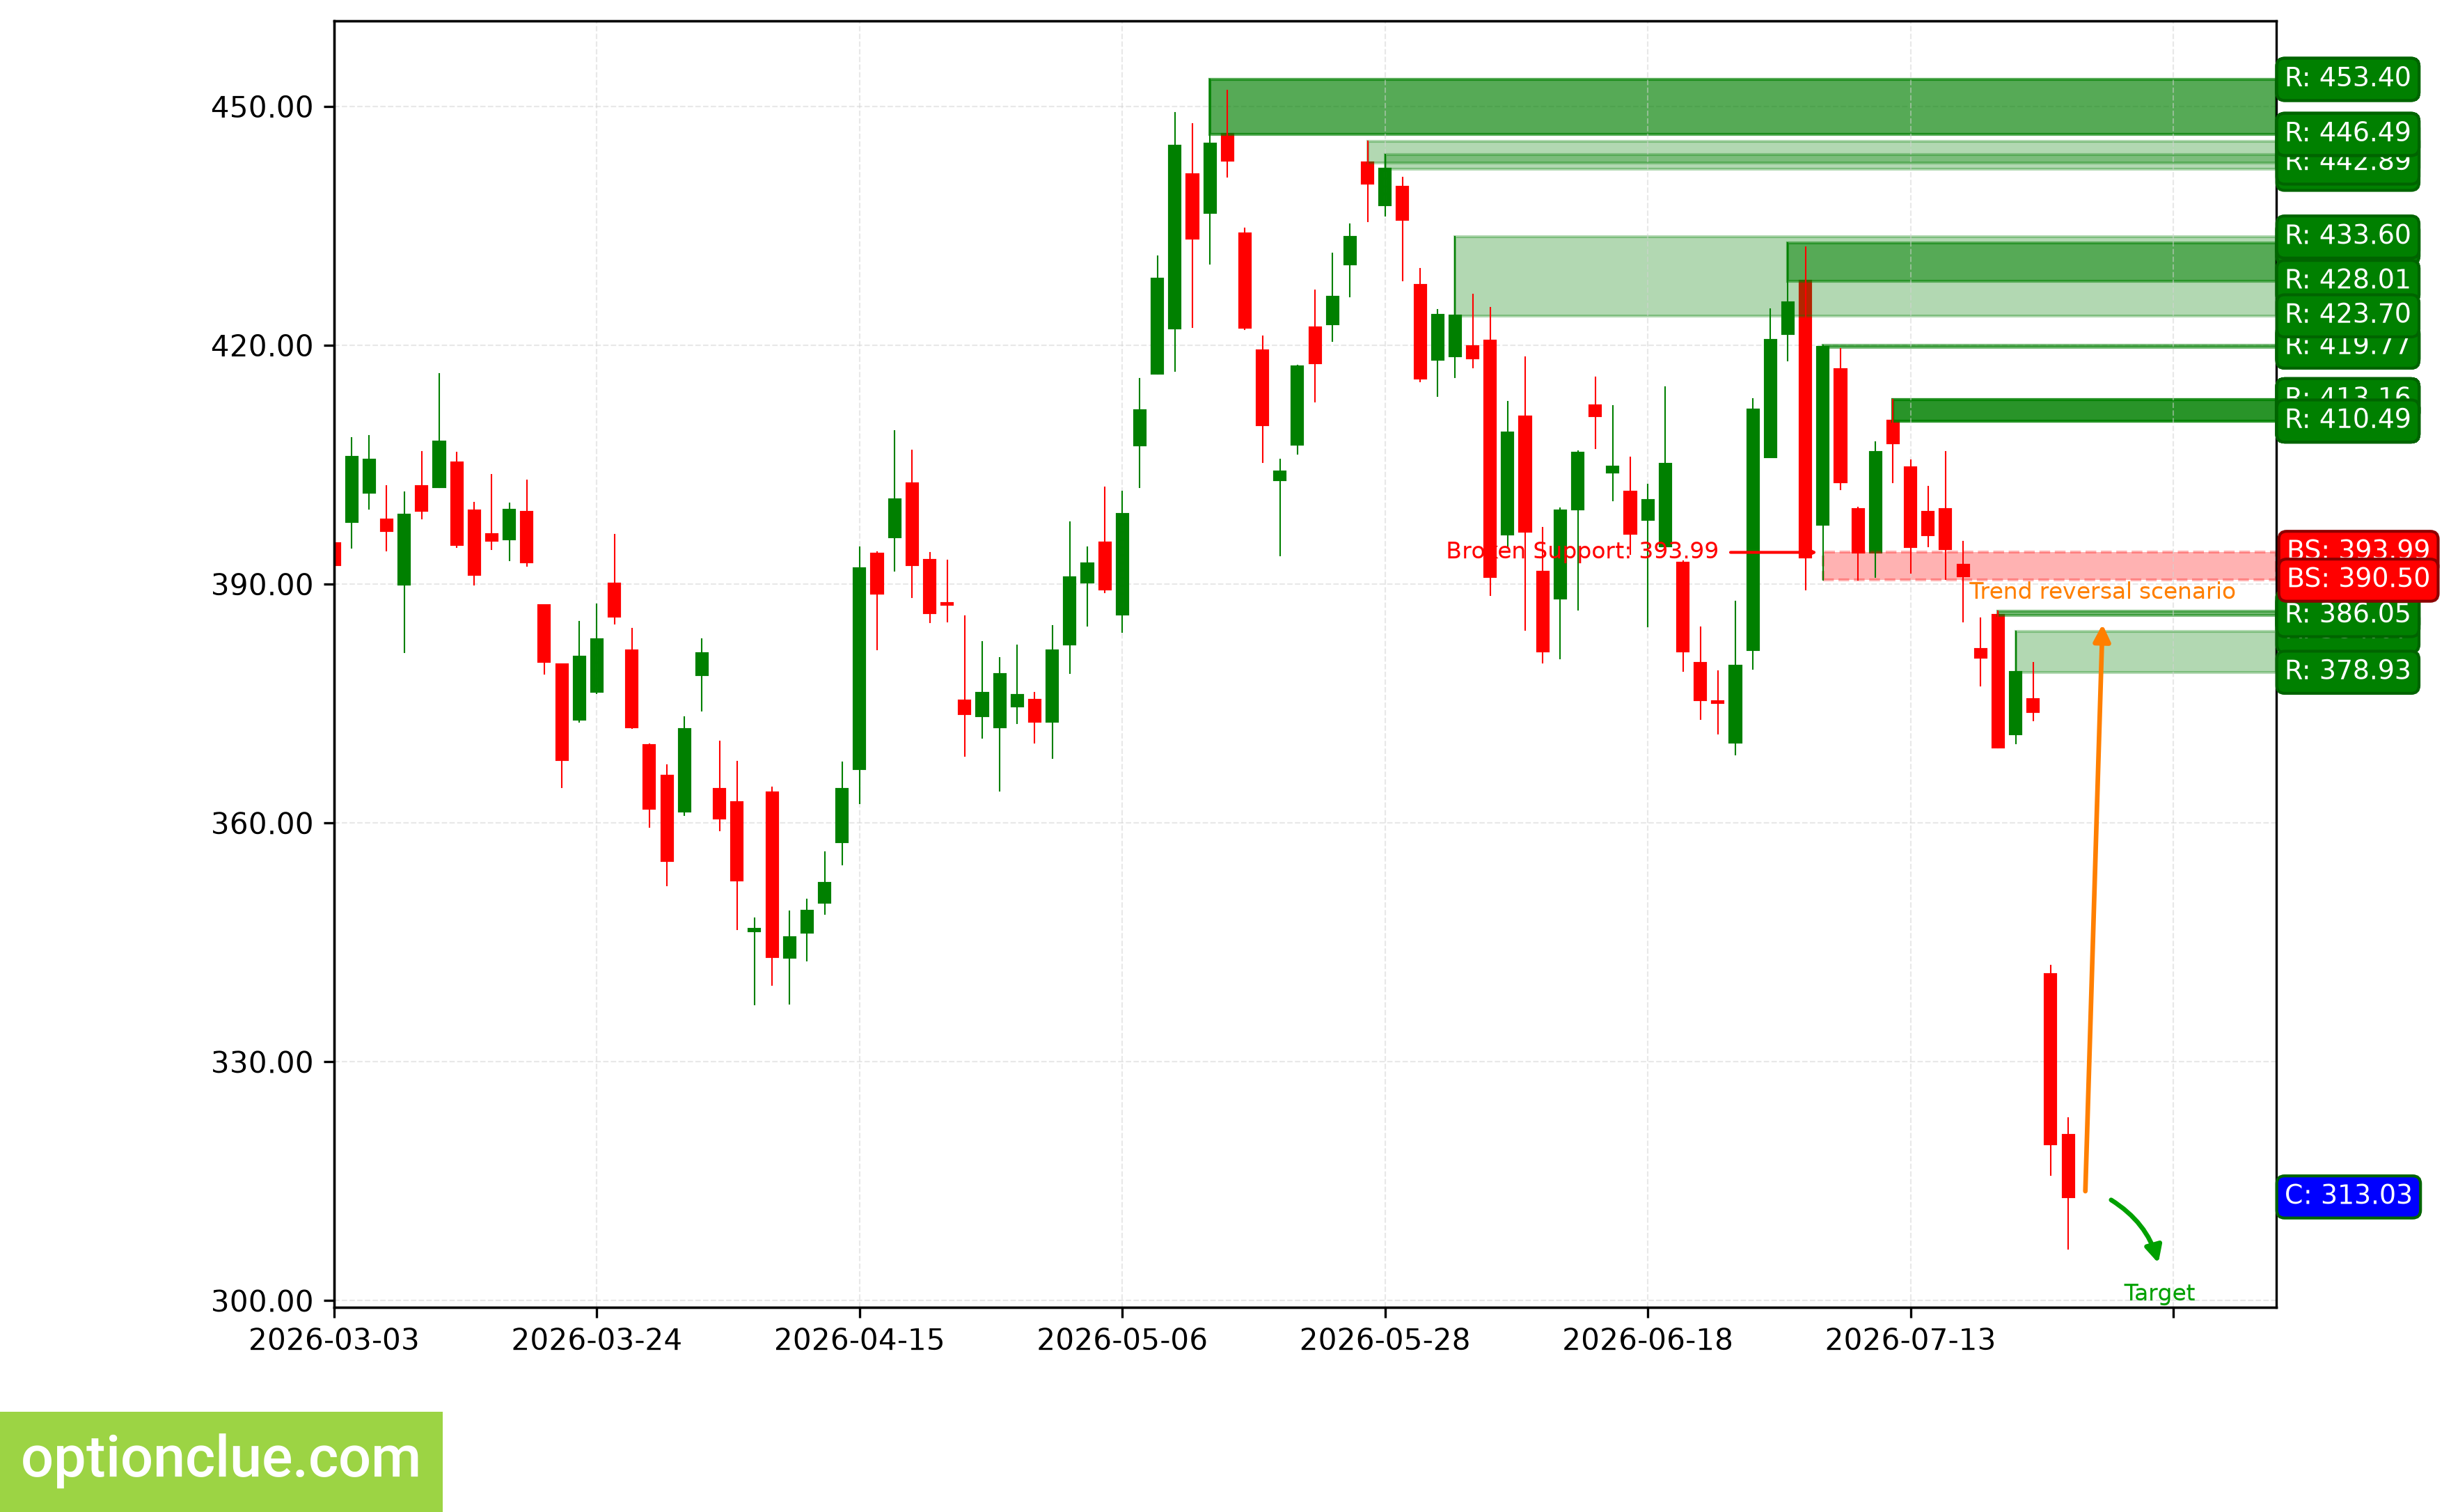
TSLA. Technical analysis. D1.
Summary
From the perspective of medium-term trading, the financial instruments with a correction nearing completion on the Daily timeframe and/or potentially the most promising profit-to-risk ratio can be identified as: USDCAD, AUDUSD, BTC, ETH. Depending on the depth of the market correction, the following may soon be worthy of attention: TSLA.
The remaining financial instruments on the watchlist may also be of interest, but the conditions for a rebound on the daily timeframe in these markets will likely not appear earlier than in a week.