
We review the most important levels for key financial instruments and the probable scenarios for price action.
Key Topics
- Euro (EURUSD)
- British Pound (GBPUSD)
- Swiss Franc (USDCHF)
- Japanese Yen (USDJPY)
- Canadian Dollar (USDCAD)
- Australian Dollar (AUDUSD)
- Bitcoin (BTC)
- Ether (ETH)
- Apple Inc (AAPL)
- NVIDIA Corp (NVDA)
- Tesla Inc (TSLA)
- Summary
Euro (EURUSD)
The bearish trend continues, an impulse wave is developing. The last broken level is support (1.1584 — 1.1624). The breakout occurred 6 candlesticks ago.
An intermediate target for the downward movement is the support level with boundaries at 1.1499 — 1.1518.
If the next correction ends near the resistance level (1.1645 — 1.1660), the potential reward/risk ratio could be approximately 2:1. If the correction ends near the last broken level (1.1584 — 1.1624), the potential reward/risk ratio could be small (around 0.7:1).
Short positions will remain relevant as long as the market stays below the nearest resistance level with boundaries at 1.1645 — 1.1660. If the market successfully consolidates above this nearest resistance, the trend will reverse to the opposite (bullish).
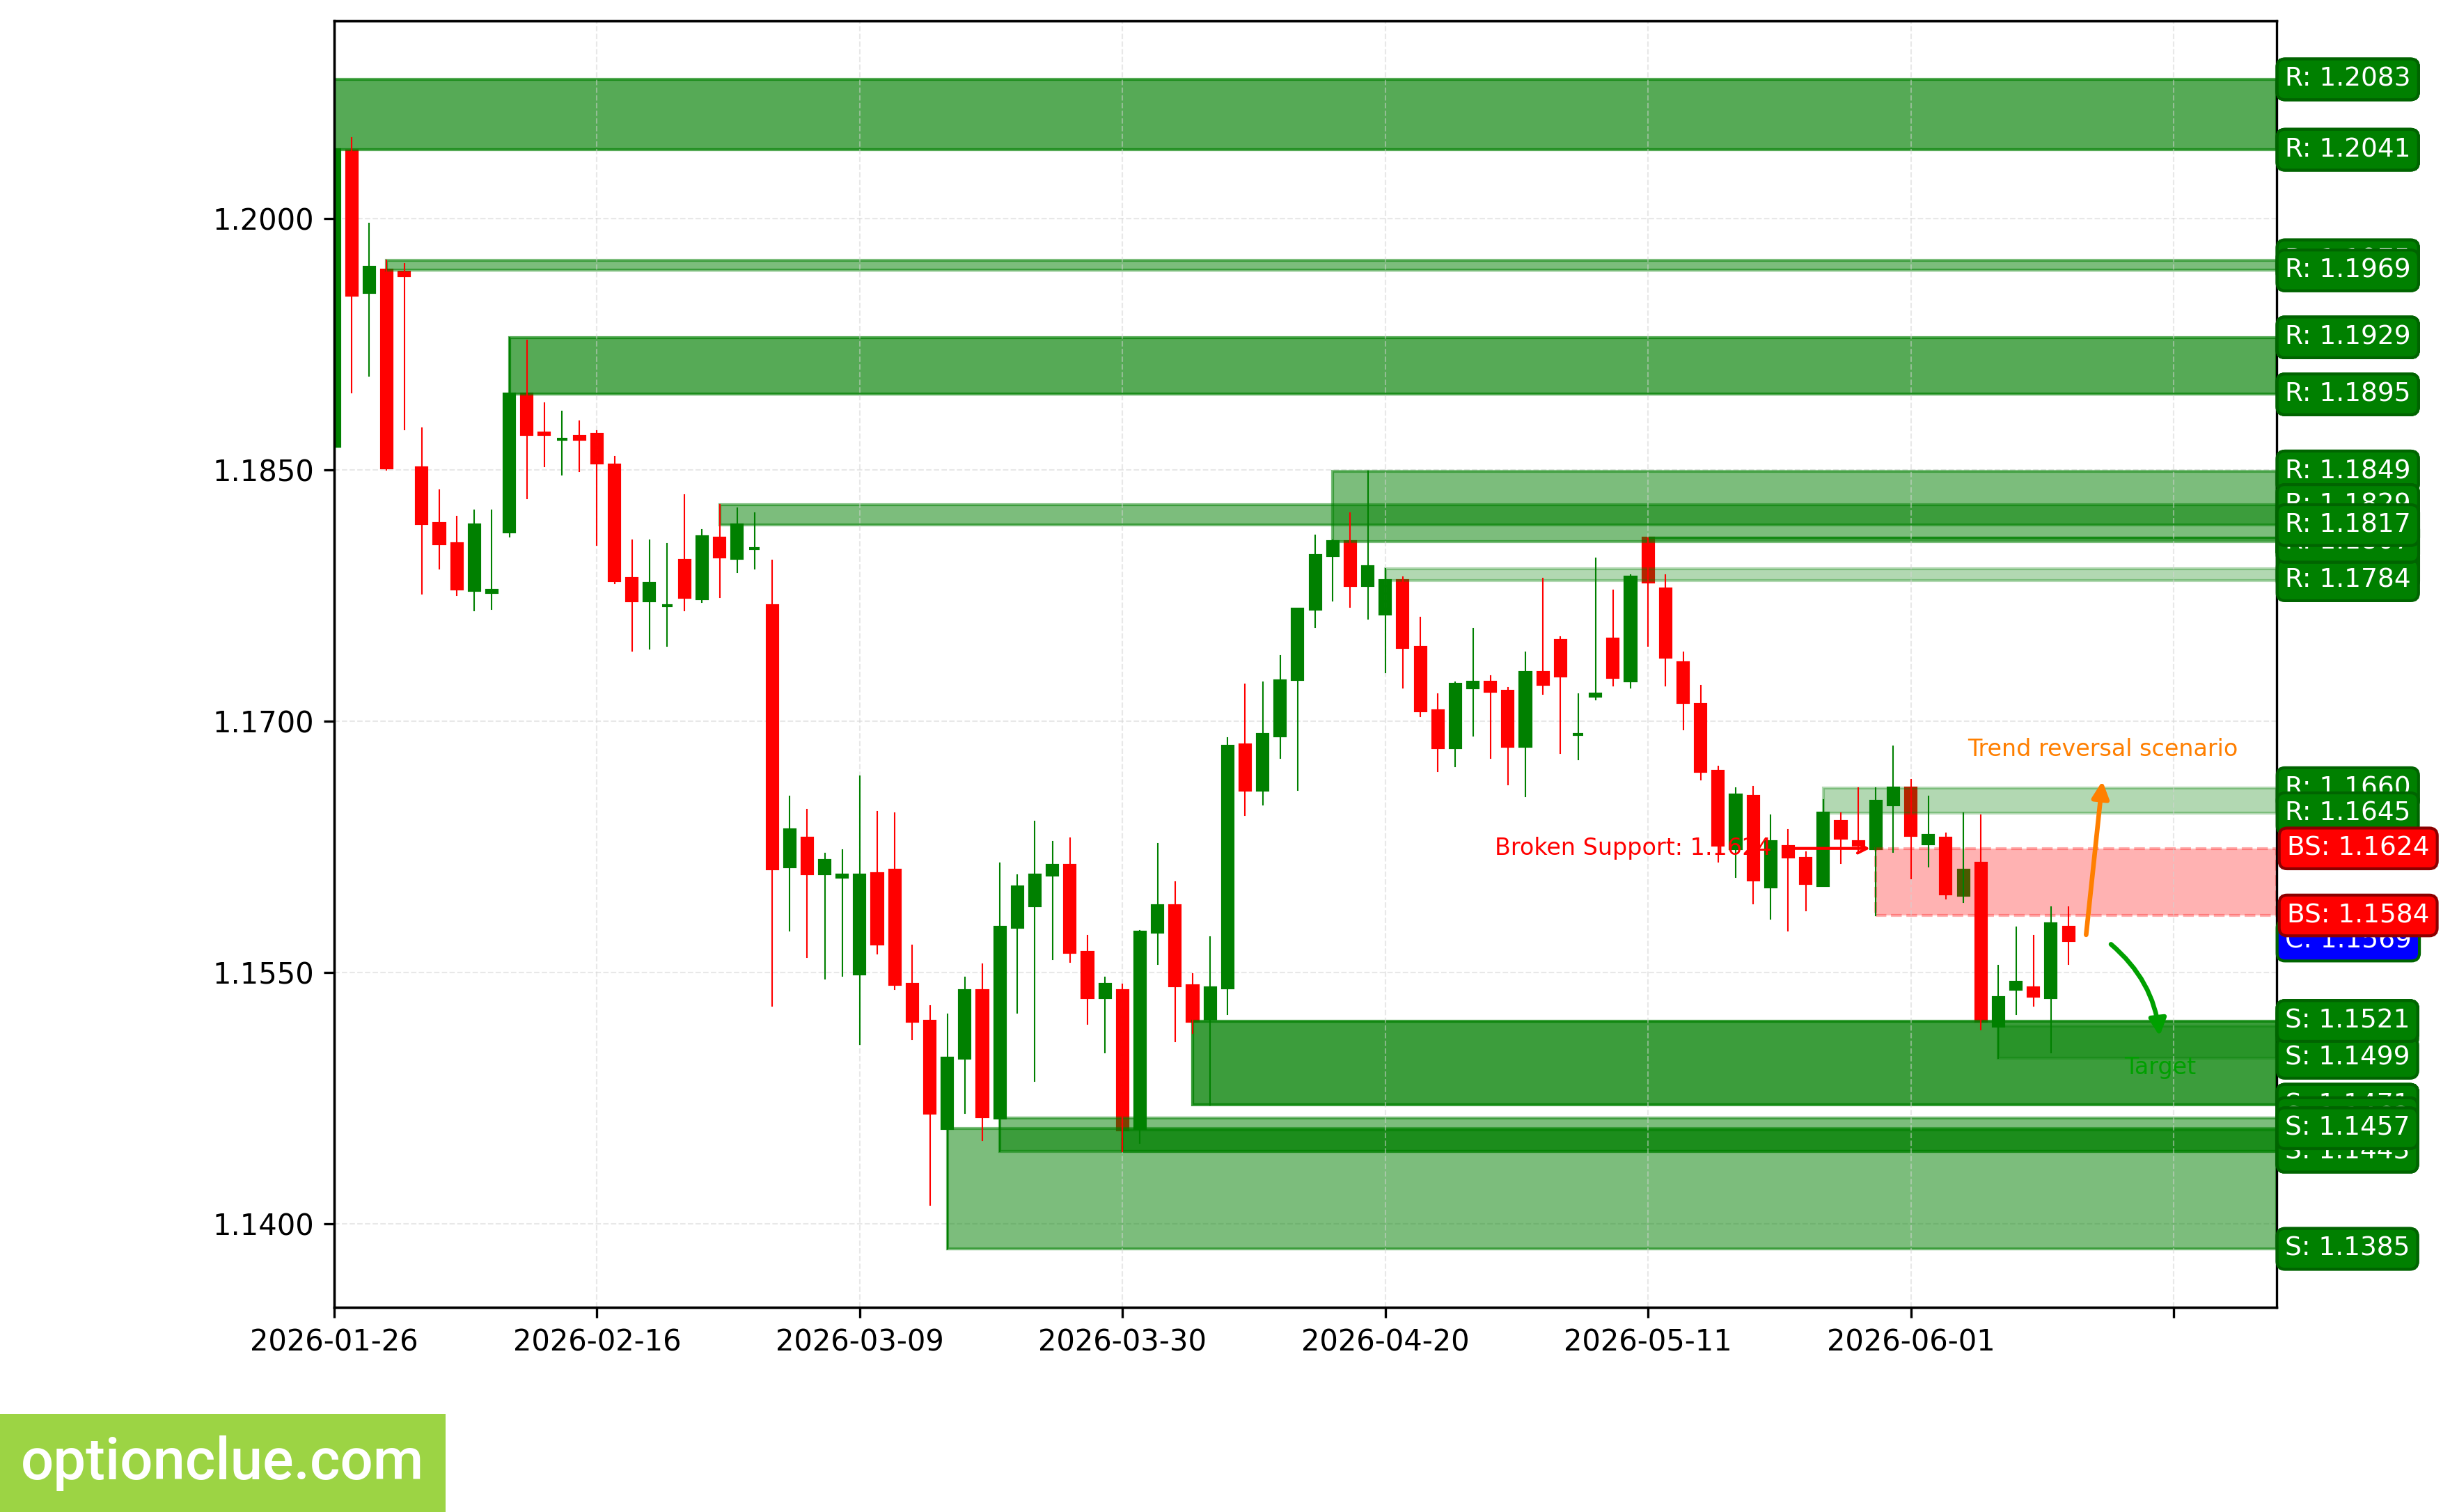
EURUSD. Technical analysis. D1.
British Pound (GBPUSD)
The bearish trend continues, an impulse wave is developing. The last broken level is support (1.3366 — 1.3427). The breakout occurred 6 candlesticks ago, and the price returned to this last broken level.
An intermediate target for the downward movement is the support level with boundaries at 1.3305 — 1.3333. In the case of successful trend development, a further target will be at the support level with boundaries at 1.3156 — 1.3196.
If the next correction ends near the resistance level (1.3466 — 1.3487), the potential reward/risk ratio could be approximately 1.5:1. If choosing the further target — around 2.8:1.
Short positions will remain relevant as long as the market is below the nearest daily timeframe resistance level with boundaries at 1.3466 — 1.3487. If the market successfully consolidates above this nearest resistance, the trend will reverse to the opposite (bullish).
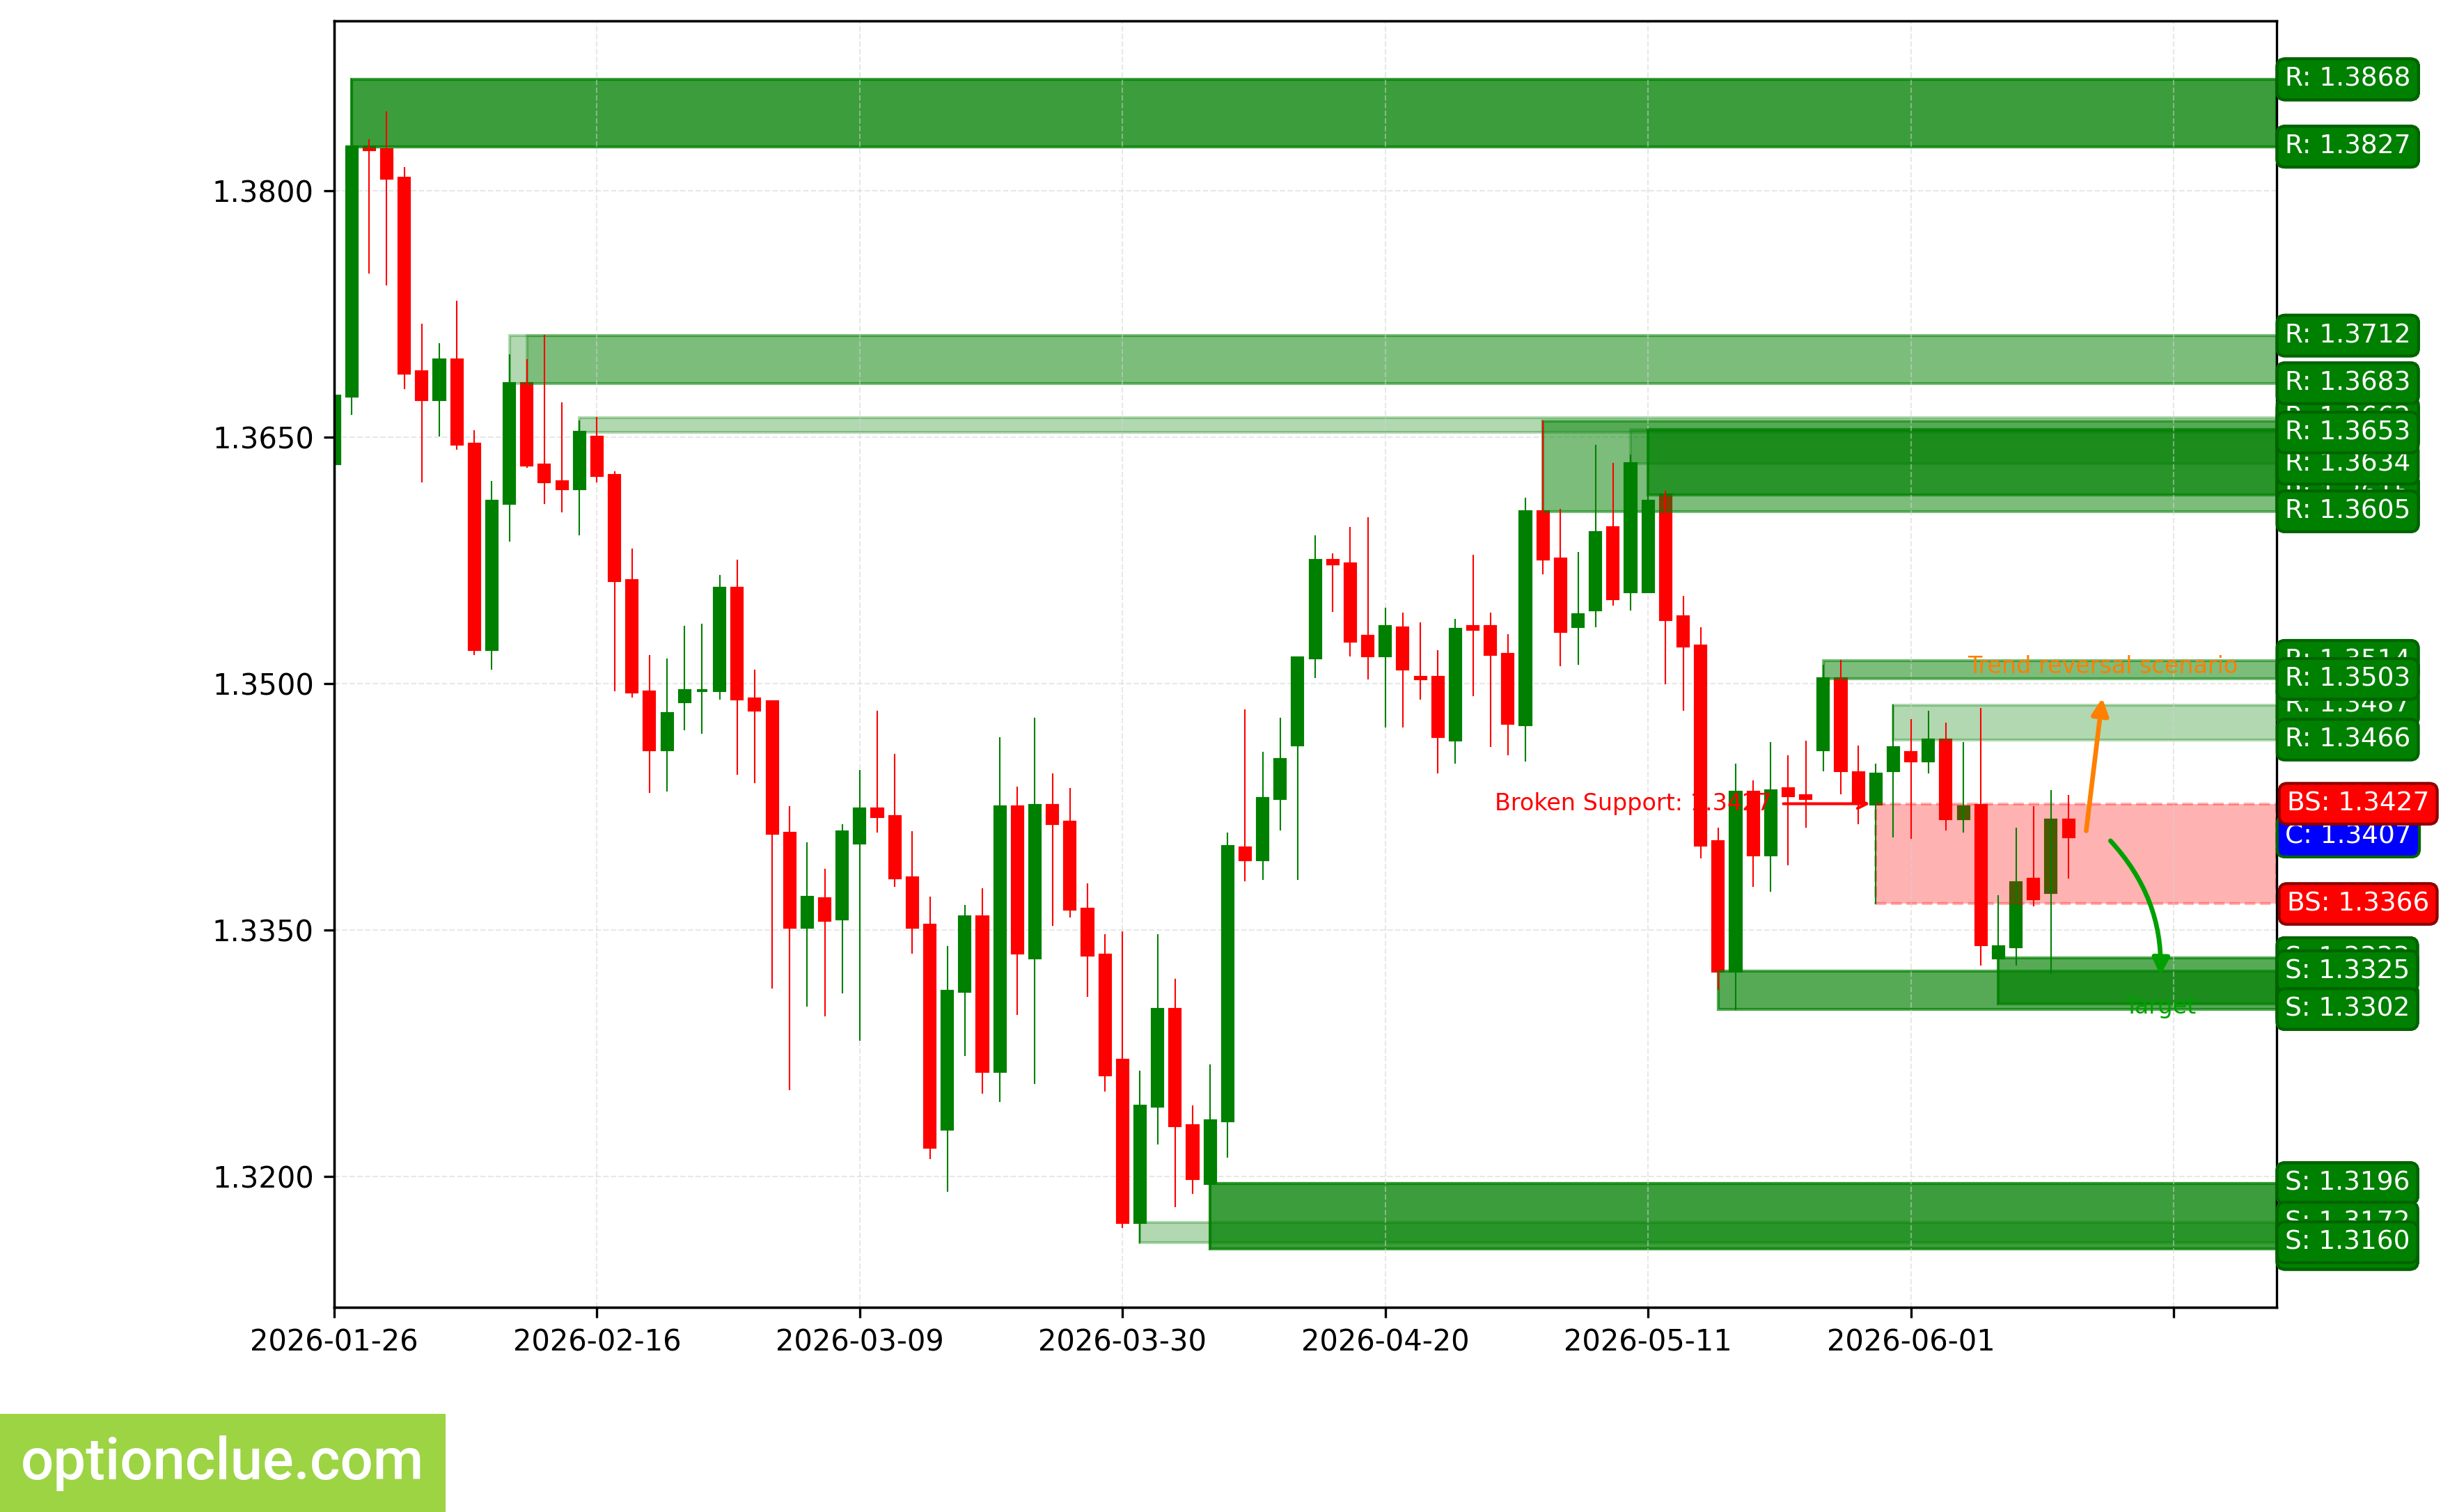
GBPUSD. Technical analysis. D1.
Swiss Franc (USDCHF)
The bullish trend continues, a correction ended 6 candlesticks ago, an impulse wave is developing. The last broken level is resistance (0.7871 — 0.7899). The breakout occurred 8 candlesticks ago.
An intermediate target for the upward movement is the resistance level with boundaries at 0.7999 — 0.8012. In the case of successful trend development, a further target will be at the resistance level with boundaries at 0.8087 — 0.8101.
The potential reward/risk ratio from current prices, when setting targets and fixing risks according to the daily timeframe levels, could be small (around 0.1:1). When using the further target — also small (approximately 0.5:1).
Long positions will remain relevant as long as the market is above the nearest daily timeframe support level with boundaries at 0.7794 — 0.7808. If the market successfully consolidates below this nearest support, the trend will reverse to the opposite (bearish).
USDCHF. Technical analysis. D1.
Japanese Yen (USDJPY)
The bullish trend continues, an impulse wave is developing. A buy entry point on a rebound may form after a correction is formed. The last broken level is resistance (157.68 — 157.89). The breakout occurred 22 candlesticks ago.
When the upward movement resumes, the first target will be the resistance level with boundaries at 160.55 — 160.59.
The potential reward/risk ratio from current prices, when setting targets and fixing risks according to the daily timeframe levels, could be small (around 0.2:1). If the next correction ends near the support level (159.08 — 159.21), the potential reward/risk ratio could be approximately 1.9:1.
Long positions will remain relevant as long as the market is above the nearest daily timeframe support level with boundaries at 159.08 — 159.21. If the market successfully consolidates below this support, the trend will reverse to the opposite (bearish).
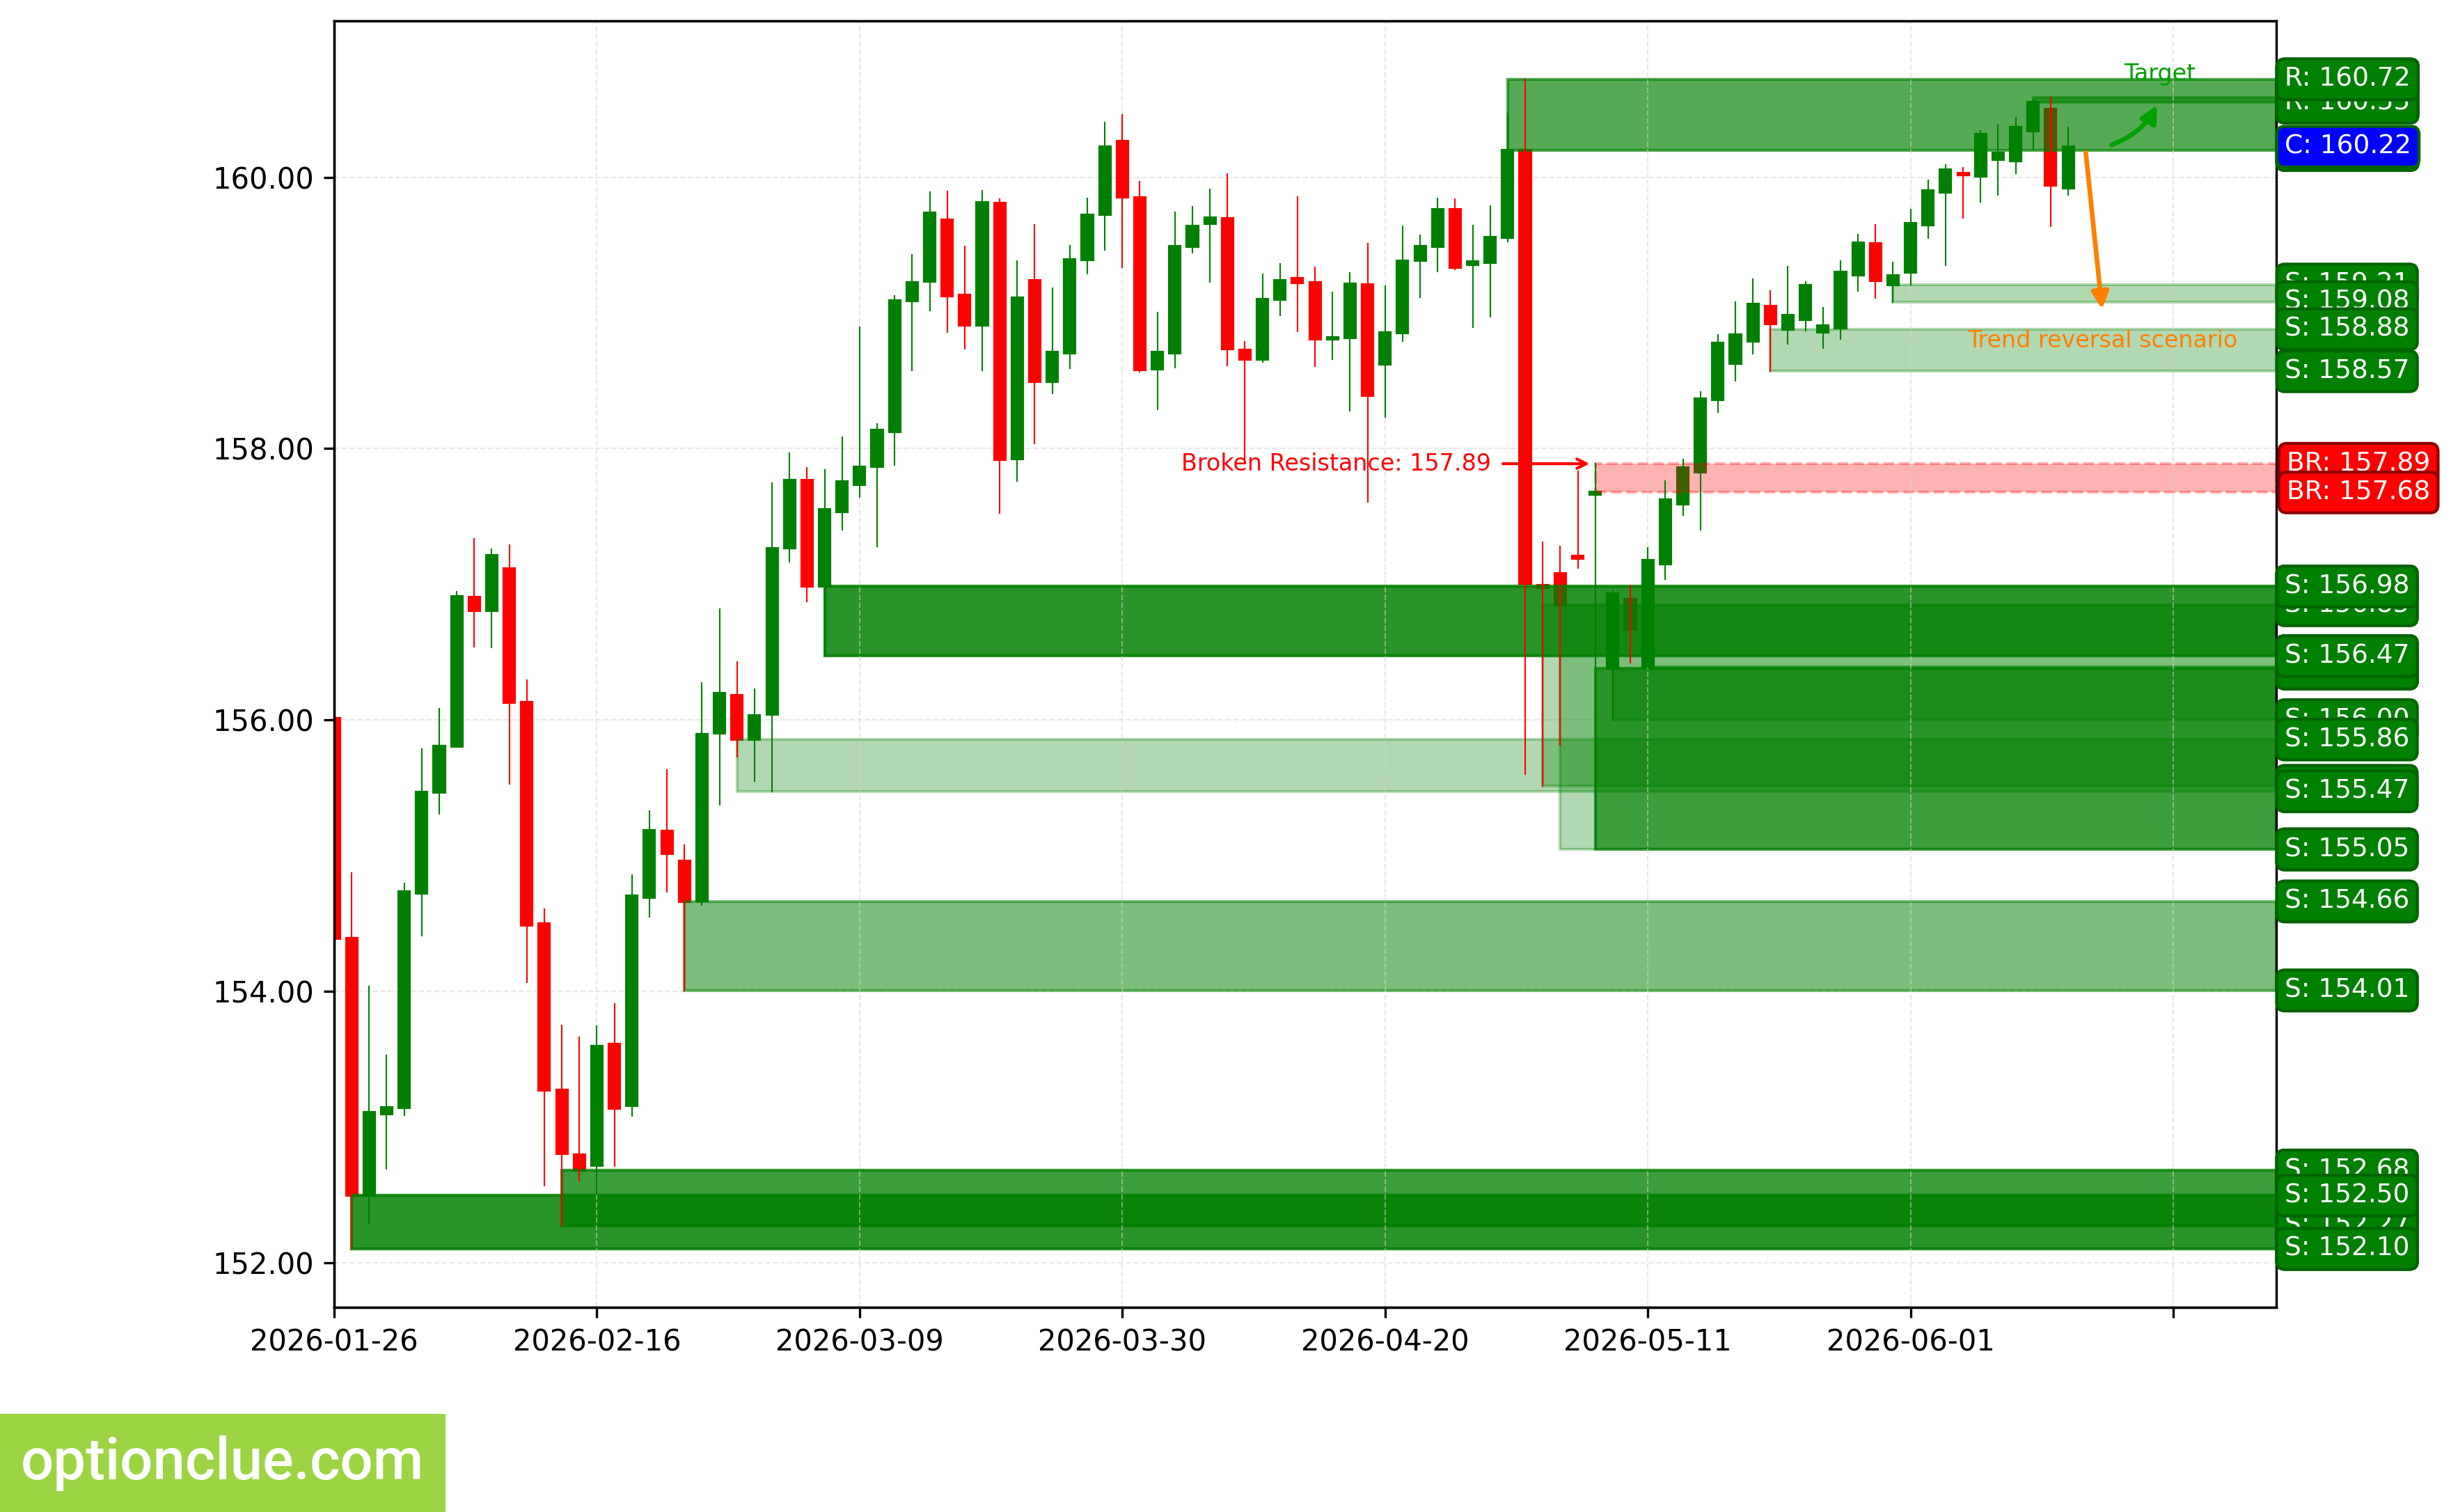
USDJPY. Technical analysis. D1.
Canadian Dollar (USDCAD)
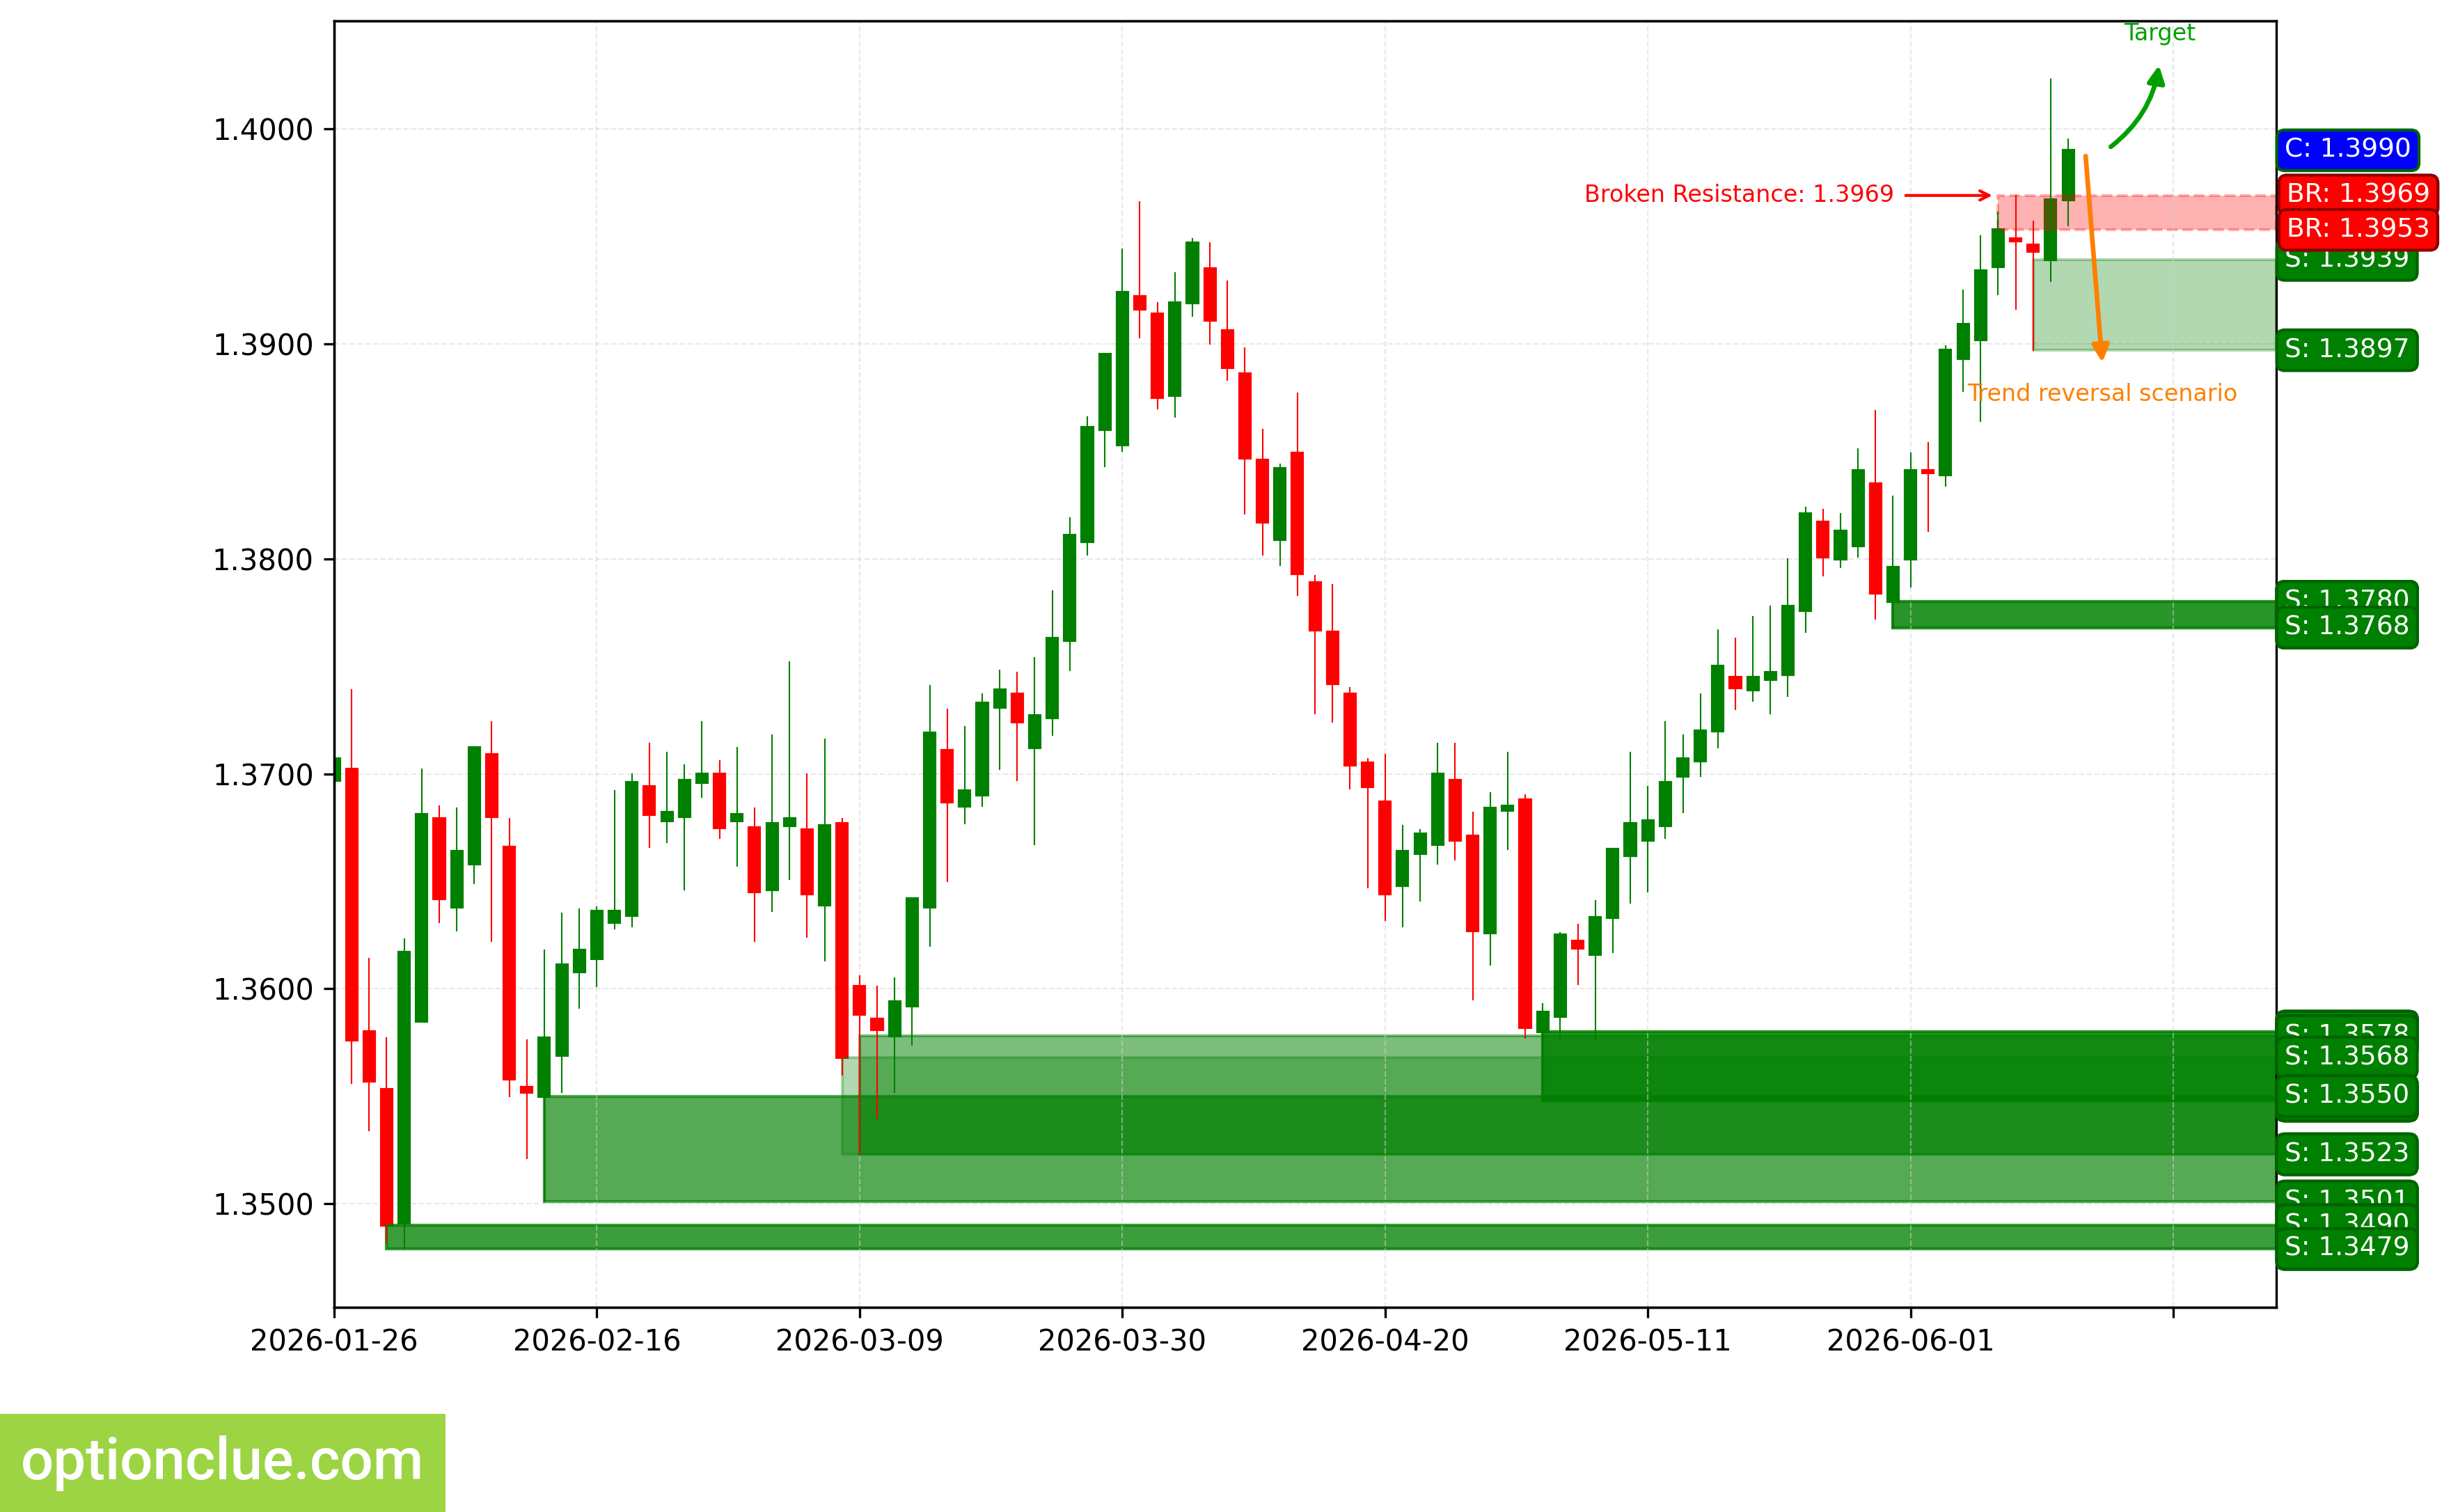
The bullish trend continues, an impulse wave is developing. A buy entry point on a rebound may appear after a correction is formed. The last broken level is resistance (1.3953 — 1.3969). The breakout occurred on the last closed candlestick.
An intermediate target for the upward movement is the resistance level with boundaries at 1.4108 — 1.4130. In the case of successful trend development, a further target will be at the resistance level with boundaries at 1.4265 — 1.4296.
If the next correction ends near the support level (1.3897 — 1.3939), the potential reward/risk ratio could be approximately 2:1. If choosing the further target — around 3.7:1. If the correction ends near the last broken level (1.3953 — 1.3969), the potential reward/risk ratio could be around 1.1:1. For the further target — approximately 2.2:1.
Long positions will remain relevant as long as the market stays above the nearest support level with boundaries at 1.3897 — 1.3939. If the market successfully consolidates below this nearest support, the trend will reverse to the opposite (bearish).
USDCAD. Technical analysis. D1.
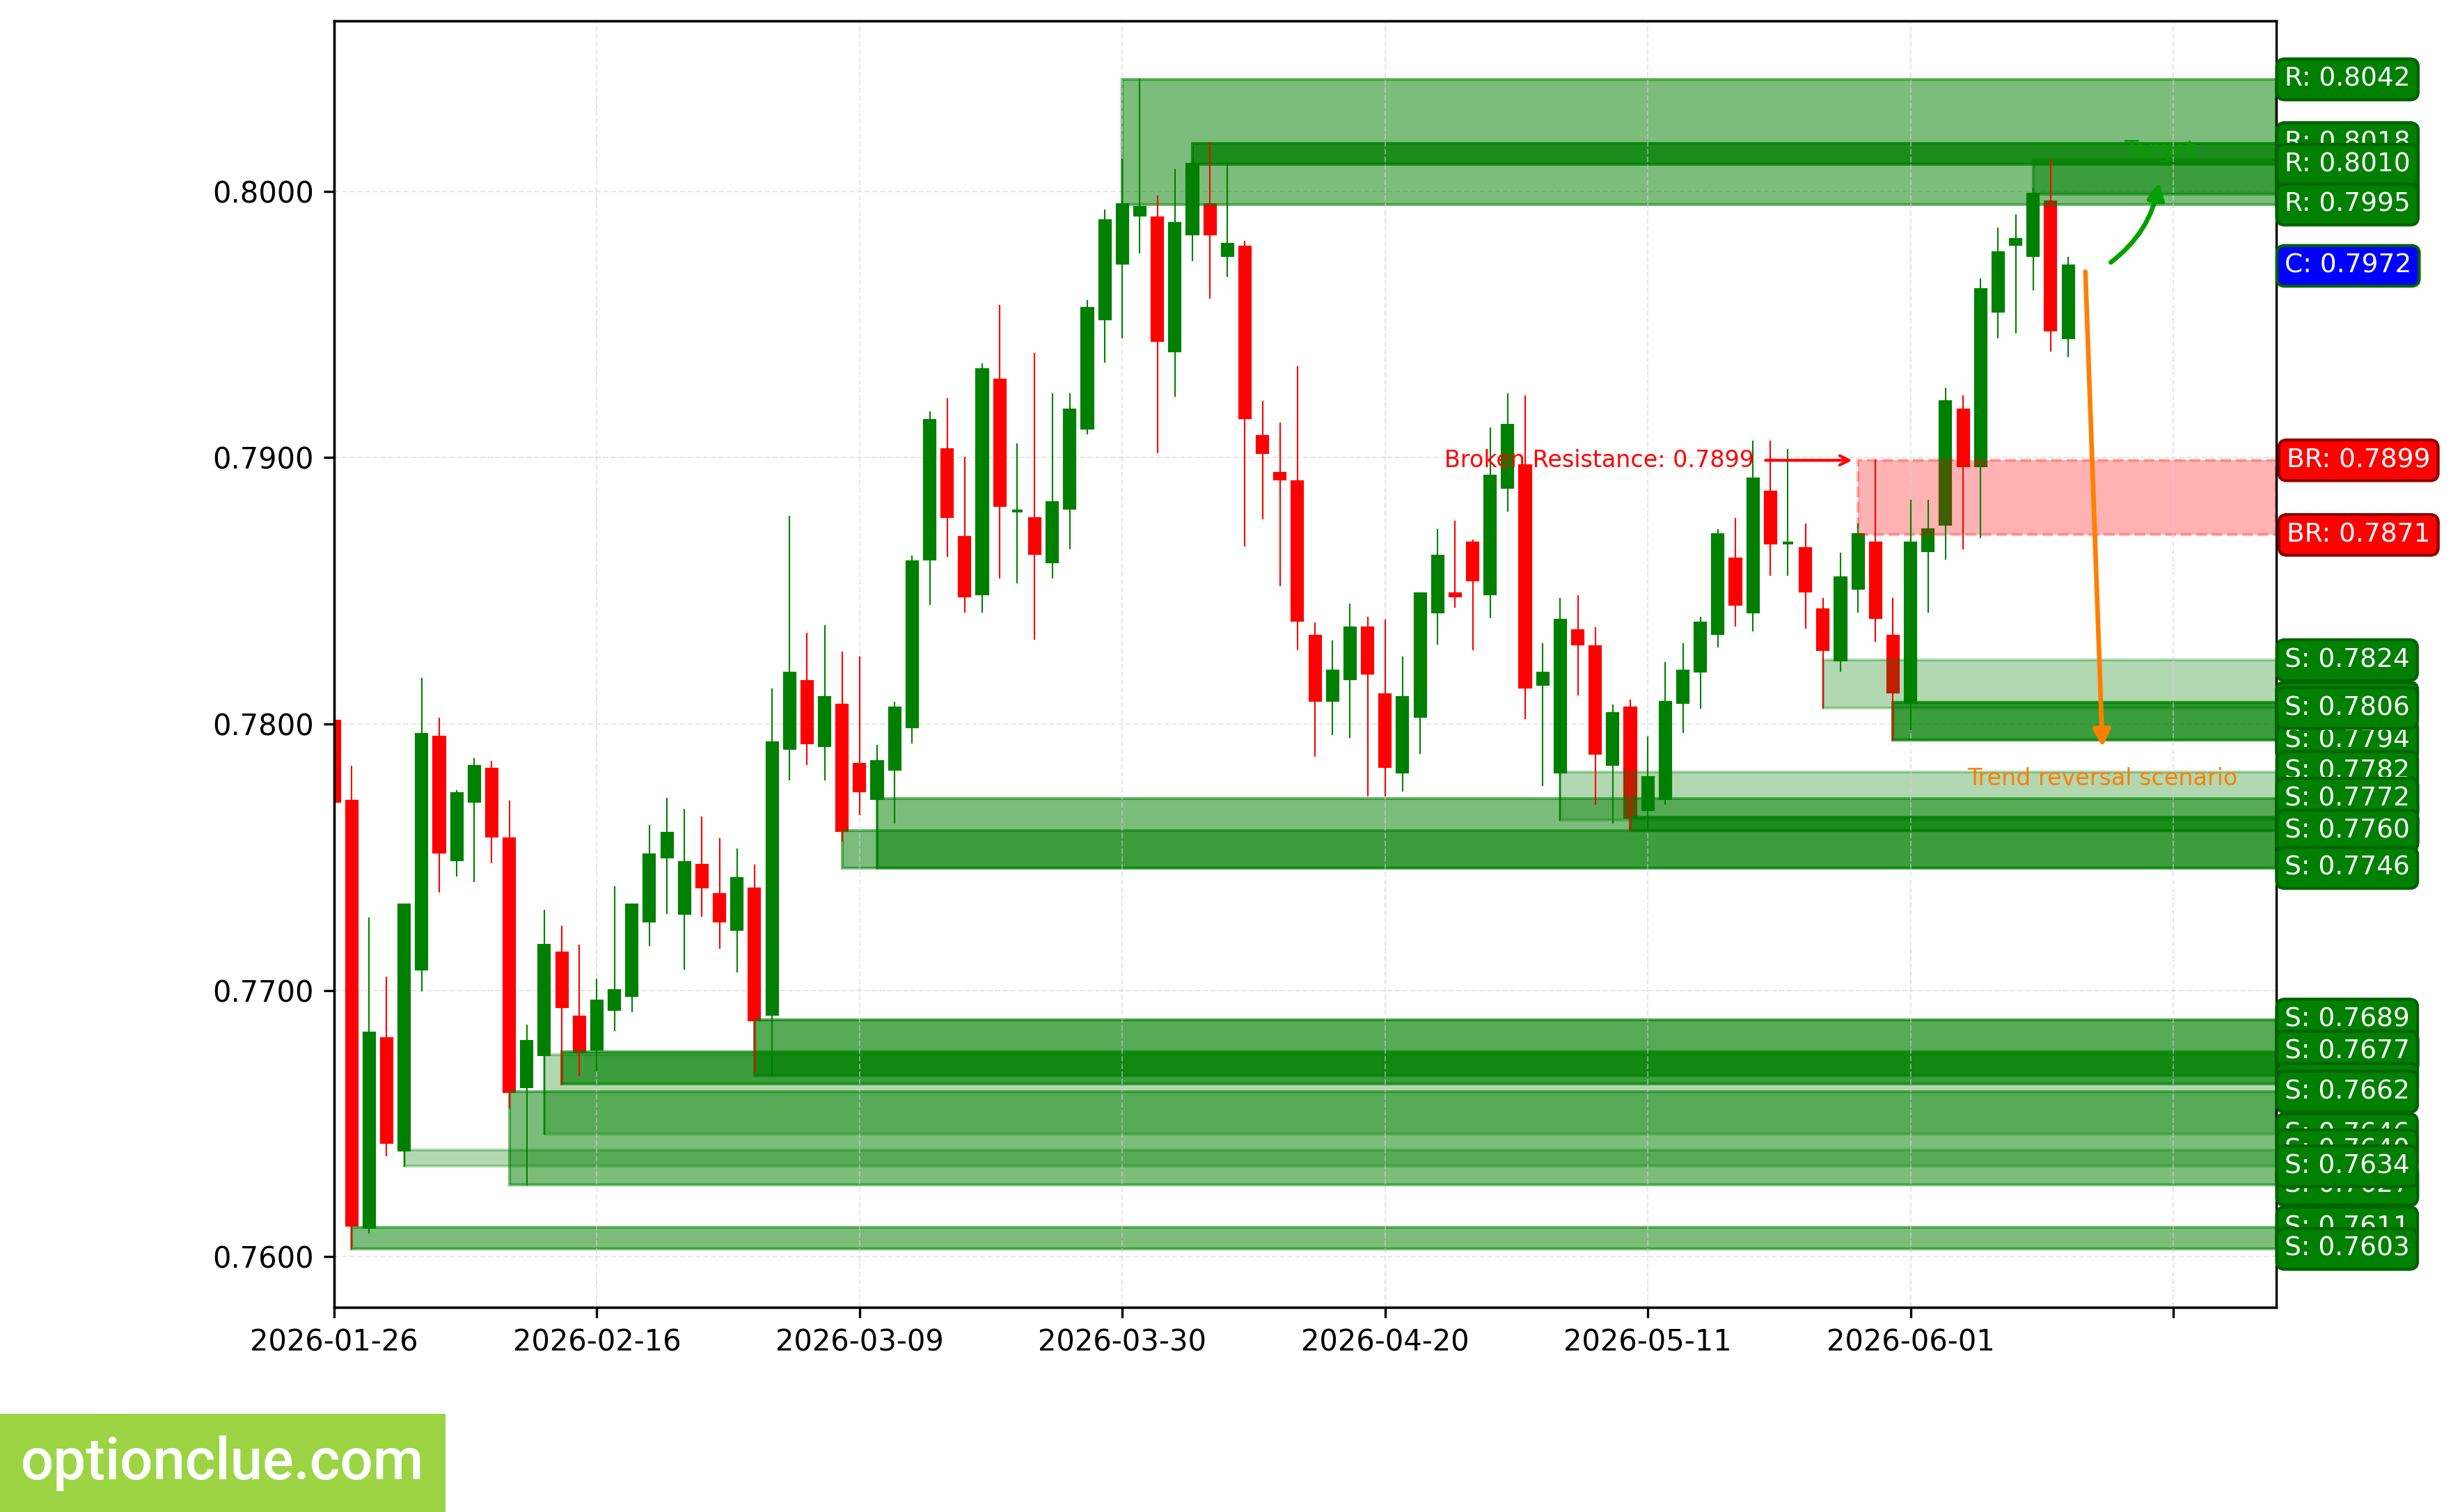
Australian Dollar (AUDUSD)
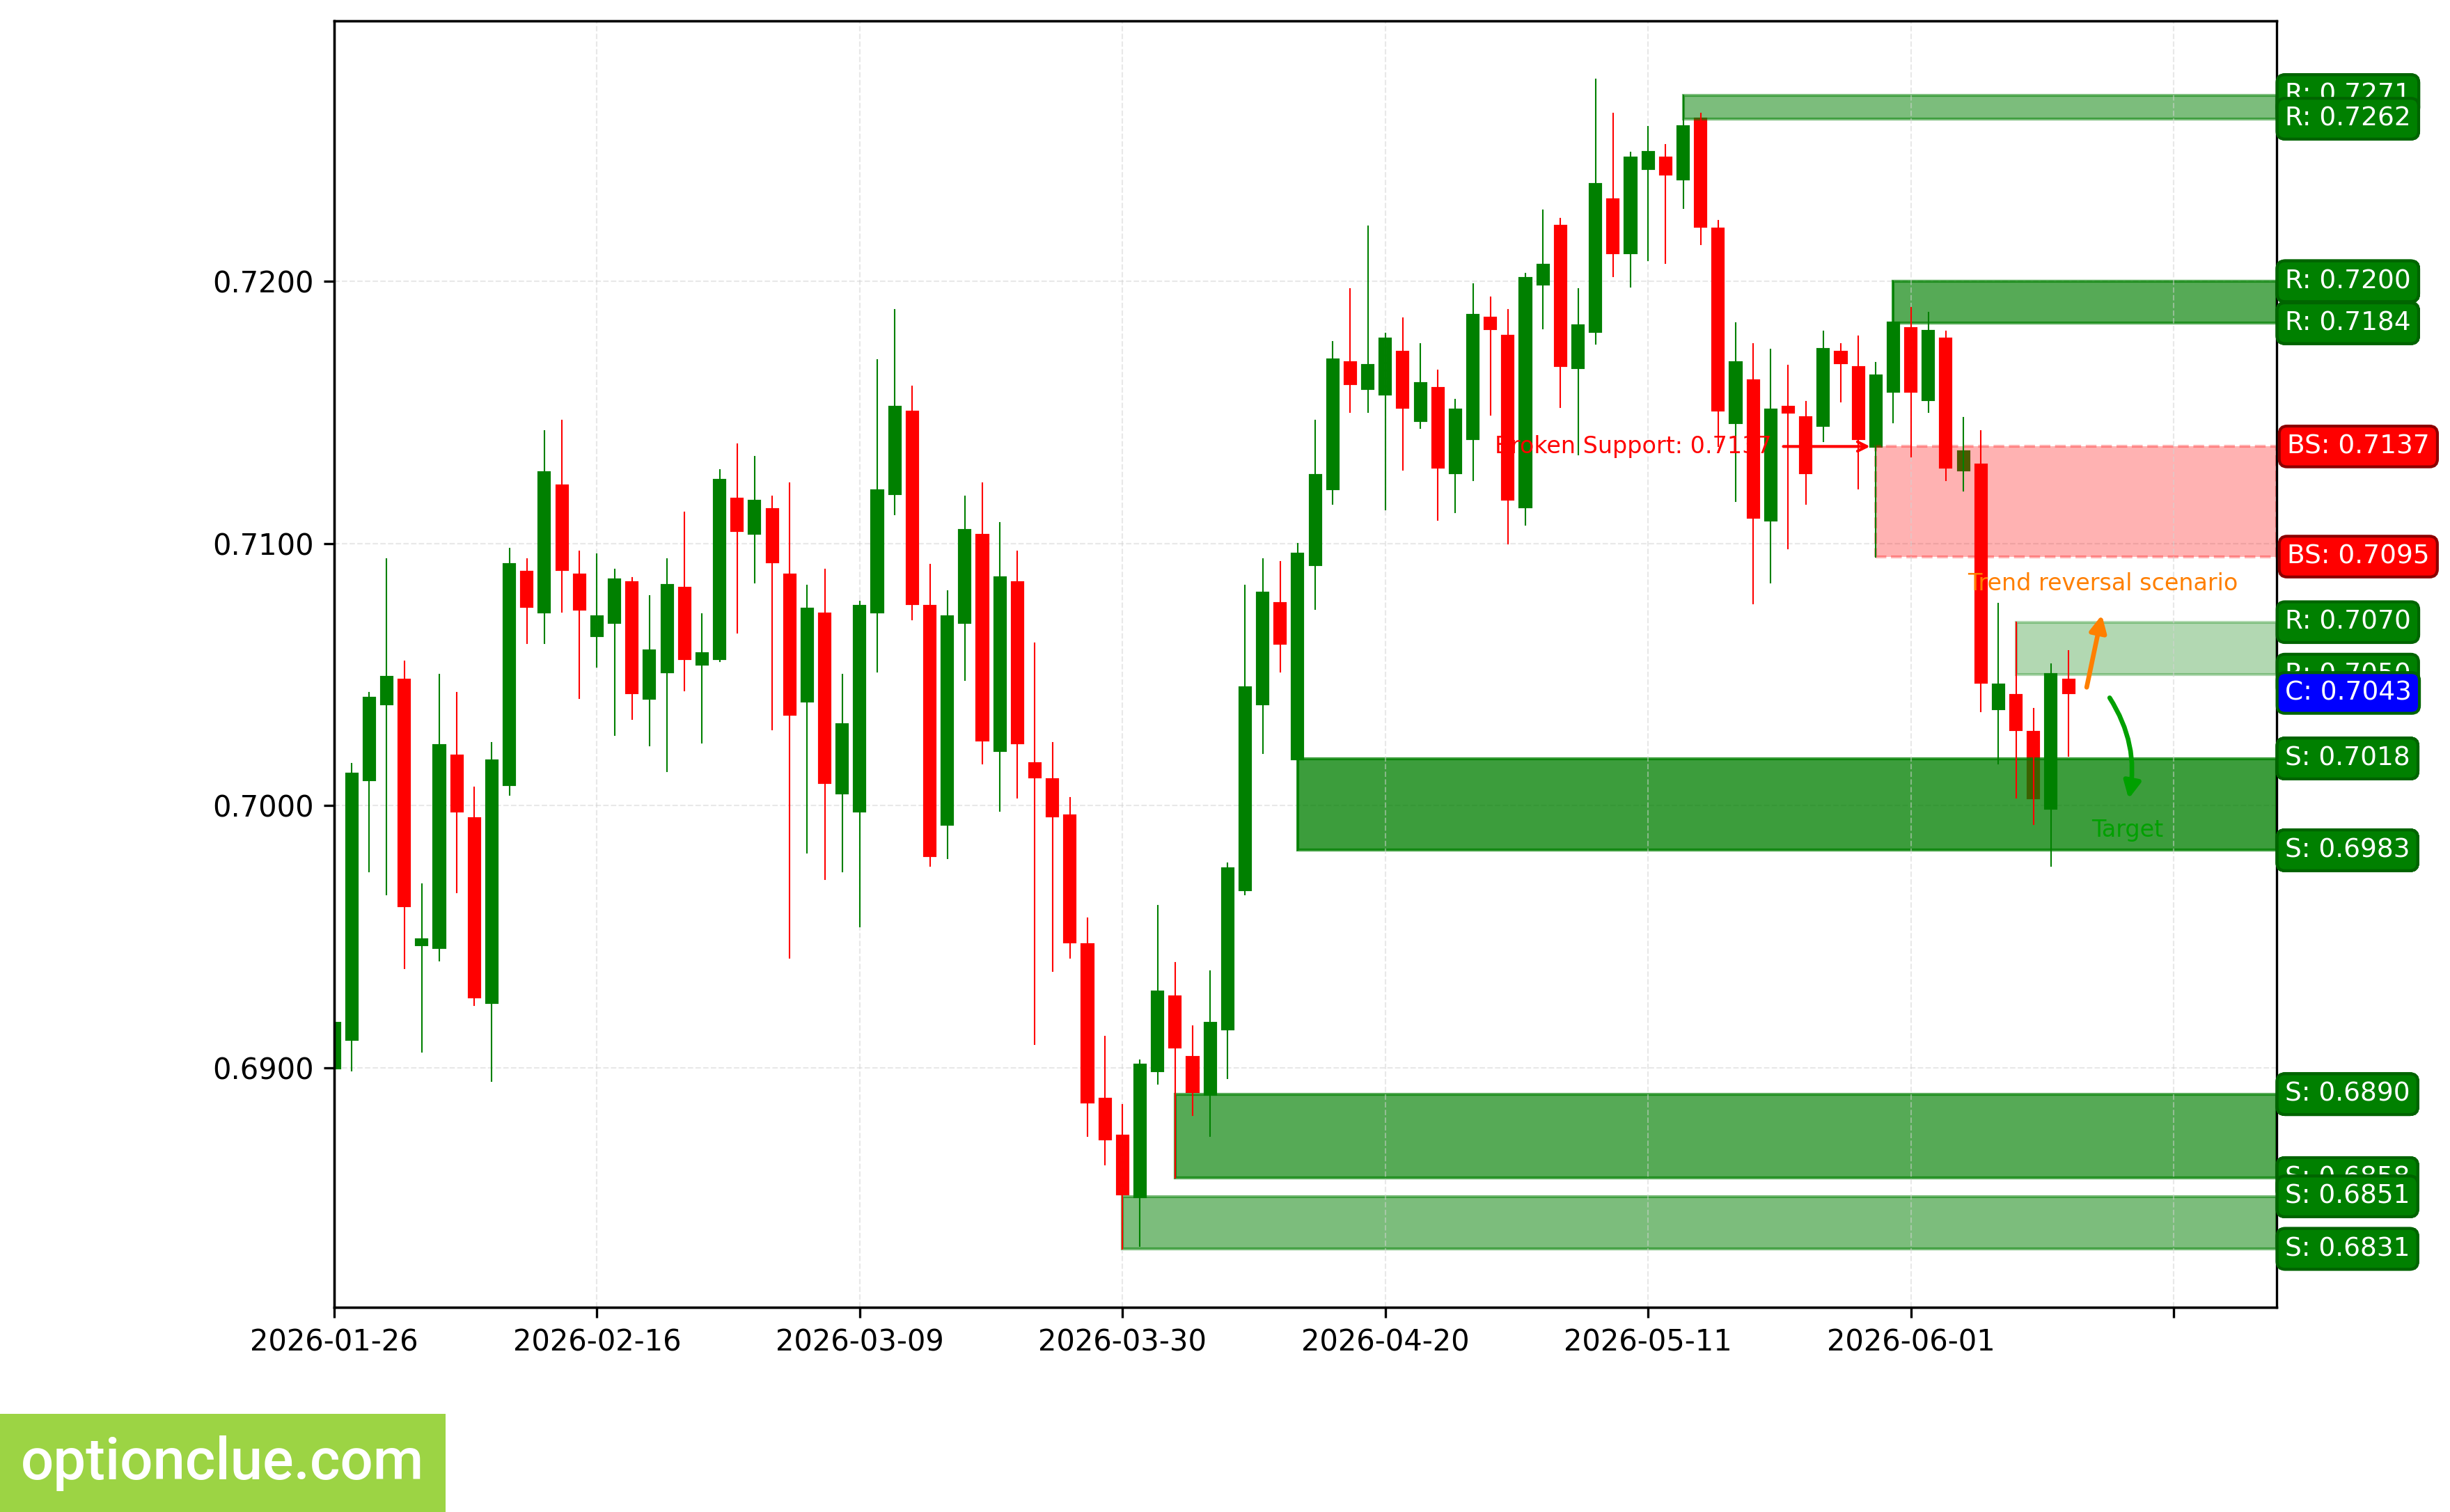
The bearish trend continues, an impulse wave is developing. A sell entry point on a rebound may form after a correction is formed. The last broken level is support (0.7095 — 0.7137). The breakout occurred 6 candlesticks ago.
An intermediate target for the downward movement is the support level with boundaries at 0.6983 — 0.7018. In the case of successful trend development, a further target will be at the support level with boundaries at 0.6858 — 0.6890.
The potential reward/risk ratio from current prices, when setting targets and fixing risks according to the daily timeframe levels, could be small (around 0.3:1). When using the further target — approximately 1.7:1. If the next correction ends near the resistance level (0.7050 — 0.7070), the potential reward/risk ratio could be insignificant (around 0.6:1). If choosing the further target — approximately 2.3:1.
Short positions will remain relevant as long as the market is below the nearest daily timeframe resistance level with boundaries at 0.7050 — 0.7070. If the market successfully consolidates above this nearest resistance, the trend will reverse to the opposite (bullish).
AUDUSD. Technical analysis. D1.
Bitcoin (BTC)
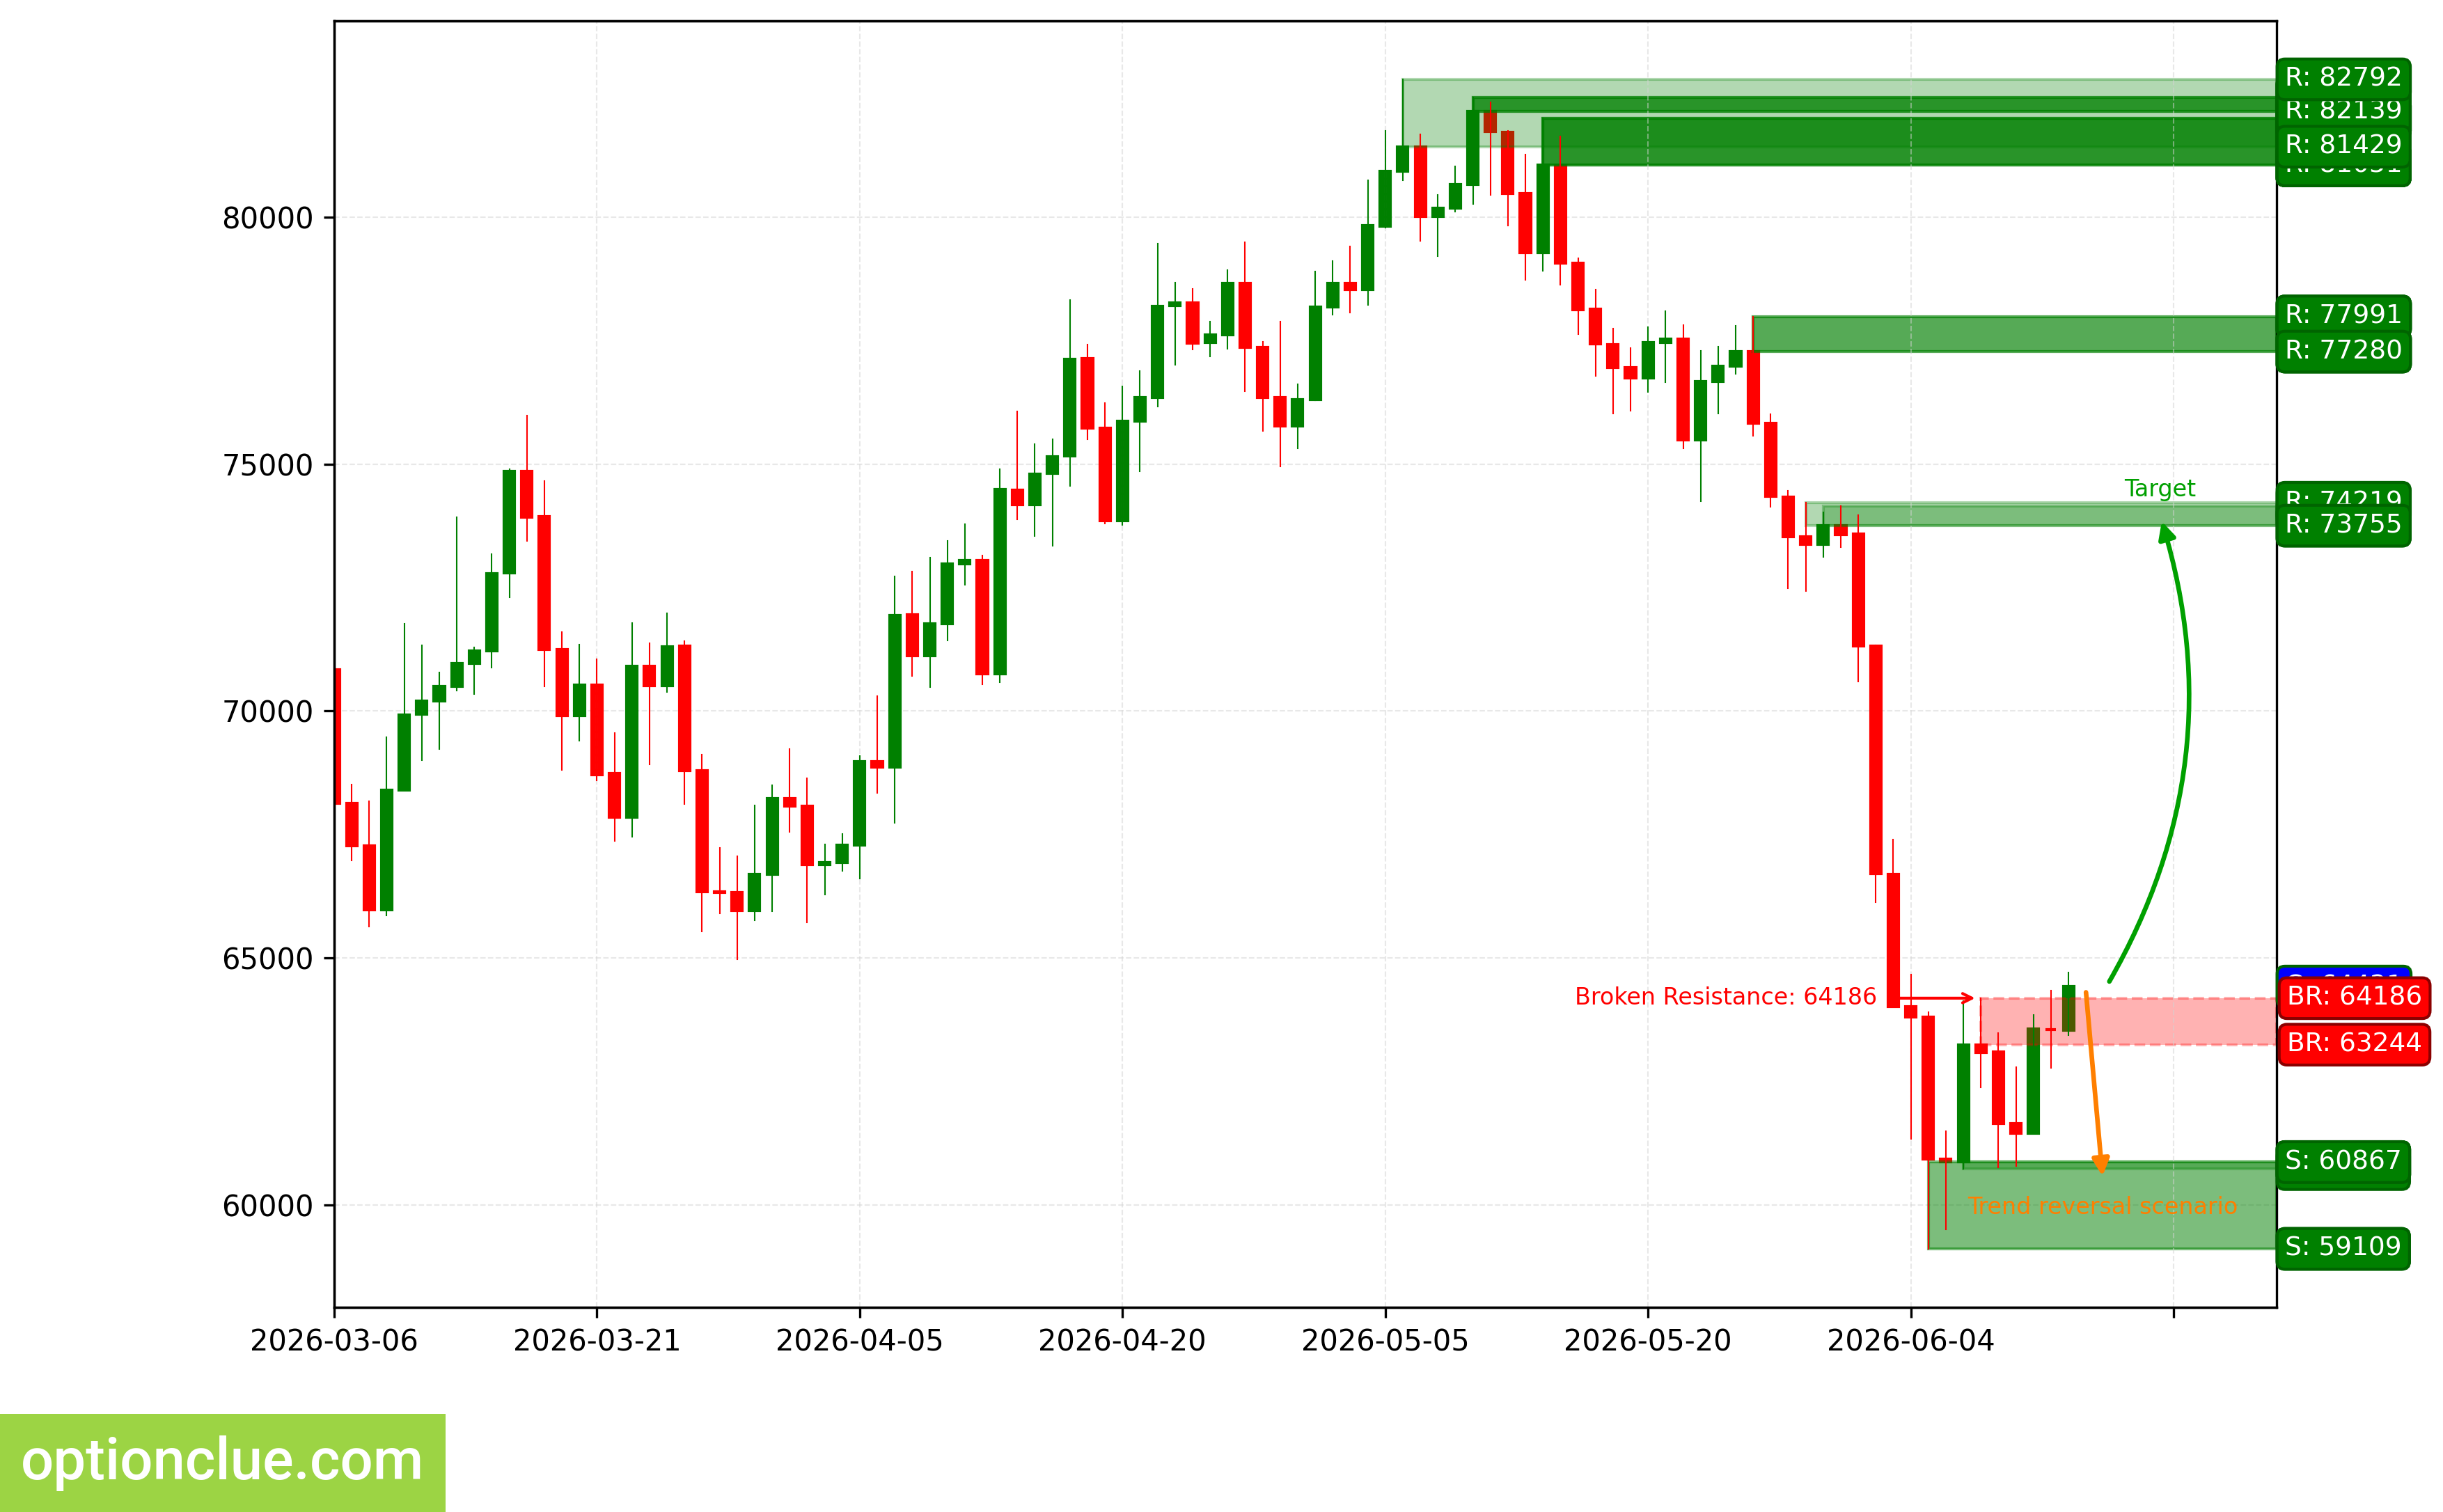
The trend changed to bullish when the resistance level (63244 — 64186) was broken on the last closed candlestick. An impulse wave is developing. Buy entry points on a rebound on the daily timeframe may appear after a correction is formed.
When the upward movement resumes, the first target will be the resistance level with boundaries at 73755 — 74154. In the case of successful trend development, a further target will be at the resistance level with boundaries at 81051 — 82006.
If the next correction ends near the support level (60724 — 60867), the potential reward/risk ratio could be more than 4:1. If choosing the further target — around 7:1.
Long positions will remain relevant as long as the market is above the nearest support level with boundaries at 60724 — 60867. If the market successfully consolidates below this support, the trend will reverse to the opposite (bearish).
BTC. Technical analysis. D1.
Ether (ETH)
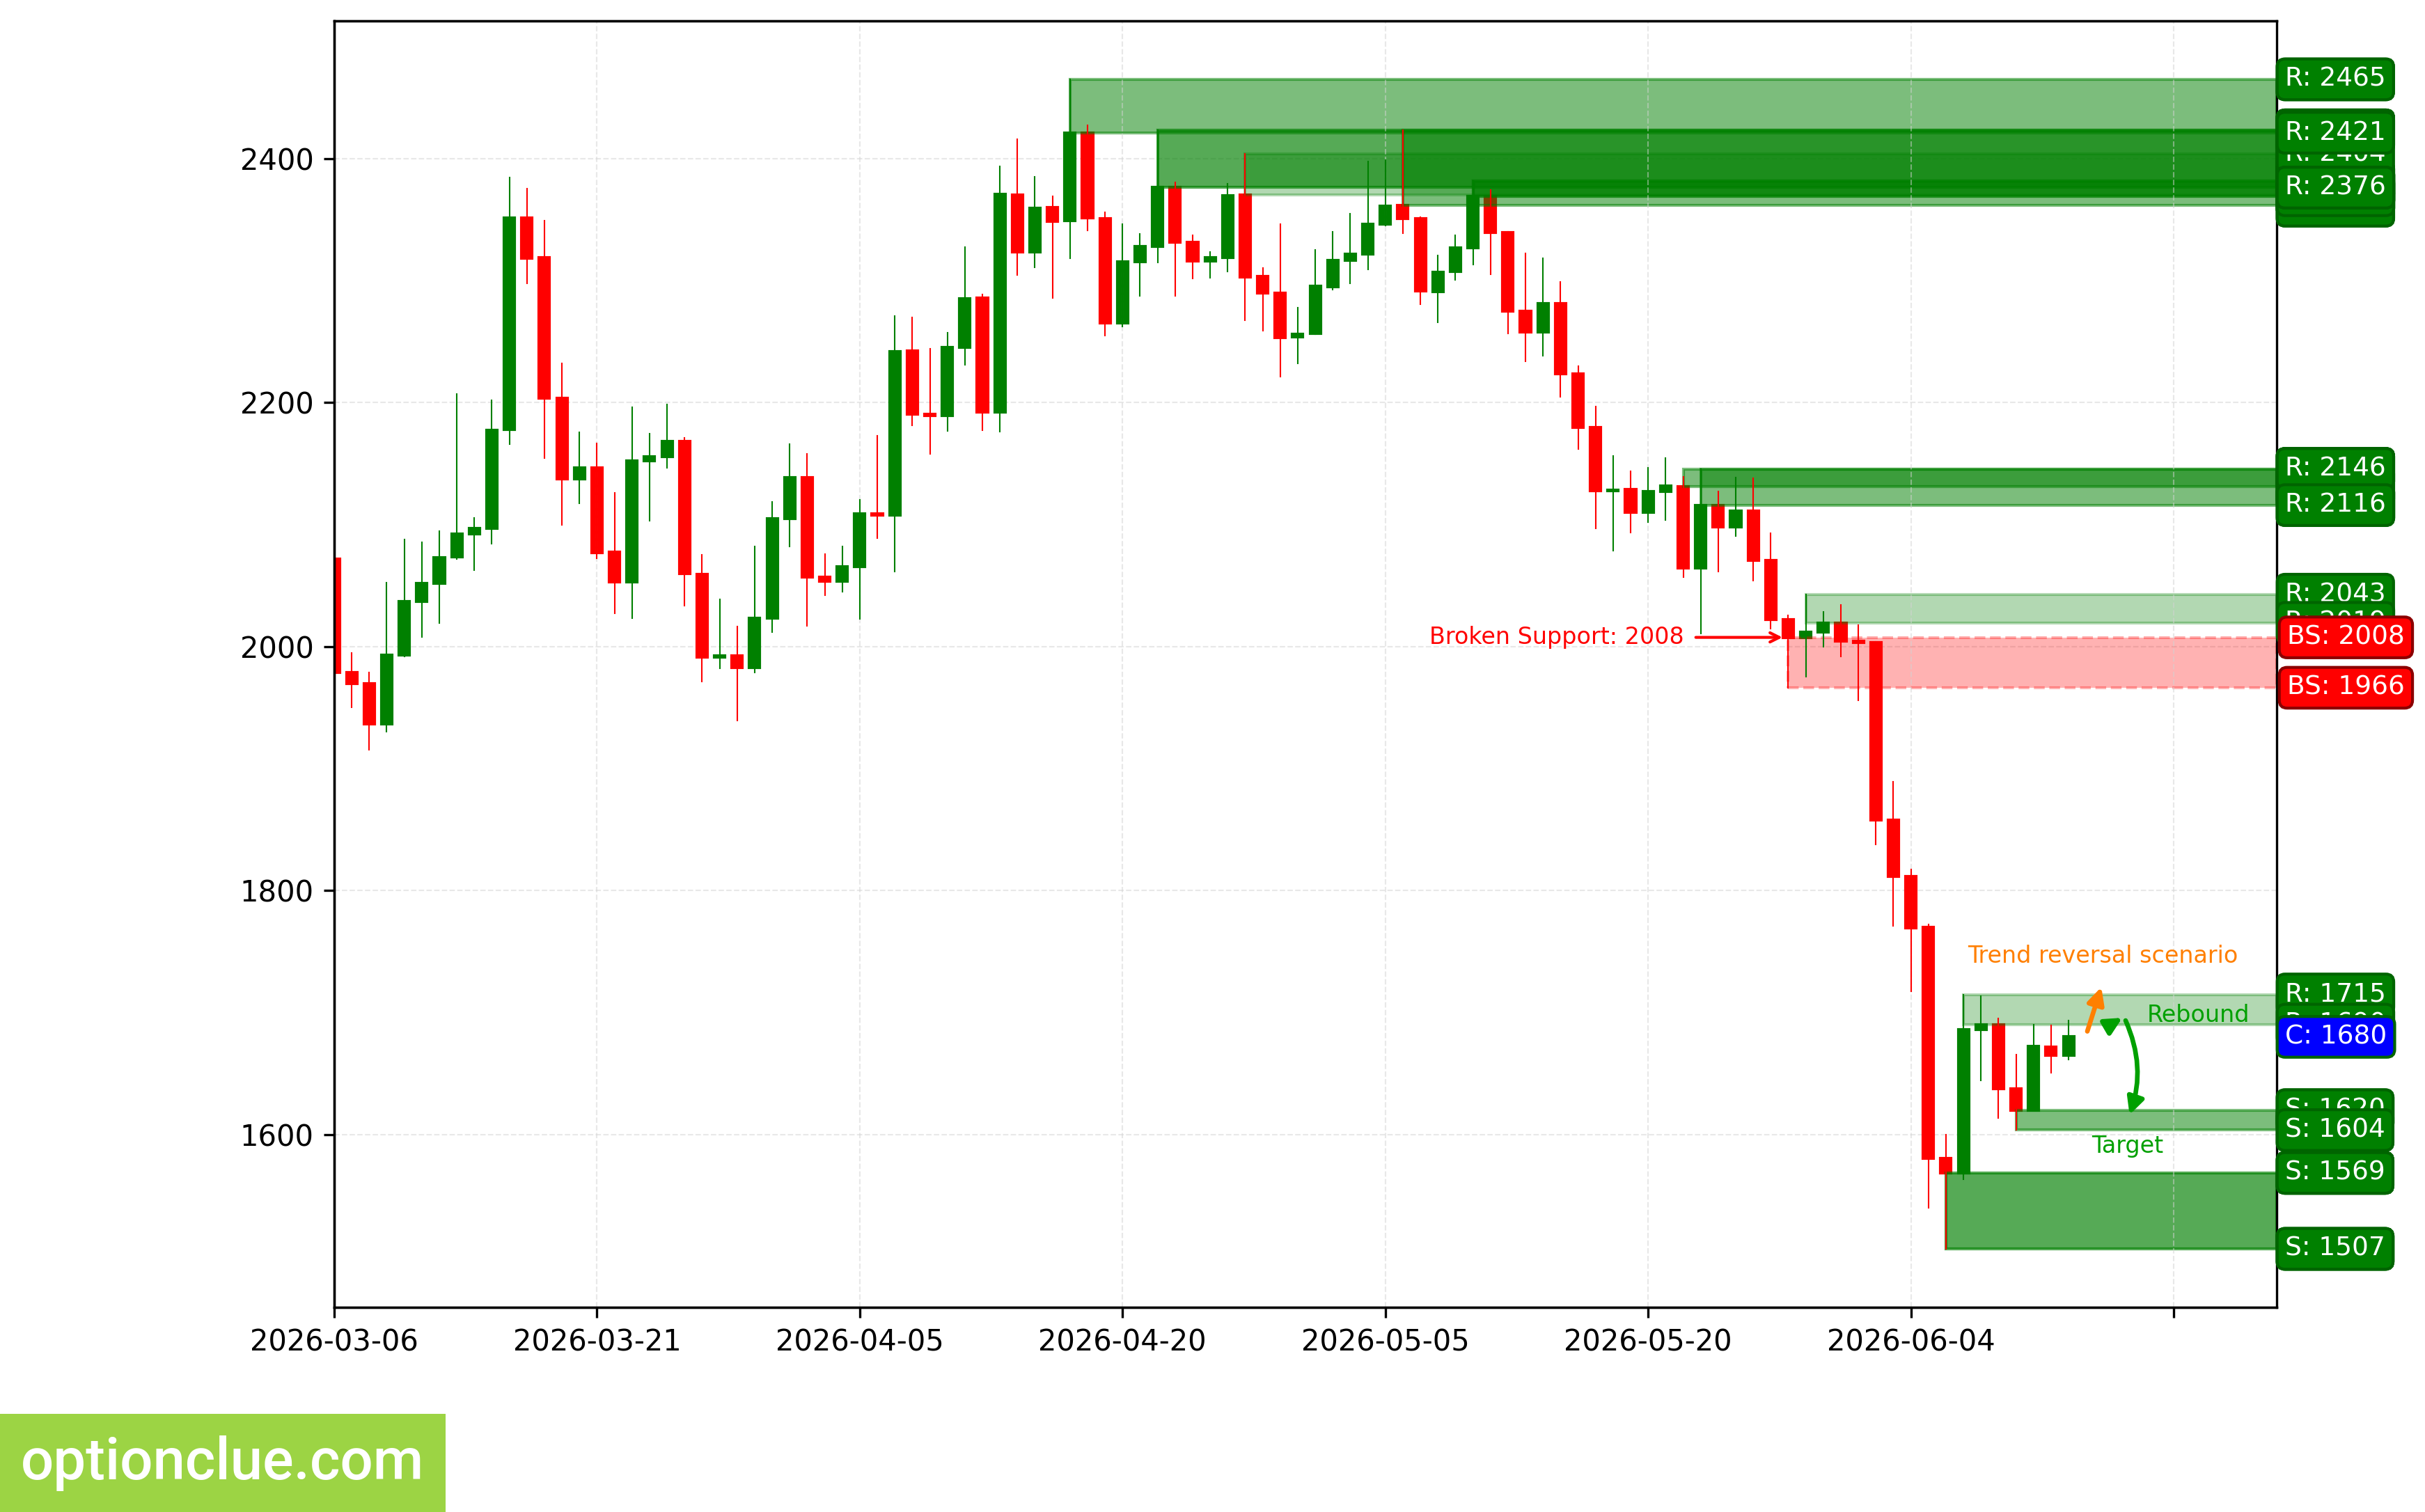
The bearish trend continues, an impulse wave is developing. A sell entry point on a rebound may form after a correction is formed. The last broken level is support (1966 — 2008). The breakout occurred 12 candlesticks ago.
When the downward movement resumes, the first target will be the support level with boundaries at 1604 — 1620.
The potential reward/risk ratio from current prices, when setting targets and fixing risks according to the daily timeframe levels, could be small (around 0.4:1). If the next correction ends near the resistance level (1690 — 1715), the potential reward/risk ratio could be insignificant (around 0.7:1).
Short positions will remain relevant as long as the market is below the nearest daily timeframe resistance level with boundaries at 1690 — 1715. If the market successfully consolidates above this nearest resistance, the trend will reverse to the opposite (bullish).
ETH. Technical analysis. D1.
Apple Inc (AAPL)
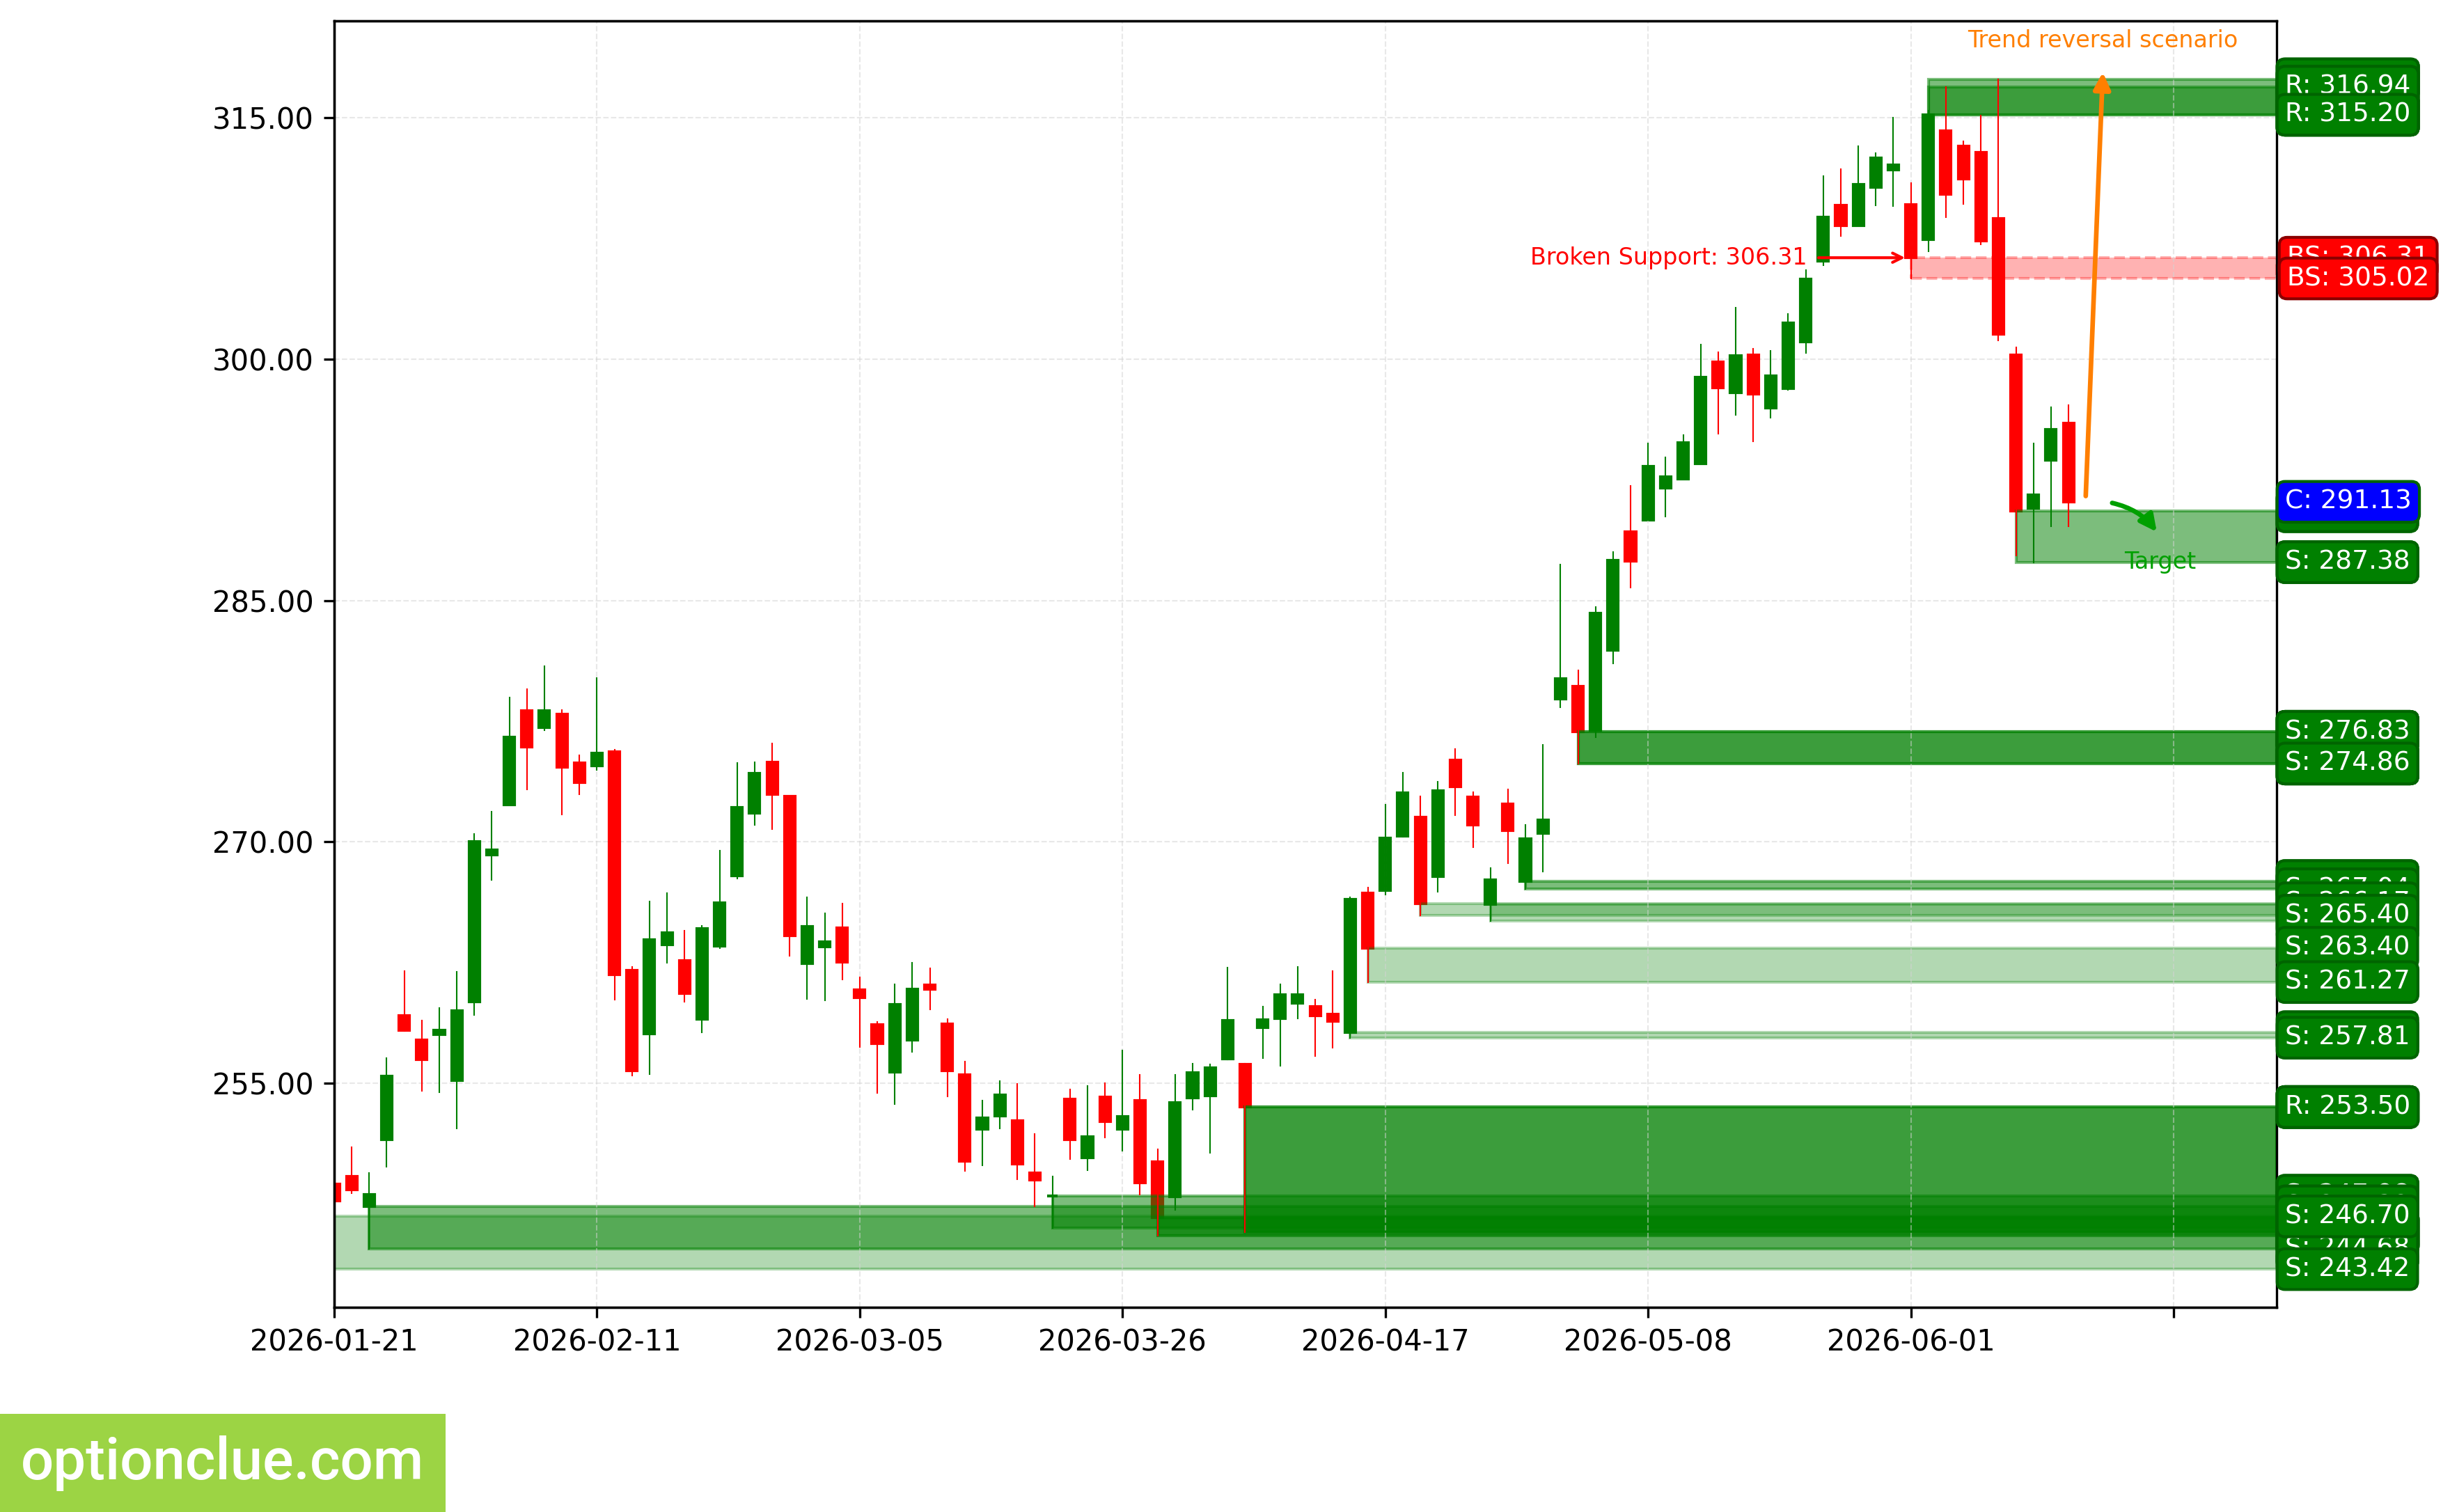
The trend changed to bearish 5 candlesticks ago when the support level (305.02 — 306.31) was broken. An impulse wave is developing. A sell entry point on a rebound may appear after a correction is formed.
An intermediate target for the downward movement is the support level with boundaries at 287.38 — 290.55. In the case of successful trend development, a further target will be at the support level with boundaries at 274.86 — 276.83.
The potential reward/risk ratio from current prices, when setting targets and fixing risks according to the daily timeframe levels, could be less than 0.1:1. When using the further target — also small (approximately 0.4:1). If the next correction ends near the resistance level (315.20 — 317.40), the potential reward/risk ratio could be more than 2:1. For the further target — approximately 4:1. If the correction ends near the last broken level (305.02 — 306.31), the potential reward/risk ratio could be insignificant (around 0.8:1).
Short positions will remain relevant as long as the market is below the nearest resistance level with boundaries at 315.20 — 317.40. If the market successfully consolidates above this nearest resistance, the trend will reverse to the opposite (bullish).
AAPL. Technical analysis. D1.
NVIDIA Corp (NVDA)
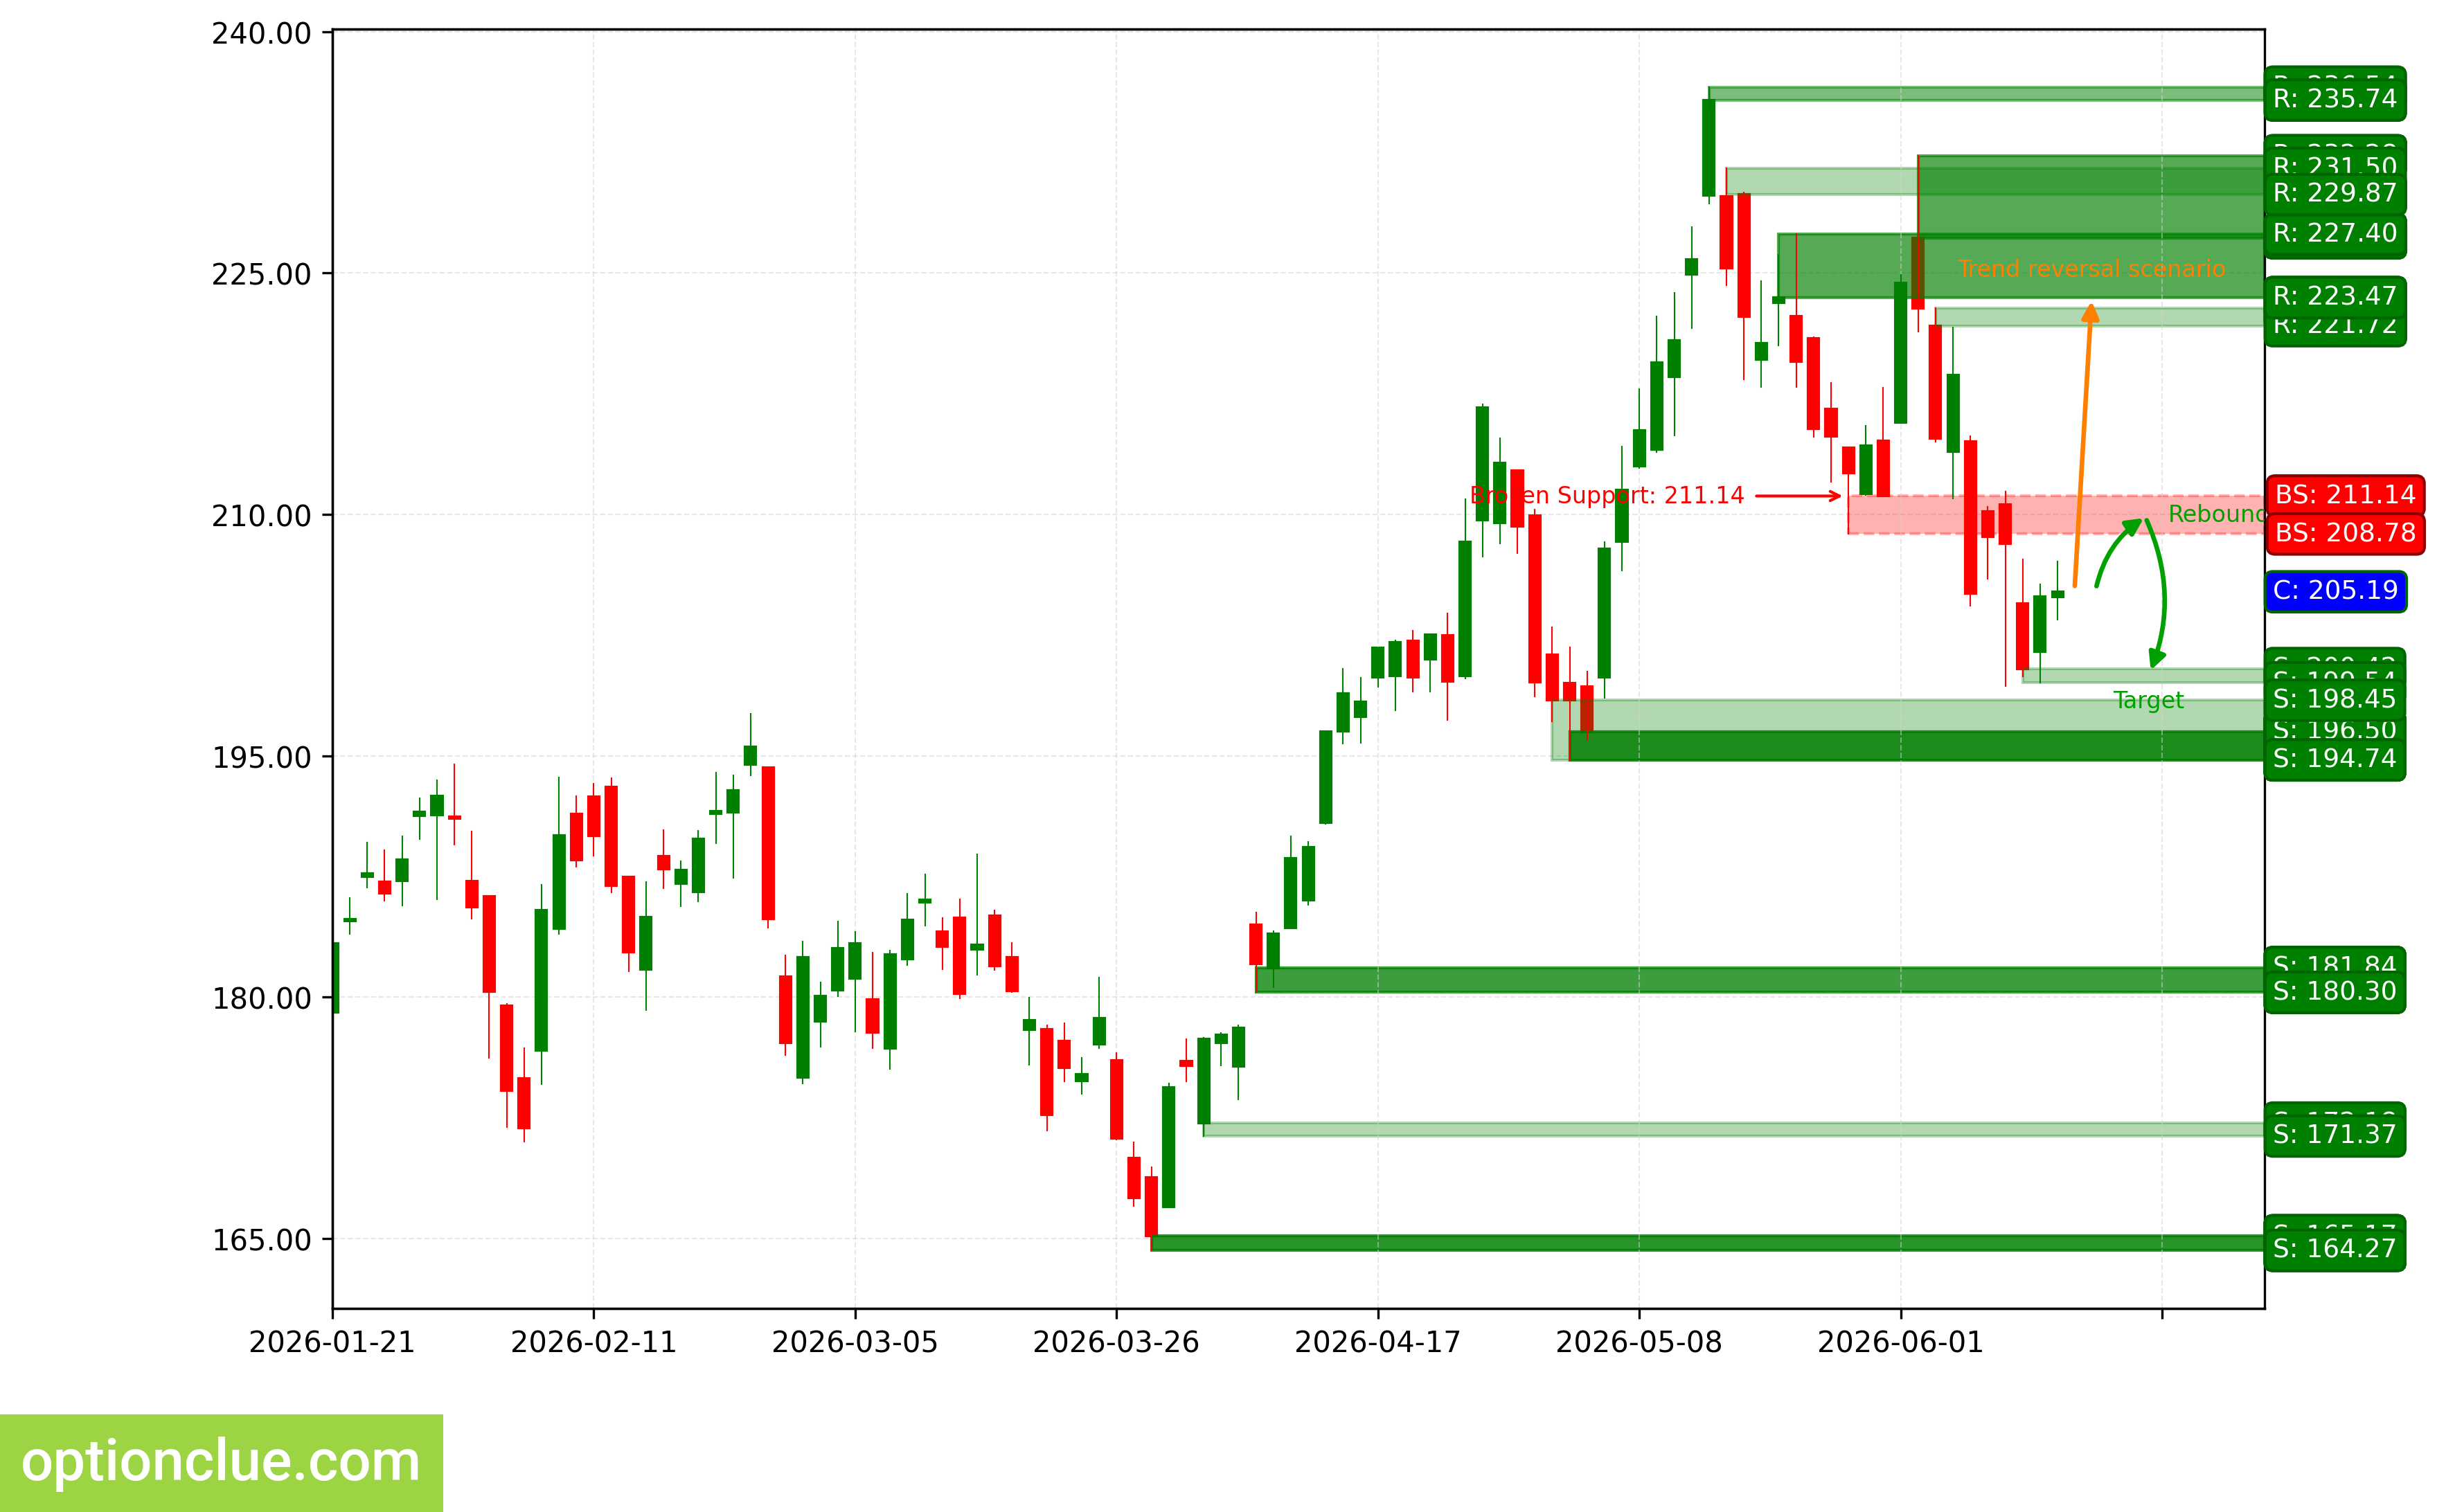
The bearish trend continues, an impulse wave is developing. A sell entry point on a rebound may form after a correction is formed. The last broken level is support (208.78 — 211.14). The breakout occurred 6 candlesticks ago.
An intermediate target for the downward movement is the support level with boundaries at 199.54 — 200.42. In the case of successful trend development, a further target will be at the support level with boundaries at 180.30 — 181.84.
The potential reward/risk ratio from current prices, when setting targets and fixing risks according to the daily timeframe levels, could be small (around 0.2:1). When using the further target — also insignificant (around 0.9:1). If the next correction ends near the resistance level (221.72 — 222.82), the potential reward/risk ratio could be approximately 2:1. For the further target — around 4:1. If the correction ends near the last broken level (208.78 — 211.14), the potential reward/risk ratio could be small (approximately 0.4:1). If choosing the further target — around 1.3:1.
Short positions will remain relevant as long as the market stays below the nearest resistance level with boundaries at 221.72 — 222.82. If the market successfully consolidates above this nearest resistance, the trend will reverse to the opposite (bullish).
NVDA. Technical analysis. D1.
Tesla Inc (TSLA)
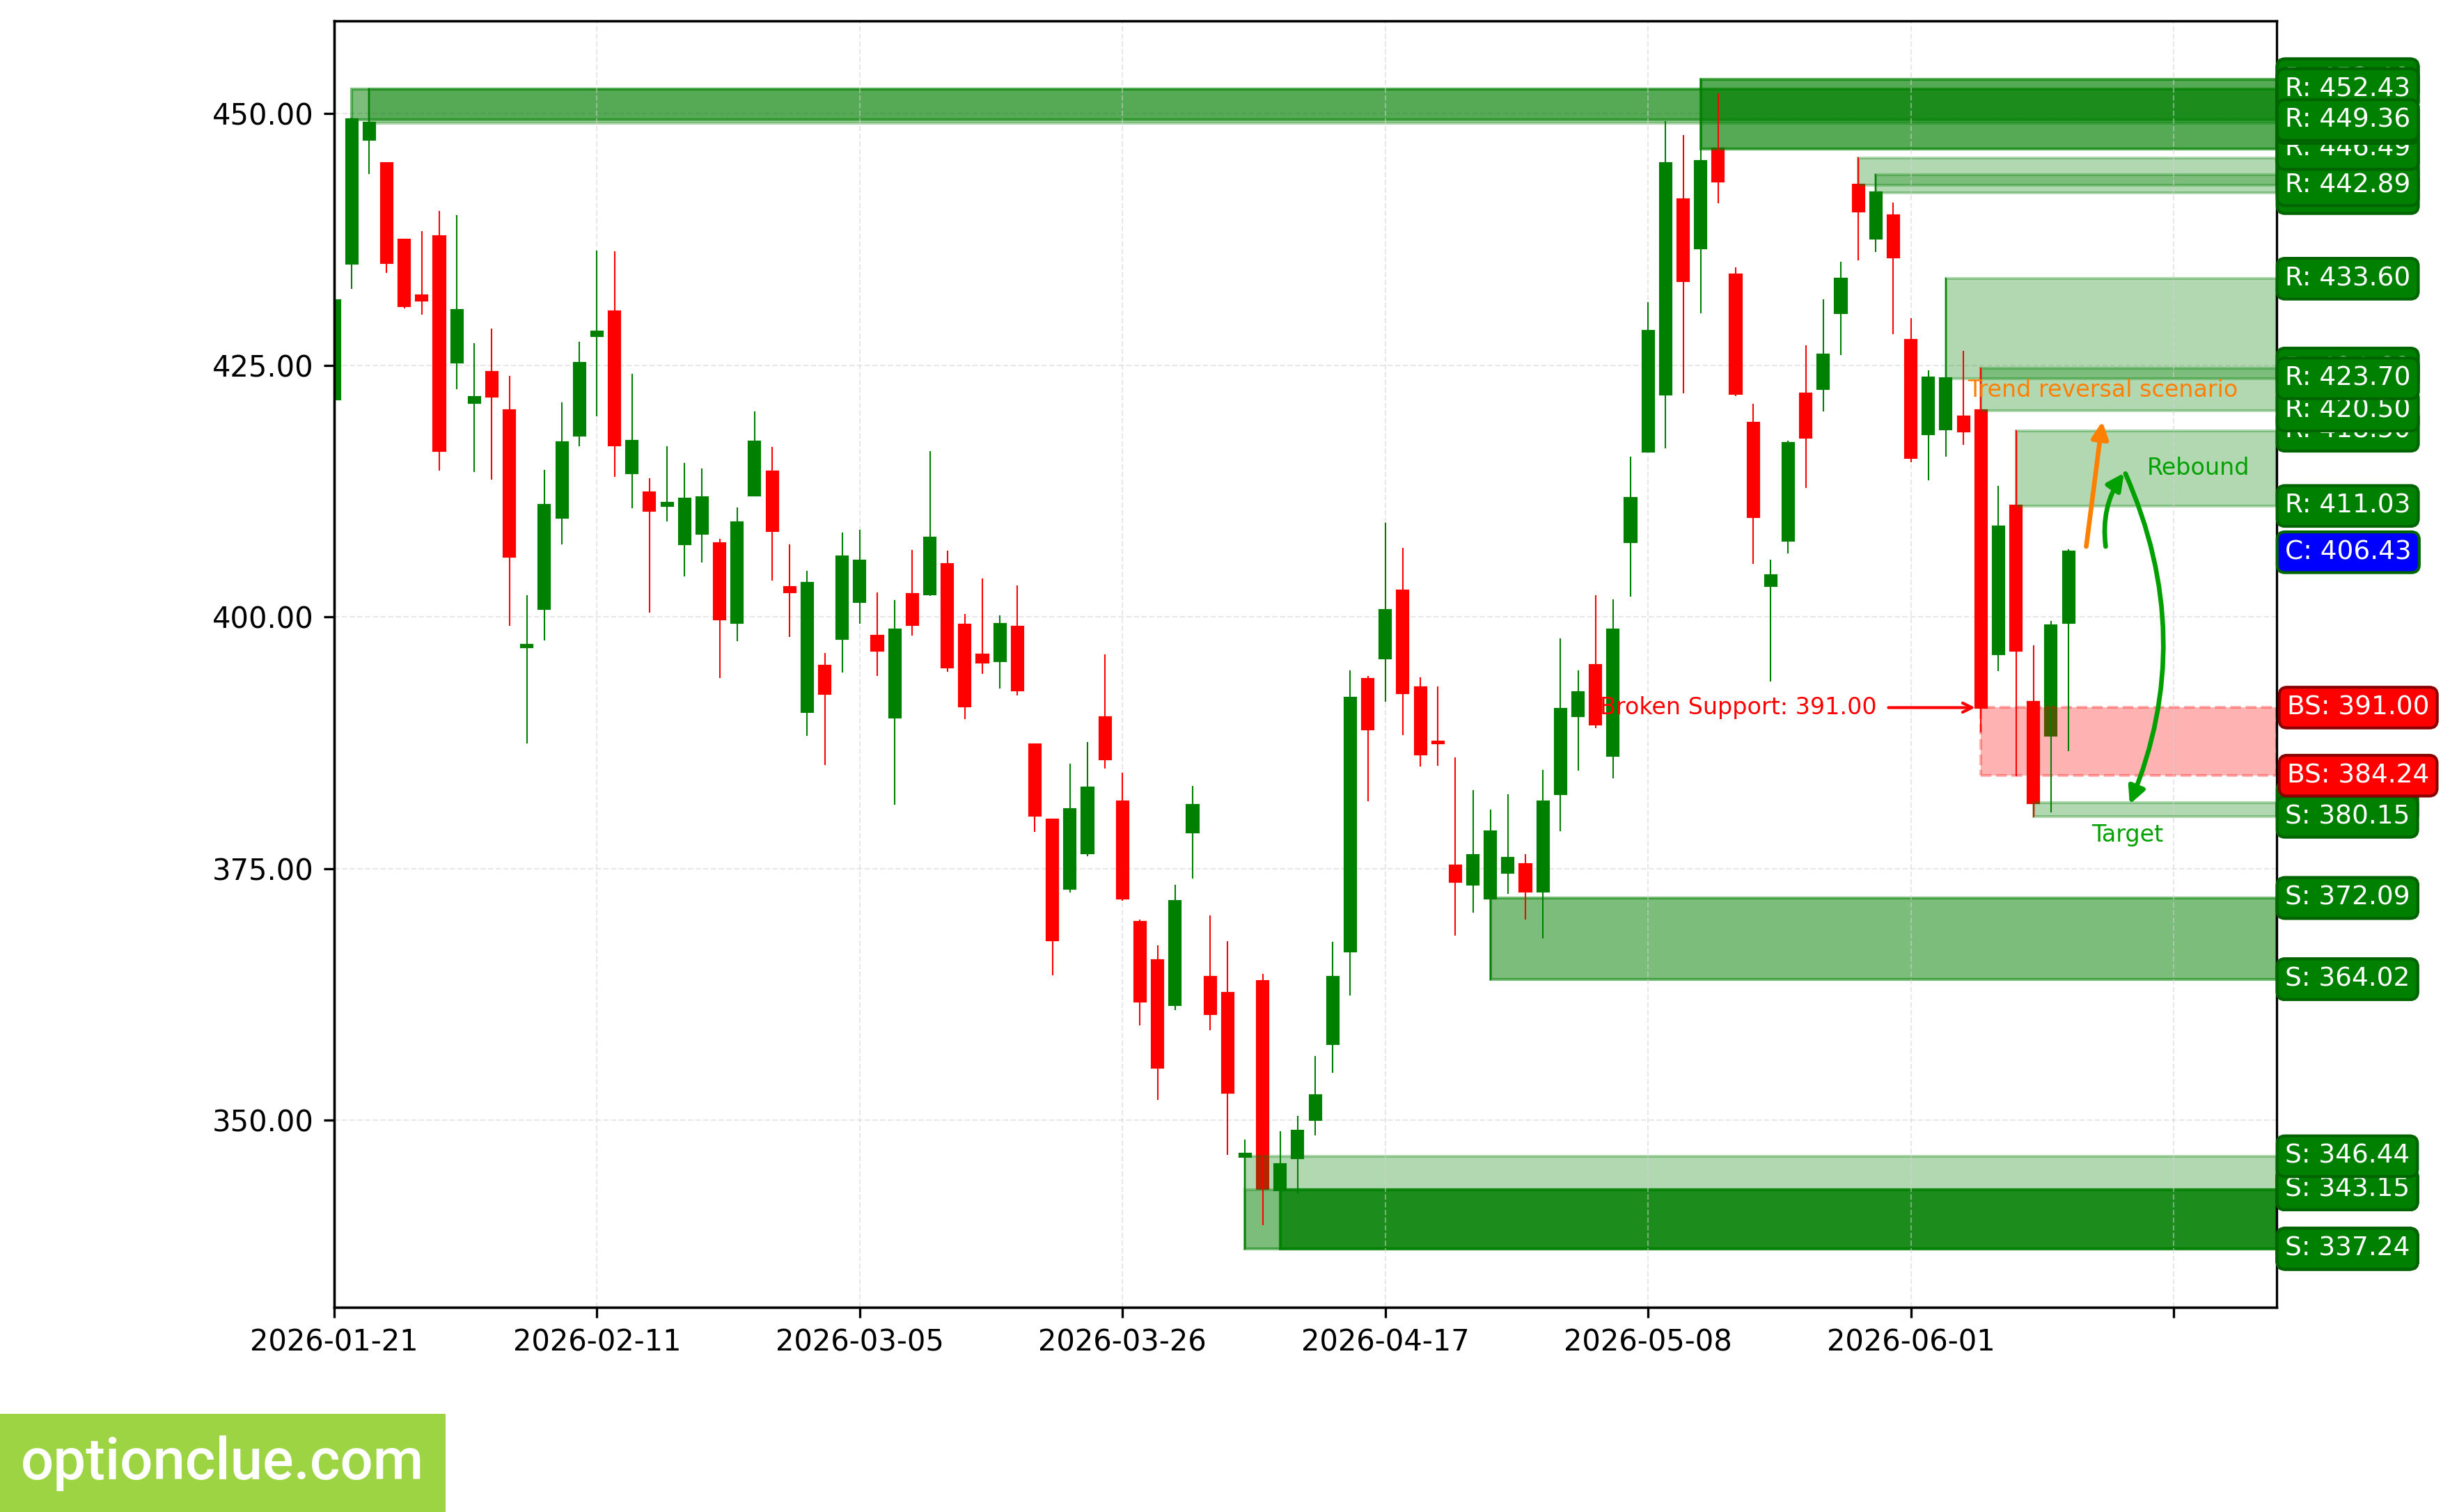
The bearish trend continues, a corrective wave is developing. A sell entry point on a rebound may form after the current correction is completed. The last broken level is support (384.24 — 391.00). The breakout occurred 3 candlesticks ago.
An intermediate target for the downward movement is the support level with boundaries at 380.15 — 381.59. In the case of successful trend development, a further target will be at the support level with boundaries at 337.25 — 343.15.
The potential reward/risk ratio from current prices, when setting targets and fixing risks according to the daily timeframe levels, could be small (approximately 0.8:1). When using the further target — around 2.1:1. If the next correction ends near the resistance level (411.03 — 418.50), the potential reward/risk ratio could be around 1.5:1. For the further target — approximately 3.3:1.
Short positions will remain relevant as long as the market stays below the nearest resistance level with boundaries at 411.03 — 418.50. If the market successfully consolidates above this nearest resistance, the trend will reverse to the opposite (bullish).
TSLA. Technical analysis. D1.
Summary
From a medium-term trading perspective, financial instruments with a near-complete correction on the Daily timeframe and/or the most potentially promising reward/risk ratio are: TSLA, NVDA, ETH, AUDUSD. In the near future, depending on the depth of the market correction, the following may become noteworthy: GBPUSD, USDCHF, EURUSD.
The remaining financial instruments on the watchlist may also be of interest, but conditions for a rebound on the daily timeframe in these markets will likely appear no earlier than in a week.