If price comes closely enough to an important horizontal support or resistance level, the market move may slow down and correction or even trend reversal may occur. Levels indicator plots a set of support and resistance levels that helps identify exit points for stop-loss and take-profit orders placing and entry points when price moves into a support or resistance zone and rebounds from it to the direction of the major trend.

for METATRADER

Levels Indicator User Guide
How to install the indicator to your MetaTrader 5 platform
In most cases, to install the indicator to your Metatrader 5 platform just double click on the indicator file sent to your email. After that you will find the Levels indicator in your tools list – in the Custom indicators and also in the Indicators folder of the “Navigator” window.
For some operating systems you should manually copy the indicator to the appropriate folder:
- Open the data folder: File> Open Data Folder.
- Navigate to the appropriate folder: MQL5> Indicators.
- Paste the indicator file to this folder.
The Levels indicator is ready to use in your platform.
How to install the indicator to your MetaTrader 4 platform
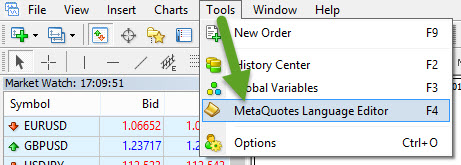
1. Locate the Levels indicator file on your computer (it has an .ex4 filename extension) and copy it to «MQL4/Indicators» folder. In order to find this folder, open MetaTrader 4 and press F4 or click on «Tools» menu and select «MetaQuotes Language Editor».
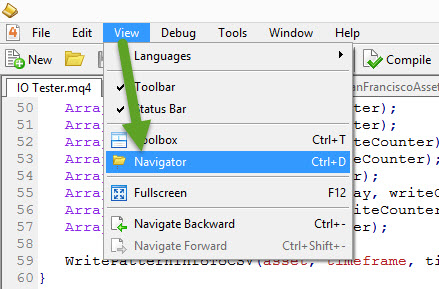
2. This will open the MetaEditor programming environment, where one should click on «View» menu and select «Navigator».
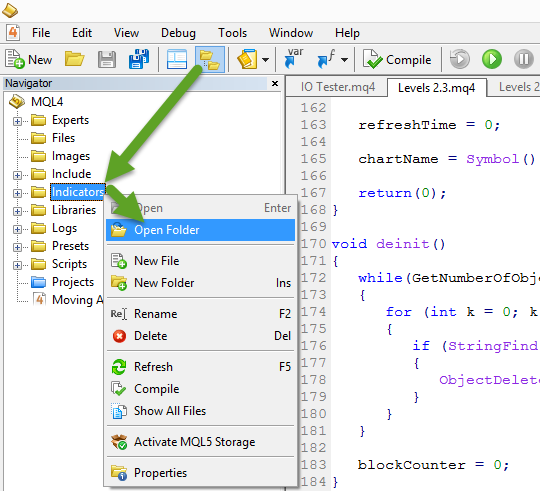
3. Once «Navigator» window appears, right-click on «Indicators» folder. Drop-down menu will appear where one should select «Open folder». This will open «Indicators» folder with indicators installed. Paste the indicator file to this folder.
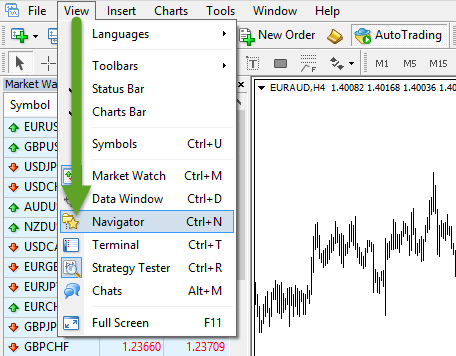
4. Restart MetaTrader 4. After that the indicator will be ready to start from «Navigator» window. To open this window click on «View» menu and select «Navigator».
User manual
- How to install the indicator
- How to setup the indicator
- How to save and load settings
- Which levels are plotted on a chart
Levels Indicator has been created in order to to simplify the process of plotting support and resistance levels and zones on selected timeframes. It significantly reduces the time needed to plot them on the chart and simplifies a market analysis process.
Others links
How to setup the indicator
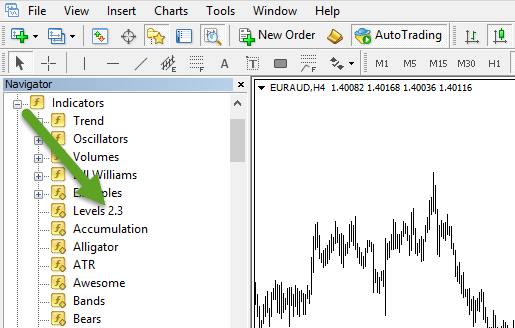
The indicator can be added to a chart by double-clicking within the «Navigator» window, or by clicking-and-dragging it onto a chart. It will apply the indicator to the active chart.
After that the Indicator Properties window will appear. One can choose parameters of the indicator on the «Inputs» tab.
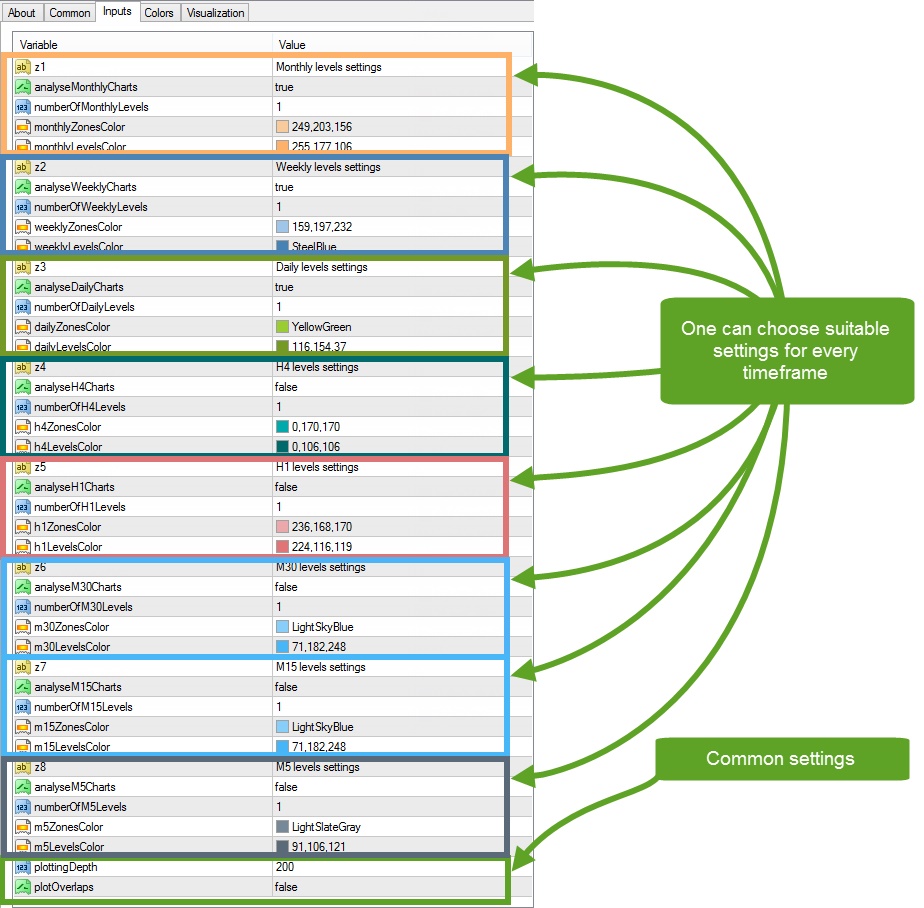
One can choose suitable settings for every timeframe:
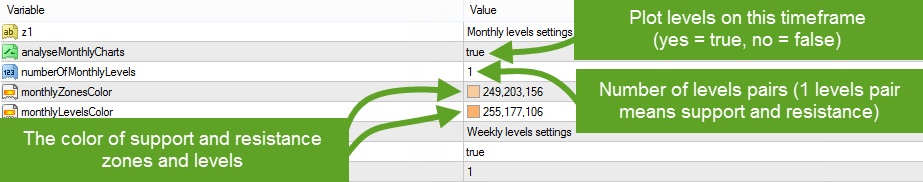
- Plot levels on this timeframe (yes = true, no = false). The indicator plots horizontal levels on different timeframes, Monthly, Weekly and Daily by default. If one wants to see, for example, hourly (H1) levels, one should set «analyseH1Charts» parameter from false to true. To plot levels on M5 timeframe set «analyseM5Charts» to true etc. If one seeks for entry points on H4 timeframe, then one may consider to enable H4, Daily (D1), Weekly (W1) and Monthly (MN) levels.
- Number of levels pairs (1 levels pair means support and resistance). By default this parameter equals 1, so there is only one support and one resistance on every selected timeframe. In most cases such number of levels is sufficient to determine major price targets. If one wants to see further, more optimistic targets, one should consider to increase this parameter.
- The color of support or resistance zone.
- The color of support or resistance price level.
In the lower part of the window one can see general settings, that are applied to every timeframe:
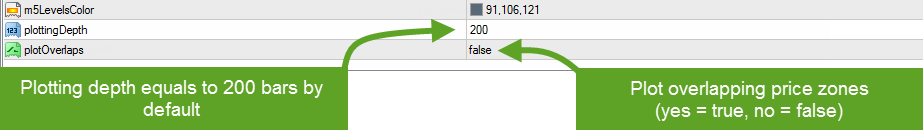
- Plotting depth equals to 200 bars by default. It means that support and resistance levels are built using last 200 bars. The higher the plotting depth the more distant levels are plotted and the higher the system load. If you are interested in 1-2 nearest levels, you might consider decrease this parameter to 30-40.
- Plot overlapping price zones (yes = true, no = false) – this parameter lets one choose whether overlapping price zones of a similar timeframe are plotted or not. It makes the price chart clearer and more vivid. This parameter is disabled by default, but if one wants to see all possible levels and their overlaps, one might consider to turn it on.
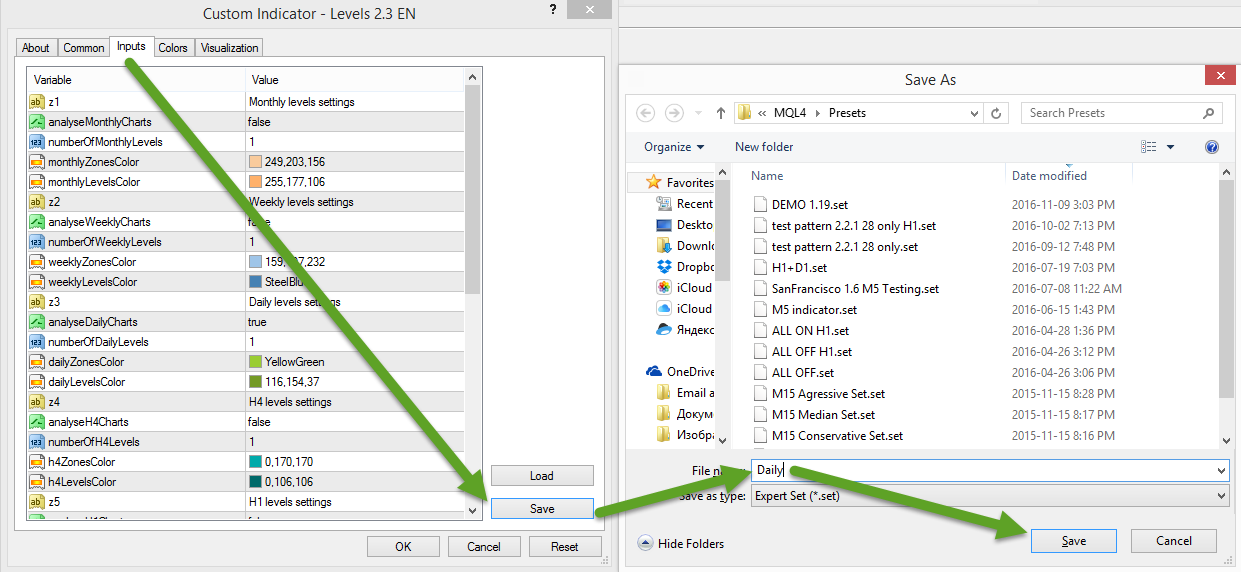
How to save and load indicator settings in MetaTrader
One can easily save and load indicator input parameters.
Open indicator’s settings window and switch to Inputs tab. Then set the desired values for the indicator’s parameters and click Save. Choose a name for the settings file and and click on Save button. In order to load indicator’s parameters set click on Load button and choose the file with the saved inputs:
Which levels are plotted on a chart
Levels 2.3 plots nearest support and resistance levels which haven’t been broken yet and therefore can be used as potential price targets to calculate stop-loss and take-profit. Besides, these levels can be used to find entry signals that appear when price rebounds near one of the levels during a deep market correction.
The indicator plots only the most important horizontal supports and resistances on selected timeframes. It could be either levels of a single or multiple timeframes. One can choose exact timeframes in the indicator’s settings (from M5 to MN).
Weekly supports and resistances are plotted as horizontal levels and rectangular price zones.